
Introduction
Metapenaeus ensis, commonly known as the greasyback shrimp or sand shrimp, is one member of the family Penaeidae.1 The shrimp is a commercially valuable species native to the Indo-West Pacific region. Widely distributed throughout the Indian and West Pacific Oceans, it’s found in areas like Sri Lanka, Malaysia, southeast China, Japan, and northern Australia.1,2 Beyond its wild populations, M. ensis is also a prominent species in aquaculture, particularly across Southeast Asia. Countries like Malaysia, Indonesia, Thailand, Philippines, Taiwan, and Vietnam all have established traditions of cultivating this shrimp.3 In Vietnam, M. ensis thrives in various coastal regions, including Hai Phong, Quang Ngai, Da Nang, Thua Thien Hue, Quang Tri, and Quang Binh.4,5 One particularly important habitat for M. ensis in Vietnam is the Tam Giang – Cau Hai lagoon system. Located within Thua Thien Hue province, this lagoon complex holds the distinction of being the largest semi-closed lagoon system in all of Southeast Asia. Stretching over a vast 68 kilometers and covering an impressive 22,000 hectares, the lagoon is further divided into four distinct sub-lagoons progressing north to south: Tam Giang lagoon, Sam lagoon, Ha Trung - Thuy Tu lagoon, and Cau Hai lagoon. The Tam Giang – Cau Hai lagoon system boasts exceptional biodiversity, flourishing with a diverse array of ecosystems. Over 1,296 species have been identified within the lagoon, with a remarkable 41 classified as rare and precious.6,7 M. ensis plays a vital role within the Tam Giang – Cau Hai ecosystem. Local communities heavily rely on harvesting this shrimp to supply the food chain and generate income, thanks in part to the high quality of its meat. Various fishing techniques, including barrier nets, cast nets, trap nets, and bag nets, are employed to capture M. ensis.
DNA barcoding, a technology utilizing short, standardized DNA sequences, is a powerful tool for assessing biodiversity, identifying species, and understanding evolutionary relationships (phylogeny).8 It relies on analyzing a specific gene segment, the cytochrome oxidase subunit I (COI), to distinguish between species. This technique has proven valuable in various studies, including evaluating biodiversity in a mangrove hotspot,9 assessing the diversity of freshwater shrimp in Henan, China10 and identifying commercially important marine shrimp in India.11 Furthermore, the complete mitochondrial genome of M. ensis has been sequenced and deposited in a public database.12 DNA barcoding plays a critical role in furthering our understanding of shrimp biodiversity. It provides a reliable and efficient method for species identification, population differentiation and informing conservation efforts.
The Tam Giang – Cau Hai lagoon stands as the primary hub for shrimp production and fishing in central Vietnam. The adverse impacts of climate change are keenly felt, particularly in coastal regions, affecting human lives and livelihoods.13,14 Various manifestations of climate change, including escalating temperatures, sea-level rise, diseases, harmful algal blooms, alterations in rainfall patterns, uncertainties in external input supplies, changes in sea surface salinity, and severe climatic events, can profoundly influence the natural resources of M. ensis in aquatic ecosystems. This study contributes to this growing body of knowledge by providing the first data on the genetic diversity and population structure of M. ensis within the Tam Giang – Cau Hai lagoon. We sequenced and analyzed the COI gene region of 91 individuals collected from four distinct locations within the study area, expanding the existing COI sequence database for this species.
Materials and Methods
Sample collection
Specimens of M. ensis were collected from the Tam Giang – Cau Hai lagoon between February 2022 and December 2023 (Table 1). Two methods were employed: direct capture and acquisition from local fishermen within the sampling region. To maintain specimen integrity for morphological analysis (shaping and photographing), shrimp were immediately placed in an icebox and transported swiftly to the laboratory. For subsequent DNA extraction, one gram of muscle segment or a single whole leg (perepod) was excised from each specimen and stored at -80°C.
Genomic DNA extraction, PCR and sequencing
One gram of muscle segment or a single whole leg (perepod) was ground in liquid nitrogen using a mortar and pestle. Total DNA was extracted following the manufacturer’s protocol for the GeneJET Genomic DNA Purification Kit (Thermo Fisher Scientific). Genomic DNA concentrations were quantified using a Nanodrop 2000 spectrophotometer (Thermo Fisher Scientific Inc., USA) and stored at 4 °C until further analysis.
The mtCOI gene region was amplified using polymerase chain reaction (PCR) with specifically designed primers based on the M. ensis complete mitochondrial genome (Accession numbers: MK500697.1, NC_026834.1 and ON599337.1) and a previous study.9 The primers were: forward 5’-CTTGCAGGGGTCTCATCAAT-3’ and reverse 5’-GCGAAGATCCCAAATACAGC-3’. PCR reaction contained 0.2 µg genomic DNA, 10 pmol primers, 12.5 µL (2X) PCR Master Mix (Thermo Fisher Scientific) in a total volume of 25 µL. The PCR reaction was conducted with the following PCR condition: 1 cycle at 95 oC for 5 min; 30 cycles at 95 oC for 30 s, 55 oC for 30s, and 72 oC for 30s; and 1 cycle at 72 oC for 5 min. The resulting PCR amplicons were visualized on a 1.0% agarose gel stained with Safe-dye™ and examined under UV light. Sanger DNA sequencing was subsequently performed at First Base (Malaysia) using the Capillary Electrophoresis method by using the above PCR primers.
Sequencing analysis and NCBI database’s registration
The obtained COI sequences were extracted from chromatogram files after low quality bases were trimmed, and the forward and reverse sequences were joined into contigs aligned using the MUSCLE algorithm in the MEGA 11 Suite15 and edited using BioEdit 7.2.5 software.16 The nucleotide sequences were used as queries to search for homologous sequences in the NCBI database using BLASTn. The homologous sequences were used as references for comparison. Finally, the sequences were registered in the NCBI database with accession PP348174 to PP348207.
Genetic diversity analysis
To analyze the genetic diversity, various indices were calculated using DnaSP v6.10.01 software17: number of variable sites (S), number of mutations (η), average number of nucleotide differences (k), number of haplotypes (h), nucleotide diversity (π), haplotype diversity (Hd), Tajima’s D, and Fu’s Fs. We used Fu’s Fs18 and Tajima’s D19 to assess population expansion patterns in M. ensis. Fu’s Fs analyzes the distribution of haplotypes, while Tajima’s D compares pairwise differences among sequences to estimate allele frequency.20 We determined the genetic differentiation index (Fst) and evaluated genetic differences within and among populations using analysis of molecular variance (AMOVA) with Arlequin software.21 Lastly, a Bayesian phylogenetic tree was reconstructed with BEAST version 2.7,22 employing the HKY substitution model and the Coalescent Bayesian Skyline tree prior. The Markov chain Monte Carlo (MCMC) search was set at 1,000,000 generations with burn-in at 10%. The iTOL web tool (https://itol.embl.de/) was used to visualize and refine the phylogenetic trees.
Results
Genetic Polymorphic Specialty of M. ensis in Thua Thien Hue
Specimens of greasyback shrimp (M. ensis) were collected from 09 different places of Tam Giang – Cau Hai lagoon and were divided into 04 populations (Table 1). A total of 91 samples were preserved and extracted total genomic DNA. The COI amplicons were visualized by Agarose electrophoresis and sequenced with the size of 695 bp. The obtained sequences were aligned with sequences on GenBank using the BLAST search shown that M. ensis samples collected in Tam Giang – Cau Hai lagoon had a very-high similarity rate of 98.85 % - 99.86 % in compared to with 3 references COI fragment sequences MK500697.1, NC_026834.1, ON599337.1 (Table 2).
Genetic Diversity
Genetic diversity is the biological variation occurring within a species to make it possible for species to adapt with the environment changes. Analysis of 91 individuals gathered from the studied area, 34 unique haplotypes and 38 polymorphic sites were defined. Thirty four haplotypes were registered on GenBank with the accession number from PP348174 to PP348207. A total of 62 variable sites (S) and 39 mutations were identified. The nucleotide diversity (π) was determined to be 0.00517 ± 0.00036, while the haplotype diversity (Hd) was 0.884 ± 0.023 (Table 3). Notably, across all sampling locations, the Hd value varied, with the lowest and highest values observed in samples from LC and TG, respectively. Specifically, samples obtained from TG showed the highest Hd (0.938 ± 0.039), while the lowest Hd (0.842 ± 0.061) was observed in samples collected from LC. In terms of π, LC exhibited the highest value (0.00588 ± 0.00070), whereas the lowest value (0.00489 ± 0.00064) was recorded in samples obtained from ST (Table 3). The results showed that the greasyback shrimp (M. ensis) exhibited high haplotype diversity and nucleotide diversity.
Genetic Structure
The AMOVA analysis revealed that genetic variation within M. ensis populations was the primary source of diversity, accounting for 100.73%. In contrast, genetic differentiation among groups (i.e., sampling sites) was negligible and statistically insignificant at -0.73% (Table 4). Furthermore, the low and statistically insignificant fixation index (Fst = -0.0073, P = 0.712) corroborated the lack of substantial genetic differences between the M. ensis populations sampled from different lagoons across Thua Thien Hue, Vietnam. Pairwise Fst comparisons further support this (range: -0.02177 to -0.00439, Table 5). In most populations, Fu’s Fs and Tajima’s D values did not indicate significant population expansion, with the exception of TG and ST sites for Fu’s Fs (Table 3). Overall, these findings suggest minimal genetic differentiation among the M. ensis populations within the Tam Giang-Cau Hai lagoon system.
Genetic Distance
Genetic distance is a measure of the genetic divergence between species or between populations within a species, whether the distance measures time from common ancestor or degree of differentiation.23 Evaluations were made on 91 sequences to determine the evolutionary divergence between nucleotide sequences of COI gene segments. The findings indicated that the M. ensis samples collected in Tam Giang – Cau Hai lagoon exhibited significant genetic similarities (Table 3). In addition, the M. ensis population in the studied area demonstrated a high level of genetic diversity among individuals, with genetic distances ranging from 0.00490 to 0.00549. In general, there were no substantial disparities in genetic distance between populations when comparing pairs. Genetic distance was close genetic interconnectedness among the populations.
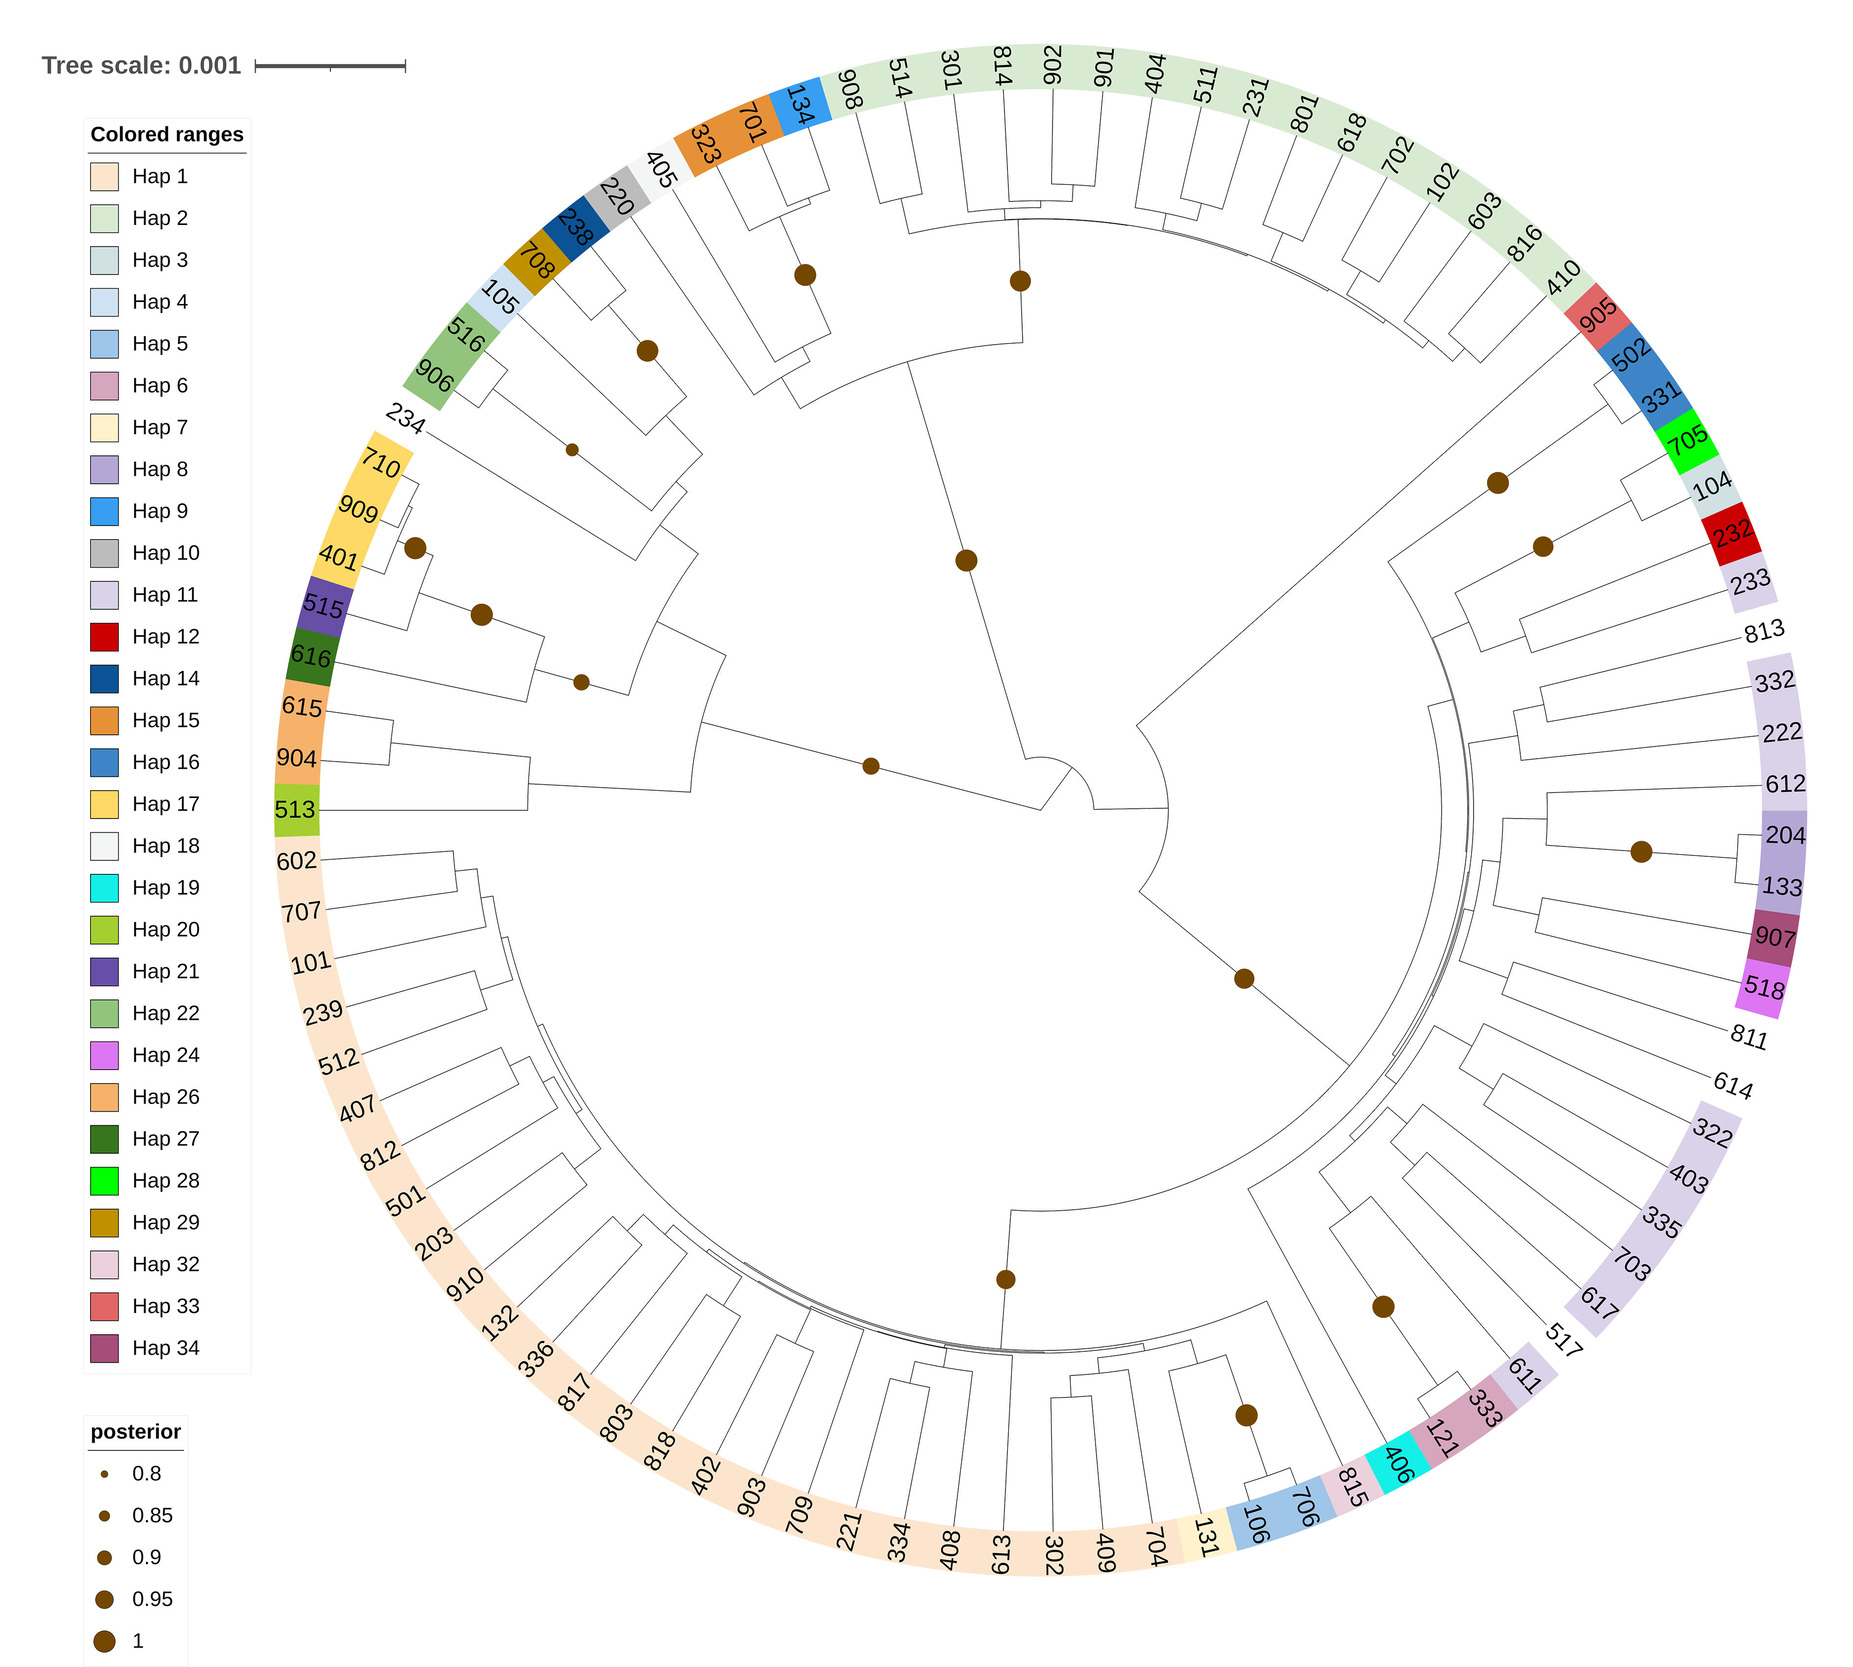
Based on the sequence of COI segments of collected individuals, the phylogenetic tree was built using Bayesian phylogenetic tree reconstruction method by Beast 2.7 (Figure 1). The phylogenetic tree showed a total of 34 haplotypes were detected in 91 M. ensis sequences. Haplotype Hap 1, with observed frequently, was classified as the largest clade of the tree and was prevalent in samples collected from 4 distinct lagoons, namely TG, ST, CH and LC. Haplotype Hap 2 emerged as the second most predominant haplotype found in samples from these lagoons and grouped into the second largest clade. Haplotype Hap 11 also exhibited a high frequency in samples from TG, ST, and CH, located in the first largest clade with Hap 1, along with several other individual haplotypes. The post-test probability supporting the clades were quite high, demonstrating the close kinship between the studied populations.
Discussion
DNA barcoding is a potent technique employed in species identification and exploration. It relies on standardized short DNA segments such as the cytochrome oxidase subunit I (COI) gene for animals, and for plants: rbcL, matK, and ITS, as well as ITS for fungi, and the 16S rRNA gene for bacteria and archaea. This method establishes a reference DNA barcode library.8,24 This technique has been widely applied in various domains, including biodiversity research, conservation, management of aquatic ecosystems, and ensuring the accuracy of seafood labeling and quality.25,26 Notably, the mitochondrial COI gene can form the cornerstone of a global bioidentification system for animals.26 Comparative analyses utilizing GenBank BLASTn and BOLD search engines consistently demonstrate the COI gene’s efficacy in identifying species with authenticated reference sequence data.27 The fragment of COI gene has been efficiently used for shrimp species identification and genetic diversity.9–11,28,29 The determination of sample size and selection of sampling locations are critical tasks.30 Prasertlux et al. conducted a study on COI polymorphism, analyzing 77 samples.31 Additionally, Shokoohmand et al. collected and analyzed 60 samples of wild white shrimp (M. affinis) for diversity.28 Similarly, Jamaluddin et al. utilized 74 shrimp specimens of the COI gene to assess patterns of DNA barcode variation in mangrove biodiversity.9 In our study, 91 samples from 04 different populations were collected and analyzed for genetic diversity, matching the sample size of the aforementioned studies.
The Tam Giang – Cau Hai lagoon system encompasses diverse aquatic vegetation, river estuaries, and mangrove forests, fostering a habitat for both aquatic and terrestrial life forms. The lagoon also supports various species of high economic value, such as shrimp and fish, which contribute to the socio-economic development of the region. Aquaculture in the lagoon plays a significant role in the socio-economic development of the region, providing livelihoods for many local residents.6,7,32,33 In a previous study, Nhung et al. (2015) distinguished between three types of aquaculture practices in the region: Earth ponds, net/bamboo stake ponds, and net enclosures.34 The increasing amount of aquaculture structures reduced the water circulation, causing a build-up of contaminants in the lagoon.34 Since 1995, there has been a notable deterioration in the environmental condition, leading to proposals for safeguarding the lagoon through the construction of wastewater treatment facilities.35 The adverse impacts of climate change on shrimp production and aquaculture are evident.13,14,34 Genetic diversity analysis based on the mtCOI gene segment could provide crucial data for proposing measures to conserve aquatic resources.
M. ensis is celebrated for its remarkable productivity and delicious meat quality, recognized as a delicacy in Thua Thien Hue province, Vietnam. Research in the Tam Giang - Cau Hai lagoon has centered on various penaeid prawn species4 and the histological structure of the male gonad in greasyback shrimp.36 In assessing the genetic diversity and population structure of M. ensis, analysis of partial COI sequences from populations in the Tam Giang Cau Hai lagoon revealed 34 haplotypes and 38 polymorphic sites (Table 1). The relatively robust genetic diversity observed in the M. ensis population of Tam Giang - Cau Hai lagoon (Tables 2 and 3) may be related to the random introduction of individuals from diverse spawning grounds or adaptations to local environmental factors and living conditions in Thua Thien Hue. Some individuals exhibited a tendency towards divergence compared to the overall evolutionary trajectory of the M. ensis population in Tam Giang – Cau Hai lagoon, possibly due to variations in habitat and geographical context. Genetic differentiation among populations is considered weak when the Fst value ranges from 0 to 0.05 (Table 5). Similarly, relative weakness in genetic differentiation occurs when Fst falls between 0.05 and 0.15. However, when Fst surpasses 0.15, genetic differentiation reaches a notably high level.37 The substantial genetic diversity observed in the studied M. ensis populations suggests robust genetic interchange among shrimp populations within the lagoon system, facilitated by flats and the drift of larvae from spawning grounds into lagoons via estuaries, as well as the dynamic flow patterns within the lagoon.
Conclusions
The Tam Giang - Cau Hai lagoon, a recognized biodiversity hotspot in Southeast Asia, sustains diverse species and local food sources. Greasyback (M. ensis) shrimp, a commercially important delicacy, prompted a survey to assess its diversity within the lagoon due to concerns over potential overexploitation. This study presents the first data on greasyback shrimp diversity, revealing high levels of genetic variation with 34 haplotypes identified among 94 individuals. These findings provide insights into population structure and offer a crucial foundation for future research and potential conservation efforts aimed at ensuring the sustainability of this resource and the lagoon ecosystem.
Acknowledgments
This work was supported by grant from the Ministry of Education and Training of Vietnam, under the grant number B2022-DHH-14 and Hue University, under the Core Research Program, Grant No. NCM.DHH.2022.07. [Tran Vinh Phuong] was funded by the Master, PhD Scholarship Programme of Vingroup Innovation Foundation (VINIF), code [VINIF.2023.TS.089].
Authors’ Contribution
Conceptualization: Nguyen Xuan Huy (Equal), Nguyen Ty (Equal), Tran Van Giang (Equal), Tran Vinh Phuong (Equal). Data curation: Nguyen Xuan Huy (Equal), Nguyen Ty (Equal), Tran Van Giang (Equal), Tran Vinh Phuong (Equal). Formal Analysis: Nguyen Xuan Huy (Equal). Funding acquisition: Nguyen Xuan Huy (Lead). Investigation: Nguyen Xuan Huy (Equal), Nguyen Ty (Equal), Tran Van Giang (Equal), Tran Vinh Phuong (Equal). Methodology: Nguyen Xuan Huy (Equal), Nguyen Ty (Equal). Project administration: Nguyen Xuan Huy (Lead). Resources: Nguyen Xuan Huy (Equal), Nguyen Ty (Equal). Software: Nguyen Xuan Huy (Equal), Nguyen Ty (Equal). Supervision: Nguyen Xuan Huy (Lead). Validation: Nguyen Xuan Huy (Lead). Visualization: Nguyen Xuan Huy (Lead). Writing – original draft: Nguyen Xuan Huy (Lead), Nguyen Ty (Supporting). Writing – review & editing: Nguyen Xuan Huy (Lead).
Competing of Interest – COPE
No competing interests were disclosed
Ethical Conduct Approval – IACUC
The shrimp collection and experimental protocols followed the guideline from the Animal ethics committee of Hue Univerversity (https://huaf.edu.vn/animalethics/).
Informed Consent Statement
All authors and institutions have confirmed this manuscript for publication.
Data Availability Statement
All are available upon reasonable request.