


1. Introduction
Spawning grounds are the birthplace of fish life, but with the construction of various barrage projects, many spawning grounds have thus been destroyed, and fish can only look for places with similar environmental factors for spawning. Currently, there are relatively few studies on fish spawning grounds, and the link between fish spawning behavior and physicochemical factors of spawning grounds has not been established. However, the flow rate or riverbed substrate conditions determine the incubation status of fertilized eggs. Especially for the fish that produce sinking and sticky eggs, the eggs will adhere to water plants or riverbed substrate, whereas in the headwater section of the Chishui River, riverbed substrate is scarce, and the substrate becomes the only bed for the eggs.
Measurement of the surface flow field is one of the ways to study the spawning groundwater flow in the current; it is an essential parameter to describe the characteristics of water flow, not only reflecting the internal turbulent structure of the water flow but also closely related to the process of surface hydrological sediment movement.1 This method mainly uses Large-Scale Particle Image Velocimetry (LSPIV), which is an enhancement of Particle Image Velocimetry (PIV), which has the disadvantages of expensive equipment, small application range (indoor only), and small measurable area (<50cm2). PIV systems require costly equipment, have a small application range (only for indoor use), and have a small measurable area (<50 cm2). Therefore, LSPIV is gradually substituted by LSPIV, which has a large measurement scale, has a low configuration environment, and can be used in field environments. Studies have shown that the accuracy of LSPIV meets the needs of field measurements2,3 and has a relatively favorable tracer effect, in which artificial tracers such as wax,4 rice crackers,5 starch bubbles,6 and square thin wood slices,7 etc.; and natural tracers include air bubbles, suspended sand, and chlorophyll, etc.8 Currently, handheld measurements and airborne measurements are mainly adopted, and Beat9 and Yu10 both successfully captured and processed video images using smartphones; airborne measurements are mainly based on unmanned aerial vehicles (UAVs)11 and hot-air balloons,12 among which Detert successfully measured the surface flow field of a river segment with a length of 100-1000 m using the UAV-based LSPIV technique. Detert has used the UAV-based LSPIV technique to successfully measure the surface flow field of a river segment of 100-1000m in length. Applications of this technique include flow characterization of natural river confluence zones,13 shallow water flow,14 vegetated flow,15 and diffuse flow,16 as well as flow measurements.17,18
Sociometric development has led to the overdevelopment of some river basins, which in turn has led to the reduction of in-channel flow, resulting in a relatively drastic change in the hydrodynamic conditions of the river, the morphology of the riverbed, the substrate, etc., which not only destroys the natural habitat of aquatic organisms but also has a direct impact on the benthic organisms and fishes. Studies on the ecological sedimentology of benthos were more popular in the 1970s.19–21 The effects of physical (flow velocity, water depth, sediment, etc.), chemical (water quality), biological (plants, fish), and other environmental factors on the benthic communities and their diversity gradually gained in-depth understanding until the end of the 20th century.22–24 Meanwhile, research in the field of ecological sedimentology was gradually initiated in China, but most of the studies were based on macroscopic models. After entering the 21st century, water-related projects and barrage facilities were constructed in large numbers. The pressure on the ecological environment became increasingly apparent, and the research in related fields gradually increased.25–27 Changes in riverbed substrate affect the community structure and diversity of benthic fauna and fish. McDonald et al. Flow velocity is an important ecological factor affecting the distribution of stream fish populations, especially for juvenile fishes in the early life history stage, which are weak in independent swimming ability, and the appropriate flow velocity is the key to their survival and development. Generally, a certain flow rate stimulation is good for fish growth and physiological metabolic homeostasis. At the same time, a flow rate that is too high will lead to a decline in growth and immune performance. Tao found that the distribution of Chinook salmon smolts was negatively correlated with flow velocity, which may be since slower flow velocity is favorable for smolts to reduce the energy consumed by movement,28 thus guaranteeing their energy supply for feeding, growth,29 and escaping from enemies.30 Found that riverbed substrate is an important environmental factor affecting fish spawning in 2010,31 and due to the sharp decline in fish populations, more and more demersal fish reproduction has been affected, and research on the substrate quality of fish spawning grounds has been taken seriously. It has been shown that fish in the breeding season have a special preference for substrate. For example, Oncorhynchus masou formosanus selects sandy substrates during the breeding season,32 and Brachymystax lenok prefers bedrock or drifting stones.33 The selection of sandy and rocky substrates by the breeding parents helps to fulfill the ecological needs of the embryos and juveniles for harboring after reproduction. Dumont’s studies have shown that small pebbles benefit fish spawning, providing suitable flow conditions and facilitating egg bedding, whereas large gravels provide roosting and shelter.34 David et al. successfully created spawning grounds for AbipdnsdreuI vdsbdns by placing artificial reefs in the river, and 17 other fish species still naturally reproduce there as long as water flow conditions are achieved, demonstrating the importance of substrate for natural reproduction and providing an effective means of restoring spawning grounds.35
The Yunnan section of the National Nature Reserve for Rare and Endemic Fish in the Upper Reaches of the Yangtze River is divided into two areas: the source of the Chishui River and the Shuifu section of the Jinsha River. Among them, the total length of the source section of the Chishui River is 318.42km, with an area of 484.18 hm2(including 10.53 hm2 of undercurrent). Schizothorax grahami belongs to the Schizothorax genus of the Schizothorax subfamily Cypriniformes, and is considered a relatively primitive species in Cypriniformes because its superior temporal bone still exists.36 It is a cold-water benthic fish endemic to the plateau in China, with a living water temperature of 12-20℃ and an optimal growth temperature of 14-18℃. This species is only distributed in the southwest region and exists mainly in the upstream of Chishui River, the upstream of Wujiang River, the upstream tributaries of the Nanpan River and the Beipan River, and the downstream tributaries of the Jinsha River. It is a unique local economic fish in the upper reaches of the Yangtze River.37 In the wild, the fish mainly inhabits canyons or rivers with high flow rates,38 foraging on gravel beaches in summer and diving into river rock crevices or nearby karst caves in winter. Most feed on epiphytic algae,39 mainly diatoms, and eat a minute of aquatic insects.40 In natural conditions, the parent fish spawn in March-May in the shallow migratory bends with pebbles and river sand as substrate. Just hatched fry body length of 1 ~ 1.2mm, the yolk sac is larger; lying flat on the bottom of a gravel-bottomed river with low velocity, the yolk sac is absorbed about 2/3, the fry began to swim upstream against the current to forage.41 The population size of the wild S. grahami has been seriously affected by the construction of water conservancy projects and the destruction of natural habitats.42 Therefore, S. grahami was listed as an endangered species (EN) in China’s Red List of Vertebrates in 2015.43,44
In this study, we used the LSPIV technique to measure the surface flow field of the S. grahami spawning ground and analyze the substrate (particle size and mineral composition) to provide basic data and ideas for the restoration of the spawning ground at a later stage, and to relate the physical structure of the spawning ground to the microchemistry of otoliths to lay the foundation for the later use of otoliths in the investigation of life histories or migratory paths. By studying the physical characteristics of the spawning ground, we can lay a good foundation for the later tracing of the life history of S. grahami; at the same time, we can also provide data support and theoretical references for the conservation of the resources and restoration of the habitat of S. grahami.
2. Materials and methods
2.1. Research area and sampling point location
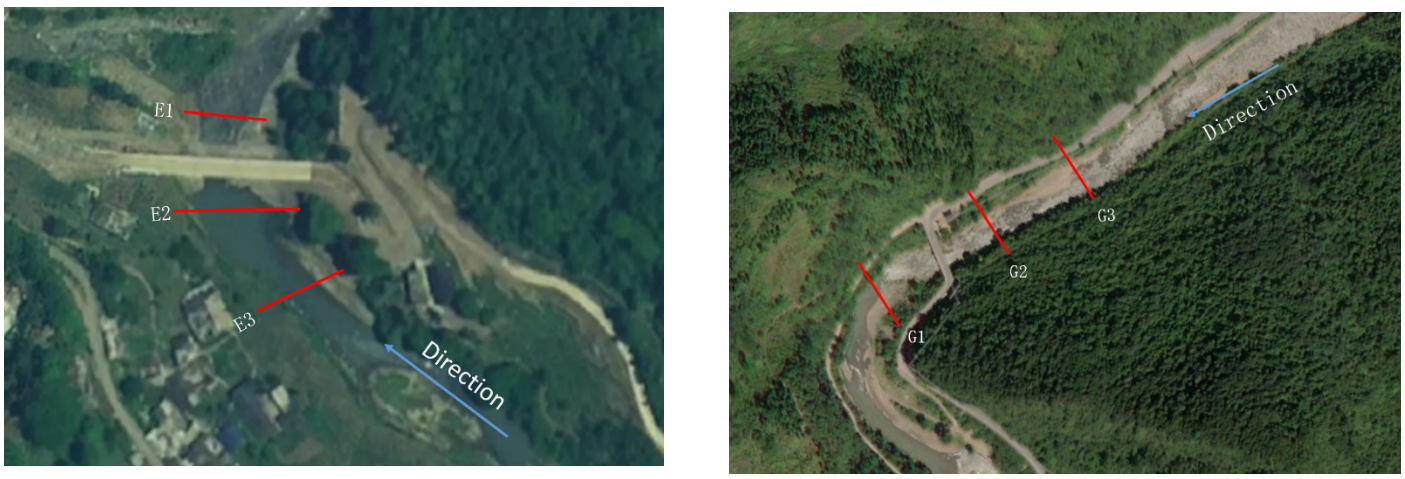
The two river sections in this study were selected based on the spawning ground information of S. grahami provided by the Yunnan Management Bureau of the Upper Yangtze River Rare and Endemic Fish National Nature Reserve, the feasibility of the experiment, and the field study, both are all located in Weixin County, one is Erlongqiangbao (27.75 ° N, 105.18 ° E), the mainstream of Chishui River, and the other is Bamaoba (27.79 ° N, 105.25 ° E), a tributary of the Daoliu River(Figure 1). Both sites are spawning grounds of S. grahami, and the selection of one site in each of the mainstem and tributary streams is conducive to analyzing and comparing the variability and correlation of the spawning grounds of S. grahami in different environments to comprehensively and scientifically characterize the impacts of the physical environmental features of the spawning grounds.

2.2. Measurement of surface fluency
Two and three surface flow field gauging areas were deployed in the Erlongqiangbao and Bamaoba, respectively (Figure 2). In this study, a UAV (DJI Elf 4) was used for video recording using the hovering measurement technique, and the ground control point was a 108 cm*10 cm red metal plate placed at the “+” position. Since the bottom of the sampling section was uneven, the texture of the water surface was distinct as a natural tracer point for the flow field calculation by the Large Scale Particle Image Velocimetry (LSPIV).45
_and_bamao.png)
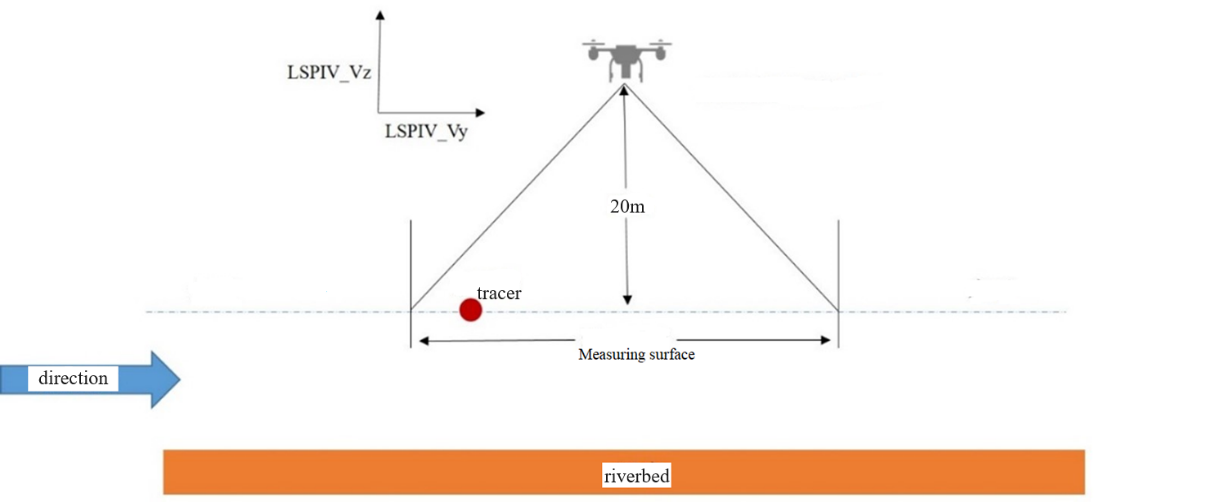
In this study, the UAV image velocimetry method was adopted,46 which mainly includes the orthophoto image generation method and the flow field calculation method based on the orthophoto image, in which the quality and accuracy of the orthophoto image directly determine whether the final flow field can reflect the authentic surface water flow characteristics, which is mainly categorized into the UAV cruise type and the hovering flight mode, etc. The UAV image velocimetry method is used in this study. Since the sampling section of this study is relatively short (<100m), the hovering flight mode is selected for measurement.47
The specific operation process is that the UAV hovers at a fixed point directly above the measurement test section, the hovering height is 20 meters, and the gimbal angle is 90° camera shooting vertically downward (Figure 3). The acquisition frequency is set to 10fps, which ensures that the particle images in the experiment are distinct, thus meeting the experimental requirements for measuring the flow field on the surface below the dam. The acquisition time of the under-dam surface flow field measurement system is set to 100s, at which time 1000 computed images are acquired. The collected image data were processed and analyzed using PhotoScan.48

2.3. Test of substrate
Three sections in Erlongqiangbao were named E1, E2, and E3, corresponding to the lower, middle, and upper reaches, and the three sections in Bamaoba were named G1, G2, and G3, corresponding to the upper, middle, and lower reaches. Then, according to the direction of water flow, divide the left and right banks, corresponding to the left and right points. Finally, the work was carried out using a bottom sampler with an opening of 30*30cm and a depth of 10cm, bagged and numbered, and brought back to the laboratory for measurement (Figure 4).
_and_ba.png)
Subsequently, Air-dry the samples and measure the particle size with a sieve (the pore sizes are 50 mm, 25 mm, 13 mm, 6 mm, 3 mm, and 1 mm ). Then, using the SY/T5163-2010 X-ray Diffraction Analysis Method of Clay Minerals and Unusual Clay Minerals in Sedimentary Rocks, the whole rock was analyzed and tested by a Bruker D8 advance X-ray diffractometer (Bruker, Germany).
3. Results
3.1 surface flow field
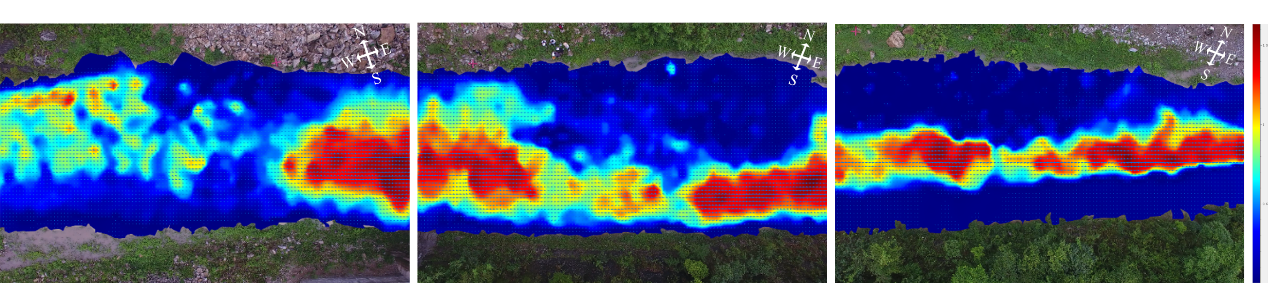
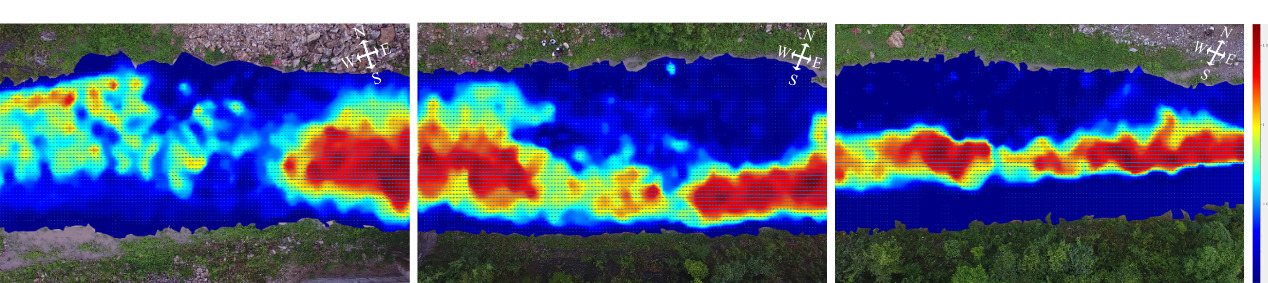
The direction of the Erlongqiangbao is from southeast to northwest and then from southwest to northeast after crossing the bridge.49 Therefore, divide the left and right banks according to the direction of the river, and the upstream and downstream are divided by the Erlongqiangbao Bridge. Moreover, sum up the following conclusions from the flow field diagram of the Erlongqiangbao (Figure 5), the overall flow velocity in the upstream section was slow, the maximum flow velocity in this part was 2.484m/s, and the change of flow velocity in the left bank was more complex than that in the right bank; the flow velocity in the center area of the downstream section was fast, the maximum flow velocity in this part was 3.374m/s. According to the field observation and video data, the flow velocity of the upstream is moderate to fast, but there is indistinct splash on the water surface; the flow velocity of the downstream is relatively rapid, there is distinct splash on the water surface, the water flow is comparatively turbulent, the change of flow velocity in the right bank is more complex than that in the left bank, and the peak of flow velocity in the center of the river channel appears several times, showing the point-like shape.
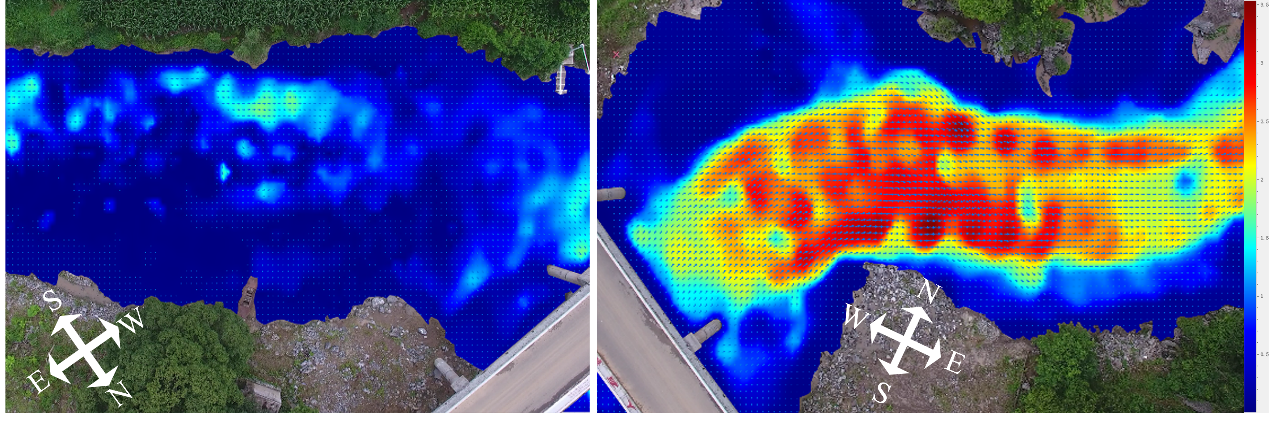
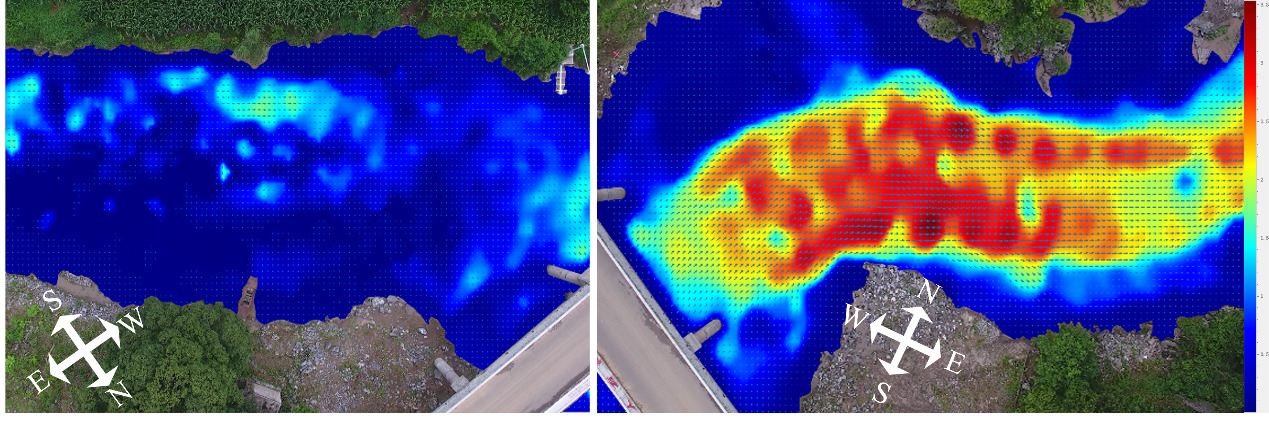
The flow direction of Bamaba is from northeast to southwest, and as shown in the figure, the flow field is divided into upstream, midstream, and downstream, with a maximum flow velocity of 1.537 m/s in the upstream, 1.349 m/s in the midstream and 1.349 m/s in the downstream (Figure 6). Notably, the flow velocities in the three sections did not differ much; however, the area and number of peak flow velocities in each section were significantly different. The upstream of the Bamaoba is characterized by high velocity in the middle and low speed on both sides, and the high speed is in the form of a thin strip; the speed of the right bank in the middle reaches is markedly inferior to to that of the left bank, and the initial velocity of the downstream is higher and gradually decreases, and finally, the speed of the right bank is higher than that of the left bank.
3.2. Particle size and mineral composition of the substrate
Three sections, E1, E2, and E3, were deployed in Erlongqiangbao (Figure 7). First, the content ratio of particle size of 25-50mm was the largest, accounting for 32.07%, followed by the content ratio of particle size greater than 50mm, accounting for 17.05%, indicating that the substrate specification of E1 was relatively large and dominated by the lumpy substrate. Secondly, the content ratio of particle size of 25mm-50mm was also the highest, but its ratio was lower than that of E1, accounting for 27. 15%; in addition, the content ratio of particle size of 13-25mm increased to 22.66% in E2. Thirdly, the content ratio of particle size less than 1mm is as high as 42.09%, and the particle size of 1-3mm is 23.60%, which is dominated by the fine substrate; the content ratio of 25mm is 22.66%, which is dominated by fine sand and gravel in E3.
Three sections, G1, G2, and G3, were deployed in Bamaoba (Figure 7). First, the content ratio of particle size of 50mm or more was the largest, accounting for 22.10%, followed by the content ratio of greater than 50mm, accounting for 21.35%, indicating that G1 was dominated by the lumpy substrate. Secondly, the content ratio of particle size 25mm-50mm is the largest, accounting for 21.50%; the content ratio of particle size 13-25mm increases to 15.35% in G2. Thirdly, the content ratios of particle sizes 25-50mm and 13-25mm were 34.03% and 21.05%, respectively, with a total share of more than half in G3.

Three major groups of minerals were tested, including ten kinds of minerals consisting of oxide, hydroxide, oxysalt, and clay minerals (Table 1). The mineral composition of Erlongqiangbao and Bamaoba are slightly different, such as siderite is only present in sampling sections E1 and E2; pyroxene is only present in sampling section E2; anatase is only present in sampling sections E2 and E3; besides, the rest of the minerals are common to the six sampling sections of the two sampling sites. On the other hand, the mineral contents of Erlongqiangbao and Bamaoba are significantly different, even if the contents are slightly different in different areas of the same river section. In Erlongqiaobao, the three sampling sections all contain large amounts of quartz, plagioclase feldspar, calcite, and clay minerals, with a total of the four minerals accounting for more than 80% of the total. At the same time, E2 lacks rhodochrosite and common pyroxene, and E3 lacks common pyroxene and anatase. At Bamaoba, all three sampling sections contain large amounts of quartz, calcite, dolomite and clay minerals, with a combined percentage of more than 80%; G1 and G2 have the highest proportion of quartz, 36% and 28.2%, respectively, and the second highest proportion of calcite, 23.9% and 25.3% respectively; in G3, the highest proportion of calcite is 34.4%, and the proportion of quartz is 24.4% lower than G1 and G2.
The principal component analysis of the mineral components of the six sections (Table 2) extracted one principal component with a contribution of 83.91%. According to the principal component coefficients to get the linear combination of Y1 (principal component equation):
Y1=0.43×X1+0.424×X2+0.414×X3+0.403×X4+0.391×X5+0.386×X6
The principal component scores were calculated based on the principal component equations, and the composite scores were calculated based on the ratio of the variance contribution of the principal components to the total variance contribution of the principal components (Table 3). Therefore, for the two scores, the two minerals, quartz and plagioclase feldspar, scored much more than the other minerals and ranked first and second.
4. Discussion
4.1. Surface flow field
Fish spawn only when they have accumulated enough energy, had mature gonads, and receive external stimuli (e.g., water flow, temperature, etc.). The condition of the riverbed and channel will directly affect the hatching of fish eggs.50 However, from the hydraulics point of view, there is a significant correlation between the flow conditions and the riverbed substrate because under the cyclic action of water flow, the river will form a diversified geomorphic pattern, such as different riverbed substrate and gradation structure, and the riverbed substrate also determines the flow field conditions of the water flow.51 The two spawning sites in this study have large differences in maximum flow velocity because of the different geographic locations. Erlongqiangbao is in the mainstem of the Chishui River, and Bamaoba is a tributary, so the hydrological conditions of the two sites are different.52 From the surface flow field of Erlongqiangbao, the flow rate increases steeply after water flow passes through E2, probably because of the large proportion of massive minerals with large particle sizes in the substrate. The proportion of substrate with particle size <1mm reaches 42.09% in E3, but the proportion decreases to about 8.6% in E1 and E2, and the change of the riverbed smoothness makes the flow rate change. Yuan found that the radius of substrate particles coarsened toward the shore, the water body can change the substrate conditions,53 the size of substrate particles adapted to the intensity of hydrodynamic forces and changed with the water flow during the investigation and evaluation of the substrate and hydrological conditions in Weihai Bay.54,55
The surface flow fields at the two locations show that the flow rates are different on the two banks, both fast on the left bank and slow on the right bank because the direction of flow of the river is influenced by the force of geocentric bias, which is to the right in the northern hemisphere and the left in the southern hemisphere.56 The study area is located in the northern hemisphere, so the river is deflected to the right bank. Hence, the right bank is more susceptible to erosion by the flowing water than the left bank, and the left bank is subject to sedimentation, which results in a difference in the flow rate.57 However, at the end of the Bamaoba reach, the flow rate of the right bank is faster than that of the left bank from the flow field of the surface, which is due to the sinuous and undulating channel of the Chishui River, which has a large number of concave and convex banks. Here, the right bank belongs to the concave bank. In contrast, the left bank belongs to the convex bank , and the velocity of water flow on the concave bank increases, intensifying the river channel’s scouring. Correspondingly, the velocity of water flow on the convex bank slows down. Sediments are deposed in this area so that the original “U”-shaped channel becomes a channel slanting to one side. The results of particle size of the Bamaoba substrate also show that the proportion of particle size less than 13 mm is more than 46% in G1, which is higher than 36.43% in G3, and the total amount of clay minerals also increases from G1 to G3. This point verifies both the results of sediment deposition due to flow velocity differences and geotropic bias forces.
4.2. Substrate
The mineral composition is interconnected with the biology of the habitats in which it occurs.58 Minerals are not only reservoirs of nutrients, which are highly heterogeneous but also participate in various natural cycles on Earth, with interactions prevalent in terrestrial soils and aquatic environments.59 For example, minerals are involved in the evolution of microbial life, and there are significant differences in the mineral composition of soils under different vegetation.60,61 In this study, quartz, calcite, and clay minerals are the main components. Still, quartz and plagioclase feldspar get the highest scores, both exceeding 1, which indicates that they play a dominant role in the mineral composition. Quartz and plagioclase feldspar play a significant role in the mineral composition of the substrate in the riverbed of the two spawning grounds.29 Therefore, emphasizing the proportion of quartz and plagioclase in the substrate can positively affect the restoration of the spawning grounds.55,62,63
The mineral composition is closely linked to the biology of the habitats in which it occurs because minerals are reservoirs of nutrients, are highly heterogeneous, and are involved in various natural cycles on Earth. Interactions are prevalent in terrestrial soils and aquatic environments, such as the involvement of minerals in the evolution of microbial life. The mineral composition of soils differs markedly from one vegetation to the other. Quartz, calcite, and clay minerals were the dominant components in the six sampled sections. Still, quartz and plagioclase feldspar had the highest scores, both exceeding 1, suggesting that they play a dominant role in the mineral composition. Quartz is one of the most widely distributed minerals on the earth’s surface, and plagioclase is also widely distributed in various rock formations (magmatic, metamorphic, and sedimentary clastic rocks). Plagioclase also contains many metal elements, such as Ti4+, Fe3+, Fe2+, Mn2+, Mg2+, Sr2+, etc. These metal ions can be easily released, while other metal ions (non-incorporated) can displace Ca2+ in the structure, resulting in the release of Ca2+, which indicates that plagioclase may be the main source of Ca2+ and other metal ions in the waters of the basin.
5. Conclusion
In conclusion, the geostrophic bias force and substrate influence the surface flow field distribution of the S. grahami spawning ground in the source section of the Chishui River. Quartz and anorthose play a significant role in the mineral composition of the two spawning grounds. Therefore, it is proposed that the proportion of quartz and anorthose in the mineral composition of the substrate be paid attention to when restoring the spawning grounds of S. grahami in the future.
ETHICAL CONDUCT APPROVAL - IACUC
The study adheres to the Convention on Biological Diversity and the Convention on Trade in Endangered Species of Wild Fauna and Flora and is committed to the ethical guidelines provided by the author’s institution and national or international regulations.
Acknowledgments
The authors thank the Chongqing Institute of Geology and Mineral Resources for the technical support.
Author contribution statement
Conceptualization: T He, J Liu, L Xu. Sampling: L Xu, Y Zhou, W Cui, Q Lu. Data analysis: L Xu, Y Zhou. Data collection and processing: C Duan.
L Xu, Y Zhou prepared figures and tables. L Xu, T He, and J Liu conducted the research, interpreted the data, and wrote. T He and J Liu supervised.
Funding
This research was sponsored by the Biodiversity Survey in the Yunnan Management and Conservation Bureau of the National Nature Reserve of Rare and Endemic Fishes in the Upper Reaches of the Yangtze River (No. 2023001017).
Declaration of Competing Interest
The authors declare that they have no known competing financial interests or personal relationships that could have appeared to influence the work reported in this paper.
Data Availability Statement
The present study’s data are available from the authors upon reasonable request.
Conflicts of Interest Statement
The authors declare no conflict of interest.