
Introduction
Moolgarda cunnesius (Valenciennes, 1836) is a member of the family Mugilidae, order Mugiliformes.1 This species inhabits marine, freshwater, and brackish water and is a commercial species in Thua Thien Hue, Vietnam. Most recently, the distribution of this species has been discovered at from Yerae-dong, Seogwipo-si, Jeju-do Island, Korea.2 In Vietnam, researchers have reported that this species lives in the Cua Be river and primarily feeds on floating plants and animals.3 It has also been found in O Loan lagoon, Phu Yen province.4 In Thua Thien Hue, the total production of longarm mullet was 160.42 tons in 2021.5 Nguyen and Nguyen6 documented 18 orders with 73 families, including 177 species in Thua Thien Hue, Vietnam. The Mugilidae family includes five species: Mugil cephalus (Lin., 1758), Valamugil cunnesius (Val., 1836), Moolgarda pedaraki (Val., 1836), Liza melinoptera (Val., 1836), and Chelon haematocheilus (Temm. & Schlegel, 1845).
Nevertheless, while studies on M. cunnesius have focused on reporting the occurrence of the species, data on the morphological characteristics and genetic diversity of this species in Tam Giang lagoon is limited. Therefore, the documentation of morphological and molecular analyses of M. cunnesius is essential for accurate identification. According to Hebert et al.7, DNA barcoding based on the use of gene sequences in the mitochondrial DNA cytochrome c oxidase 1 (COI) can serve as a universal bioidentification system for creatures. Species recognition is effectively carried out through COI analysis.7 Genetic Identification and Population Structure of Juvenile Mullet (Mugilidae) Collected for Aquaculture in East Africa by Bayesian analysis.8 Additionally, the use of DNA barcodes to identify species is becoming increasingly prevalent in ecological and evolutionary studies, serving as a vital tool for quantifying species diversity.9 Durand and Borsa10 used COI barcoding to specify species in the Mugilidae family and determine molecular detection for 24 species and 25 cryptic creatures. Chew et al.11 suggested that integrating both morphological identification and molecular assessment is crucial for accurate identification. However, there have been few studies on the morphology and genetic polymorphism of M. cunnesius in Thua Thien Hue province, Vietnam. The present study provides data on biological characteristics of M. cunnesius. This information will serve as a scientific basis for future studies, breeding, farming, and conservation of this species.
Materials and Methods
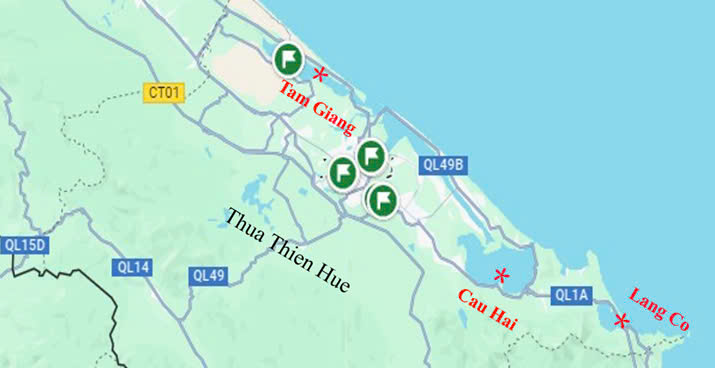
Sample Collection and Processing Methods: Moolgarda cunnesius fish samples were randomly sampled from January 2022 - October 2022 in Tam Giang lagoon, Thua Thien Hue province periodically twice a month. Additionally, information was gathered from fishermen and small fish sellers regarding fishing location, time, method, conditions, and the fishermen involved. After being collected from the field, the specimens were processed, shaped, and photographed.

Collection and Preservation Method for Total DNA Extraction: Fish fins were cut to a length of about 1 cm from the body, and about 1 cm³ of meat was taken from the fish’s back area. The sample was washed with sterile distilled water, then placed in a sample washing device and stored at -80°C.
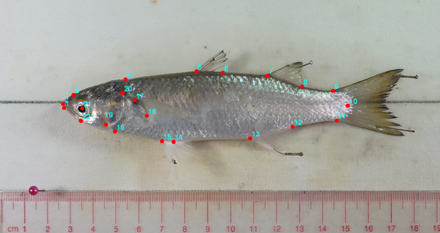
Studying Morphological Characteristics: Research on the morphological characteristics of M. cunnesius (Valenciennes, 1836) was conducted according to Pravidin (1973) and Nguyen Van Hao.12 Morphological criteria were analyzed on fresh fish samples using a geometric approach based on the measurement method of Rainboth.13 Captured fish sample images were used to measure morphological criteria, determining similarities and dissimilarities on the right and left sides of the fish to mark landmarks using tpsDig264 software. Principal component analysis (PCA) based on landmarks digitized using MorphoJ software determined the composition and role of landmarks in determining the variation of fish shape.
Nutritional Spectrum: Food was separated from the digestive tract and observed under an optical microscope to accurately identify each type of food present in the specimen’s digestive tract based on the classification system of Betancur et al.14 The nutritional spectrum of the specimen was then determined by combining the occurrence frequencies and the mass method described by Biswas.15 Calculating Frequency of Occurrence: Step 1: All foods observed from the specimen were listed. Then, the food composition in each digestive tube was observed and recorded. Step 2: Calculate the % appearance of each type of food. T = 100, where T is the social asset of food type a (%). For the remaining foods, the calculation is similar. Analyzing Natural Food Ingredients of Fish: Surgery was conducted to analyze the food composition in the stomach. A dissecting microscope was used to analyze the food composition of each fish sample. Then, classification documents were used to identify food ingredients to the industry level.
DNA Extraction: Tissue samples were homogenized at room temperature in 2 ml of buffer. DNA extraction and purification were performed using a kit (QUIAGEN) following the manufacturer’s protocol. The DNA was then dried at room temperature.
COI Gene Amplification Method Using PCR Technique: PCR reaction ingredients included: 7.5 µl Go Taq® Green Master Mix 2X, 0.75 µl Primer F1 (10 pmol/µl), 0.75 µl Primer R1 (10 pmol/µl), 1.5 µl total DNA, and 4.5 µl of kit’s distilled water (DW). The PCR reaction was performed in a thermal cycler (iCycler, Bio-Rad) according to the following cycle: DNA denaturation: 94°C for 5 minutes; Amplification: 35 cycles of (94°C for 1 min; 54°C for 30s; 72°C for 45s); final extension at 72°C for 5 min. PCR products were electrophoresed on 1.5% agarose gel to check before sequencing.
Gene Sequencing: The purified product was DNA sequenced by the Sanger method based on dideoxy sequencing at Firsbase company, Malaysia. COI gene segment sequences were analyzed and verified using the BLAST program. Sequences were edited and multiplexed using BioEdit software.
Nucleotide sequence analysis: after purification using the MEGAquick-spinTM Plus Total Fragment DNA Purification Kit, followed the manufacturer’s instructions. The presence of target genes was confirmed using the Sanger sequencing method. Results processed with Bioedit software were blasted against sequences on Genbank to compare and confirm the research sequences.
Data Processing Methods: Similar landmarks were selected and digitized using tpsUtil64 and tpsDig264 software. Collected data were processed using Excel 2016 and MorphoJ 1.07 software. Sequence data were edited using BioEdit software. Research sequences were compared with homologous sequences on GenBank using the BLAST program. Homologous sequences were aligned using the Clustal W program. A phylogenetic tree was constructed using the Maximum Likelihood Test method with MEGAX software, with the bootstrap value repeated 1000 times for the sample.
Results
Morphology of Moolgarda cunnesius
Moolgarda cunnesius is a species of the Muglidae family, commonly known as Leaf Mullet, and widely distributed in brackish waters and coastal waters. Leaf mullet has a long body, flat head, and is covered with scales. The mouth is blunt, and the snout is arc-shaped. The eye diameter is equal to the snout length. The first dorsal fin has 4 hard spines, the second dorsal fin is smaller than the first dorsal fin and has its origin after the anal fin. The pectoral fin is as long as the length of the head. The anal and pelvic fins are small, and the anus is close to the anal fin. The caudal fin is shallowly lobed, with two equal lobes.16 The second dorsal fin and anal fin have few scales, only on the anterior and basal parts. M. cunnesius has 62 to 75 gill rakers on the lower limb of the first gill arch; the upper jaw is slightly curved downward, and the anterior edge of the anterior alveolus is slightly concave. On the longitudinal stripe running along the body, there are a number of scales from 37 to 43. The dorsal surface is green, the flanks and abdomen are iridescent silver, and the fins are slightly dull.
.png)
Counting Indicators of Mullet in the study areas
The number of spines on the first dorsal fin of M. cunnesius fish at all research locations is 4 spines, and there are no rays on the first dorsal fin. The second dorsal fin has 1 - 2 spines and 7 - 8 rays. In the pectoral fin, the number of spines of fish in all areas is 1, but there are differences in the number of rays: 12 - 15 rays for samples collected in Tam Giang, 12 - 14 rays for samples collected in Cau Hai, and 13 - 15 rays for samples collected in Lang Co. The pelvic fin has only 1 spine and 5-6 rays. In the caudal fin, there are no spines and 14 - 17 rays. Fish samples in the research areas all have 2 spines in the pelvic fin; however, the number of rays in the anal fin is different: Tam Giang has 9 - 10 rays, but in Cau Hai and Lang Co there are 10 rays.
Biometric indicators of Mullet fish in the study areas
When comparing some indicators with standard length, the statistical level p = 0.05 shows that the head length of fish in Tam Giang (23.8%) is different from Cau Hai (24.1%) and Lang Co (24.7%). Body height at the base of the first dorsal fin in fish samples from Cau Hai (23.3%) was similar to mackerel samples in the other two areas, while between Tam Giang (23.5%) and Lang Co (22.8%) there were discrepancies. The index of first dorsal fin length and snout length also showed similar discrepancies. Fish samples from Tam Giang (22.5%) and Cau Hai (22.6%) had similarities in body height at the base of the pelvic fins, but there were differences in Lang Co (21.9%). The difference results are similar for the second dorsal fin width criterion and anal fin width. For pelvic fin length, fish samples in Cau Hai (14.8%) and Lang Co (15.6%) were similar, and there were differences in Tam Giang (14.7%); similar results were found for the length of the head behind the eyes. The index of first dorsal fin width showed the most obvious difference between the three study areas, with Tam Giang (10.6%), Cau Hai (9.8%) and Lang Co (11.4%).
Compare some criteria with standard length using Excel 2016 with statistical level p = 0.05, it shows that head height has a difference between samples in Tam Giang (20.1%) and Lang Co (19.9%), but all have similarities with Cau Hai (20.4%). The distance between the eyes also gave similar results. Meanwhile, the mouth width of fish samples in Lang Co (10.8%) was different from the other two areas.
In general, most of the comparative indicators of M. cunnesius (Valenciennes, 1836) between the three areas show that the longarm mullet in Lang Co area is different from Tam Giang and similar to Cau Hai. The mullet fish samples are similar between Tam Giang and Cau Hai areas. Geographical factors also play a role in these differences because Lang Co lagoon is a closed lagoon, clearly separated from the Tam Giang - Cau Hai lagoon system, while Tam Giang lagoon and Cau Hai lagoon form a continuous lagoon system that interacts with each other. The results of differences in the above indicators of mullet fish between three research areas in Thua Thien Hue are only initial data, so far there is not enough scientific basis to explain them. During the research process, it was found that the differences were due to many causes such as the age of fish, geographical characteristics, ecological characteristics, and nutritional regime of fish in the three areas being different.17
Currently, the geometric unit approach is one of the methods used to determine the morphological characteristics of fish. Using MorphoJ software, principal component analysis was applied to the CovMatrix landmark data set based on 120 male and female fish samples. Through Procrustes coordinates, a total of 40 principal components were created, accounting for 100% of the variation in the sample. Of these, the first principal component accounted for 19.962% of the variation and was selected to conduct multivariate analysis.
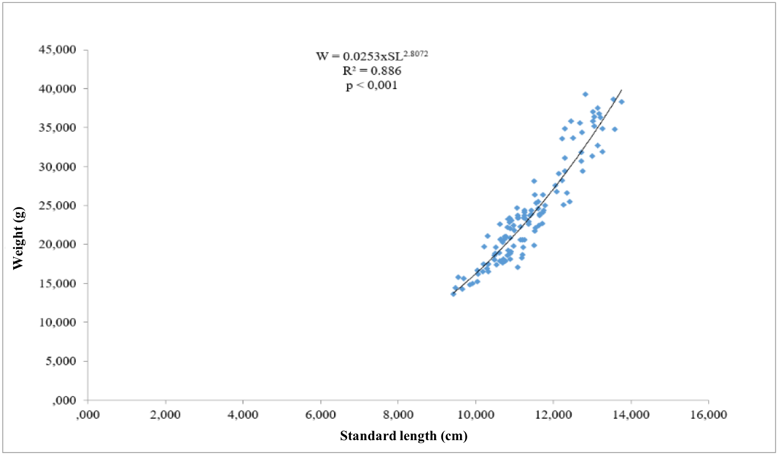
Relationship between length and weight of longarm mullet
The graph and non-linear equation between standard length (SL) and body mass (W) of mullet show a positive relationship, indicating that as the standard length increases, the body mass also increases. This is supported by the R coefficients, which are all greater than 0, and the non-linear lines which slope upwards. For the leaf mullet distributed in the research areas of Thua Thien Hue, the specific non-linear equation describing this relationship is: W=0.0253×SL2.8072 with a coefficient of determination R2 = 0.886. This high R2 value suggests that the model fits the data well, and there is a very close relationship between the standard length and body mass of the leaf mullet in these areas.

Nutritional biological characteristics of M. cunnesius
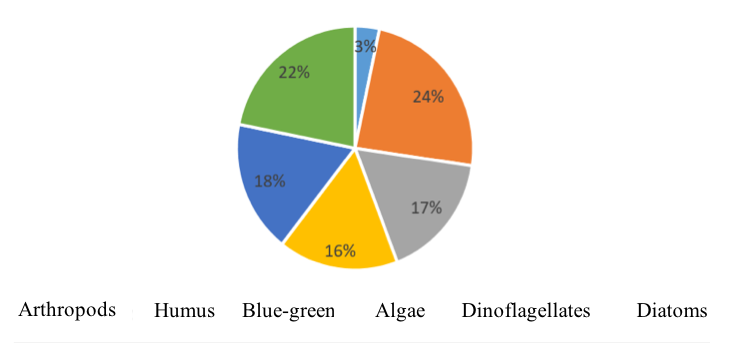
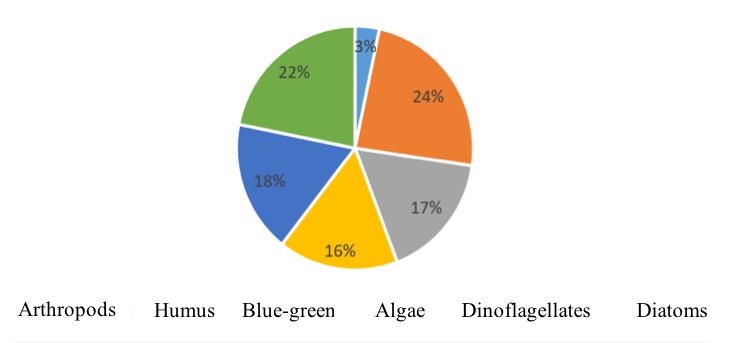
The food composition of M. cunnesius fish includes a variety of zooplankton (such as Protozoa, Rotifera, etc.), phytoplankton (such as green algae, euglenoids, diatoms, etc.), benthic animals, and organic detritus. Among these, organic humus and phytoplankton are the most favored foods of M. cunnesius fish (Table 3).
Analytical results indicate that organic humus has the highest occurrence, followed by dinoflagellates, blue-green algae, diatoms, and the lowest is arthropods. This diverse food composition illustrates that M. cunnesius is an omnivorous species. Specifically, organic humus constitutes the highest proportion of their diet at 24%, followed by diatoms at 22%, dinoflagellates at 18%, blue-green algae at 17%, and green algae at 16%. Additionally, they also consume a small amount of arthropods, making up 3% of their diet (Fig. 4).
Assessing Genetic Diversity
Sampling results
Based on taxonomic documents and morphological analysis, it was determined that the fish samples under study were indeed the species M. cunnesius (Valenciennes, 1836). Muscle samples were then separated from 24 fish specimens to extract total DNA and perform PCR reactions to check before sending samples for COI gene sequencing (Table 4).
Results of total DNA extraction and PCR reaction
Total DNA was extracted, and most samples showed faint quality. The electrophoresis process on a 0.8% gel revealed a pale band, indicating that the DNA content was low and somewhat degraded (Fig. 5A). However, when amplifying 20 total DNA samples by PCR with the specific primer pair Fish R1 and Fish R1 on a 1.4% agarose gel, the results were clearer. A specific DNA segment of 680–700 bp was amplified (Fig. 5B). The size of PCR products from the 20 samples across the three regions matched the target COI gene segment size.
_and_pcr_product_electrophoresis_(b)_of_*moolgarda_cunn.png)
Results of COI gene sequence analysis
Genetic diversity analysis revealed that all COI mitochondrial DNA gene sequences from the 20 samples matched the corresponding COI gene sequences on Genbank, with a similarity level of over 99.5% (Table 5). The COI gene fragment obtained was 697 bp long.
Comparing the 20 COI gene segments analyzed from mullet samples in Thua Thien Hue, Vietnam, with the reference sequence MW336954.1 on Genbank, showed differences at 12 positions (144, 225, 261, 270, 339, 420, 429, 444, 471, 630, 657, 675). Among these, 10/20 COI gene segments showed no differences, 8/20 segments had differences at only one nucleotide, and 2/20 segments showed differences at two nucleotides
(Table 6). Therefore, the similarity between the research sample and the MW336954.1 sequence is very high. The genetic distance and similarity coefficient of M. cunnesius fish between the three study areas, calculated according to the Kimura 2-parameter ratio, is low (Table 7).
Genetic relationships of M. cunnesius between study areas
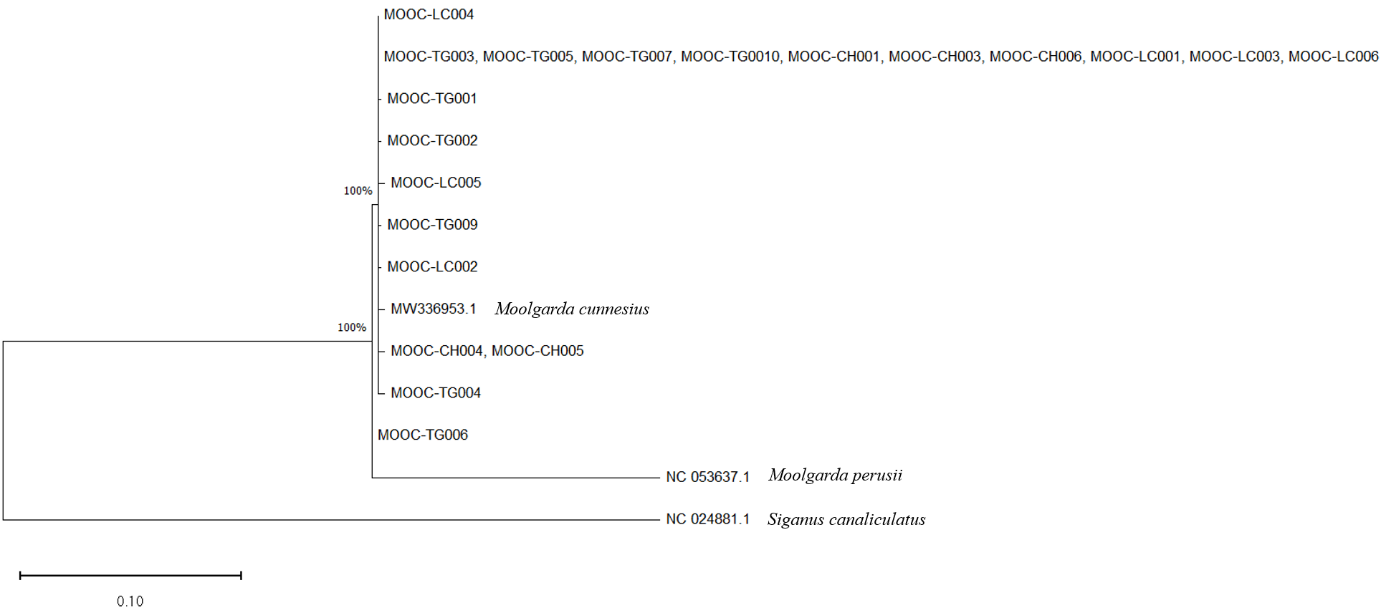
The phylogenetic tree of 20 mullet samples, constructed with COI gene region sequences of one species of the same genus Mugil Linnaeus and one species of the genus Siganus, showed that all studied fish samples clustered within the same branch as M. cunnesius with a bootstrap value of 100%. Analysis of the COI gene sequence and genetic tree indicated that the mullet populations are genetically diverse (Hd = 0.711), with a high level of similarity, suggesting regional genetic diversity.
The COI gene sequence exhibited few mutations, and PCR analysis to amplify the COI gene showed no significant errors during the pairing process, with highly specific primers. However, differences in nucleotide sequences in the analyzed gene segments led to variations in the morphological criteria, as previously analyzed. This result aligns with research by Dang Duc Tue18 on the same species in the Thua Thien Hue area. Therefore, when studying a fish species with high external morphological similarity to another species, gene sequencing (such as COI or other mitochondrial genes) is essential for accurate identification.
_with_a_species_of_th.png)
Discussion
Moolgarda cunnesius distributed at the research sites all have 4 spines and no rays in dorsal fin 1. Dorsal fin 2 has 1 - 2 spines, 7 - 8 rays. The number of pectoral fins and spines of fish in each area is 1 but there are differences in the number of rays, 12 - 15 rays for samples collected in Tam Giang, 12 - 14 rays for samples collected in Cau Hai, 13 – 15 rays for samples collected in Lang Co. The pelvic fin has only 1 spine and 5-6 rays. In the caudal fin, there are no spines and 14 - 17 rays. Fish samples in the research areas all have 2 spines in the pelvic fin, however the number of rays in the anal fin is different; Tam Giang has 9 - 10 rays but in Cau Hai and Lang Co there are 10 rays. In terms of nutritional characteristics, the food of this species is similar to that of species distributed in South Africa including plant debris and small benthic organisms, including Assiminea, copepods, nematodes and ostracods also formed part of their diet.19
The sequence of the COI gene segment of the M. cunnesius sample is 697 bp in size. The average ratio of four types of nucleotides is A: 23.24 %; T: 32.22 %; G: 18.22 %; C: 26.32 %. In 20 COI gene segments, the results obtained had differences at 13 nucleotide positions and these sequences were also different at some positions, ranging from 1-2 nucleotides. Each gene sequence contained 232 amino acids, including 18 different types. Some amino acids had high average percentages, such as Leucine (15.09%), Glycine (9.05%), and Isoleucine (8.19%). The average ratio of the four types of nucleotides was A: 23.24%, T: 32.22%, G: 18.22%, C: 26.32%, similar to research results on 143 species of bony fish in Australia.20 However, Molecular analysis of M. cunnesius in Korea, specifically comparison of the 623 base pairs of mitochondrial DNA COI sequences.2
The results of building a phylogenetic tree of 20 M. cunnesius fish samples with sequences of the COI gene region of 1 species of the genus Mugil Linnaeus and 1 species of the genus Siganus show that all fish samples are in the same branch as M. cunnesius species with reasonable prices. bootstrap value 100%. However, the genetic distance is far apart and the distance also varies between research samples. According to Dang Duc Tue et al.,16 the standard deviation at Tam Giang lagoon and Thua Thien Hue sea coast were 0.756±0.01678 and 0.833±0.01600, respectively. Meanwhile, the mean nucleotide diversity (π) and standard deviation were 0.00265±0.00100 (Tam Giang lagoon).
Research results on the biological characteristics of this species in Thua Thien Hue are the scientific basis for accurate identification and classification of the species. From there, rationally exploit and protect resources. Moreover, conduct breeding to provide this valuable food for local people in particular and in Vietnam in general as well as export to other countries in the world.
Funding
This work was supported by Hue University under the Core Research Program, Grant No. NCM.DHH.2022.07.
Authors’ Contribution
Conceptualization: Nguyen Thi Hao (Equal), Nguyen Hoang Nhat Minh (Equal), Truong Cong Hoi (Equal), Bui Anh Phong (Equal), Nguyen Ty (Equal), Pham Thanh (Equal), Nguyen Xuan Huy (Equal), Tran Van Giang (Equal). Data curation: Nguyen Thi Hao (Equal), Nguyen Hoang Nhat Minh (Equal), Truong Cong Hoi (Equal), Bui Anh Phong (Equal), Nguyen Ty (Equal), Pham Thanh (Equal), Nguyen Xuan Huy (Equal), Tran Van Giang (Equal). Investigation: Nguyen Thi Hao (Equal), Nguyen Hoang Nhat Minh (Equal), Truong Cong Hoi (Equal), Bui Anh Phong (Equal), Nguyen Ty (Equal), Pham Thanh (Equal), Nguyen Xuan Huy (Equal), Tran Van Giang (Equal).
Competing of Interest – COPE
No competing interests were disclosed
Ethical Conduct Approval – IACUC
The collect mullet collection and experimental protocols followed the guideline from the Animal ethics committee of Hue Univerversity (https://huaf.edu.vn/animalethics/).
Informed Consent Statement
All authors and institutions have confirmed this manuscript for publication.
Data Availability Statement
All are available upon reasonable request.