


Introduction
The feeding rate affects aquatic animals’ growth performance and feed efficiency, which are related to the benefits of aquaculture.1 Research on feeding rates in Litopenaeus vannamei,2–4 Penaeus monodon5 and Penaeus semisulcatus6 have shown that the optimal feeding rate of shrimp was between 6% and 8%, and could reduce feed wastage and aquaculture costs. Inadequate feeding rate could lead to slow fish growth, while excessive feeding rate could decrease feed conversion efficiency and gastrointestinal overload.7 Therefore, determining the optimal feeding rate is crucial for aquaculture practitioners. The amylase activity during the growth of the zoea larvae of Scylla paramamosain was closely related to the feeding rate,8 and the effect of feeding rate on intestinal flora has not been reported.
The red swamp crayfish (Procambarus clarkii) is documented for its rapid growth, high-quality meat, and rich protein and fatty acid content,9 making it an important aquaculture species. However, traditional feeding strategies in crayfish aquaculture often result in challenges such as extensive farming practices, low feed efficiency, and high production costs.
Research on P.clarkii focuses predominantly on its intestinal flora10 and disease resistance,11 with a limited exploration into its optimal feeding rate. This study aims to determine the optimal feeding rate for crayfish, focusing on the effects of different feeding rates on the growth, muscle composition, intestinal digestive enzyme activity, and intestinal microbiota composition of juvenile crayfish to provide a theoretical basis for scientific breeding management of P.clarkii, and improving the breeding efficiency and sustainability of P.clarkii.
Materials and Methods
Experimental design and management
The juvenile crayfish were obtained from Gaoyou (Jiangsu, China). 240 healthy juvenile crayfish with an average body weight of (8.33±0.50) g were randomly divided into 5 groups with 3 replicates per group. The five groups corresponded to five different feeding rates of 2%, 4%, 6%, 8%, and 10% body weight per day (BW/day) and fed commercial diets (Jiangsu Hepurui Feed Co., LTD.; Q/321281 HPR 12-2021) with a crude protein level of 32%. The experimental setup consisted of 18 plastic tanks (bottom diameter 1 m, top diameter 1.3 m, height 1 m, water depth 0.9 m). Each tank contained a pot of Alternanthera philoxeroides for crayfish climbing. The crawfish were weighed every two weeks, and the feeding amount was adjusted according to the feeding rate assigned to each group. The feeding and growth experiment lasted for 6 weeks, kept in natural light.
During the experiment, crayfish were fed once daily at 17:00. A portable water quality analyzer (model HQ40D, HACH, Loveland, CO, USA) maintained dissolved oxygen levels above 5 mg/L and ammonia nitrogen levels below 0.1 mg/L. Half the water was changed weekly, residual bait was removed through the feeding platform before each feeding, and water and air temperatures were recorded daily.
At the end of the feeding trial, crayfish were fasted for 24 hours. Survival rates were recorded, crayfish were weighed after drying, and hepatopancreas weights were measured. Crayfish muscle was weighed and stored at -20°C for subsequent moisture, crude protein, crude fat, and ash content analysis. Four crayfish per tank were randomly selected, disinfected with 75% ethanol, rinsed with sterile saline, and aseptically dissected to extract intestinal tissues. Intestinal samples were flash-frozen in liquid nitrogen for microbiota analysis, while the remaining tissue was stored at -80°C for intestinal digestive enzyme activity analysis.
Abdominal muscle moisture was determined via freeze-drying (SCIENTZ-10N freeze-drying machine); crude protein via Kjeldahl nitrogen method (GB/T5009.5-2016); crude fat via Soxhlet extraction (GB/T5009.6-2016); and ash content via weighing after incineration (GB/T5009.4-2016). Fresh intestinal tissues (approximately 0.8g) were weighed, homogenized in 10 mL of deionized water, and centrifuged (3000×g, 10 min, 4°C). Supernatants were used for proteinase (Folinol reagent method), lipase (methyl halogen substrate method), and amylase (starch-iodine colorimetry) activity assays using kits from Nanjing Jiancheng Bioengineering Institute.
Intestinal contents from each group were sequenced using 16S rDNA high-throughput sequencing targeting the V3-V4 region (341F: 5’-CCTAYGGGRBGCASCAG-3’; 806R: 5’-GGACTACNNGGGTATCTAAT-3’). Shenzhen Weikemeng Technology Group Co., LTD performed sequencing. Amplicon sequence variant (ASV analysis included alpha diversity indices (ACE, Chao, Shannon, Simpson) with statistical tests using the Wilcoxon test. PCoA (Principal Coordinate Analysis) utilized ANOSIM for group differences, while LEfSe (Linear discriminant analysis Effect Size) identified significantly different species. Bioinformatics analysis was conducted using the cloud platform Micronas (https://www.bioincloud.tech). The Groups 1 to 5 represent feeding rates of 2%, 4%, 6%, 8%, and 10%, respectively.
Processing and Statistical Analysis
We calculated the Weight gain rate (WGR), Specific growth rate (SGR), Feed conversion ratio (FCR), Hepatopancreas index (HSI), Condition factor (CF), and Survival rate (SR) of the crayfish using the formula.
Weight Gain Rate (WGR) (%) = (M1 - M0) / M0× 100 %
Specific Growth Rate (SGR) (%/d) = (lnM1 - lnM0)/ (T1 - T0) × 100 %
Feed Conversion Ratio (FCR) = Mf / (M1 - M0)
Hepatosomatic Index (HSI) (%) = Mg / M1× 100%
Condition Factor (CF) (g/cm3) = M1 / Lt3×100
Survival Rate (SR) (%) = N1 / N0 × 100 %
In the formula: M1, M0 — the final average mass and initial average mass, g; Mf — Total feed intake for 42 days, g; Mj, Mg — the muscle weight and hepatopancreas weight, g; N1, N0 — the final mantissa, the initial mantissa; L1 — terminal average body length, cm; T1, T0 — Test start time, end time, d.
All data were analyzed and processed using Excel and SPSS 19.0. Excel software was initially used to organize the data and create tables for each indicator. One-way ANOVA was performed on the data using SPSS 19.0, and Tukey’s multiple comparison test analyzed differences between the groups. The significance level was determined as P<0.05. Test data are expressed as mean ± standard error (Mean ± SE).
Results
Effects of different feeding rates on growth performance of Procambarus clarkii
The final body weight (FBW), weight gain rate (WGR), and specific growth rate (SGR) initially increased as the feeding rate rose from 2% to 6% (P<0.05), followed by a decreasing trend with further increases in the feeding rate. However, the differences were not statistically significant (P>0.05). The feed conversion ratio (FCR) increased with the feeding rate, reaching a peak at the feeding rate of 10% (P<0.05). Survival rate (SR), hepatosomatic index (HSI), and condition factor (CF) were unaffected by the feeding rates (P>0.05) (Table 1).
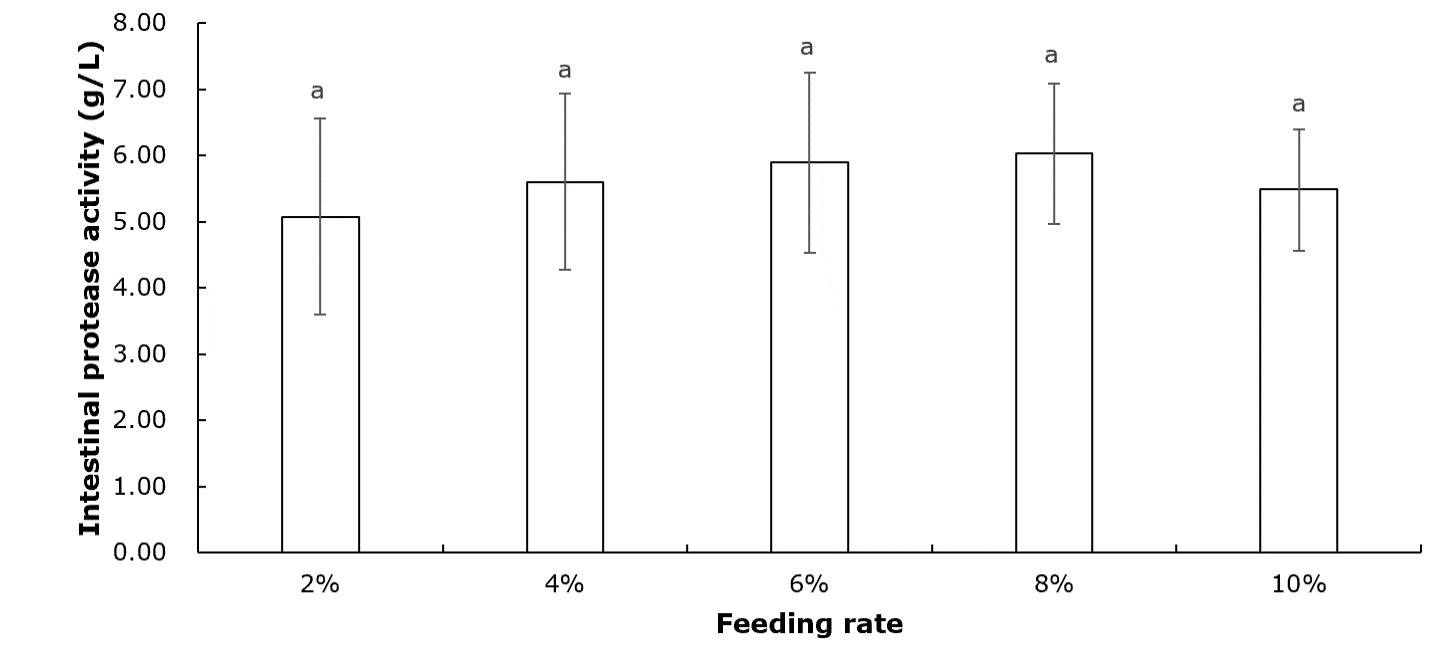
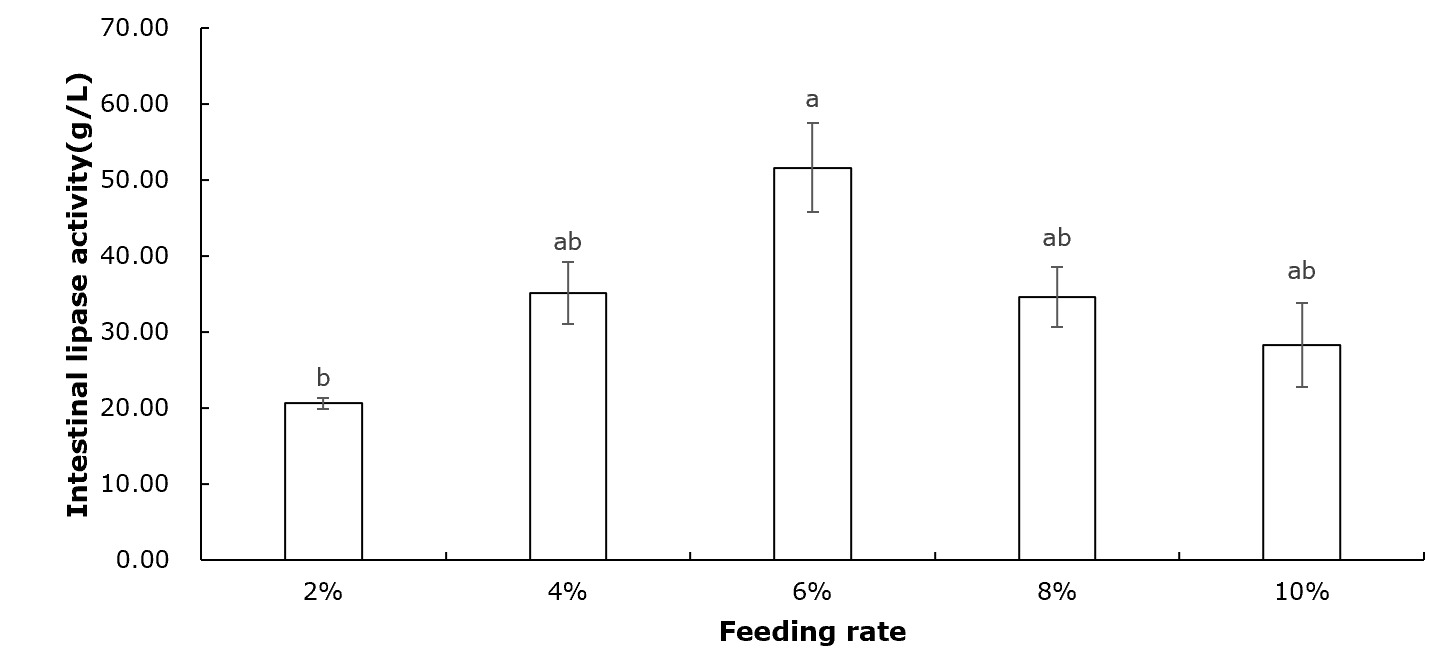
Table 2 shows that crayfish muscle’s moisture, crude protein, crude fat, and ash contents remained unchanged across all feeding rate groups (P>0.05). Figure 1 indicates that the intestinal protease concentration of crayfish remained unchanged among all feeding rate groups (P>0.05). According to Figure 2, the intestinal lipase concentration in the 6% group was significantly higher than that of the 2% group (P<0.05). No significant differences were observed among the other groups (P>0.05). Figure 3 showed that the intestinal amylase concentration of the 4% and 6% groups was significantly higher than that in the other groups (P<0.05).

Quality analysis of intestinal microorganism sequencing: 28,226 sequences were obtained through intestinal 16s rDNA sequencing analysis, yielding 163 OTUs in each group. The 2% group had 798 OTUs, the 4% group had 1,083 OTUs, the 6% group had 879 OTUs, the 8% group had 561 OTUs, and the 10% group had 1,006 OTUs (Figure 4).
Table 3 shows the alpha diversity indices of intestinal microbiota in P. clarkii. The results indicated that each sample’s library coverage was more than 99.9%. The ACE and Chao indexes of the 2% groups were significantly lower than those of the other groups. Still, there was no significant difference between the Shannon and Simpson indexes.
Composition of intestinal microbial community: At the phylum level, Tenericutes, Firmicutes, Proteobacteria, Bacteroidota, and Actinobacteria exhibited significant changes across the groups. The highest relative abundance was found in Tenericutes, followed by Firmicutes, Proteobacteria, Bacteroidota, and Actinobacteria. These five dominant phyla accounted for 90% of the intestinal microbiota, and the total abundance of the top six phyla accounted for more than 98% (Figure 5A, Figure 5B). The relative abundance of Firmicutes in the 4%, 6%, and 8% groups was significantly higher than that in the 2% and 10% groups (P<0.05), and the relative abundance of Proteobacteria in the 10% group was significantly higher than that in the other groups (P<0.05). At the genus level, the main genera with relatively high abundance were Anaerorhabdus, Citrobacter, Bacteroides, and Clostridium (Figure 5C, Figure 5D). The relative abundance of Citrobacter in the 6% group was significantly lower than in the other groups (P<0.05).


Based on the results of intestinal microbiome sequencing and COG database analysis, PICRUSt was employed to predict the functional profile of the intestinal microbial community in crayfish. The findings revealed a notable prevalence of functions such as amino acid metabolism, carbohydrate metabolism, metabolism of cofactors and vitamins, metabolism of other amino acids, global and overview maps, biosynthesis of different secondary metabolites, replication and repair, lipid metabolism, and energy metabolism within the intestinal microbiota of crayfish (Figure 6).

Discussion
Determining the optimal feeding rates for cultured species in aquaculture can significantly enhance their growth performance. A low feeding rate hinders the growth of farmed animals.12 In contrast, an excessive feeding rate can lead to water pollution, diminish farmed animals’ feeding and growth rates, and ultimately decrease breeding benefits.1 Our results showed that crayfish in the 4% and 6% feeding rate groups demonstrated significantly higher weight gain compared to those in the 2% group, aligning with Han et al.'s findings that the highest weight gain and specific growth rates were observed at a 6% feeding rate.12 This indicates that different feeding rate levels significantly affect the growth of juvenile crayfish. Within a specific range of feeding rates, increasing the feeding rate can increase the intake of nutrients and promote crayfish growth. The weight gain rate of P. clarkii declined with increased feeding rates (6%–10%), diverging from Niu’s results in Penaeus monodon,5 potentially due to differences in experimental temperatures. The experiments were conducted during summer, a season that possibly exacerbates water pollution due to residual bait at high temperatures, reducing actual food intake and the weight gain rate of juvenile crayfish.
Moreover, elevated feeding rates directly compromise water quality, inhibiting young crayfish growth. The feed conversion ratio (FCR) is a crucial metric for assessing the feed utilization efficiency of aquatic animals. Lowering the FCR can reduce breeding costs and enhance economic benefits. In our experiments, an increase in feeding rates correlated with a declining bait utilization rate, consistent with observations by Han et al.12 and analogous to findings in juvenile Cyprinus carpio1 and Sebastes Schlegel.13 Although the experimental group with a low feeding rate achieved a higher feed utilization rate, it will also affect crayfish growth due to insufficient feeding. After appropriately increasing the feeding rate, the feed utilization rate of crayfish decreased, but the energy available for growth increased overall. Excessive feeding resulted in residual feed, reduced feed utilization rate, and polluted water quality, ultimately affecting crayfish’s appetite, growth, and development.
Crayfish muscle body composition is often used to evaluate muscle quality. The results of this study showed that the contents of moisture, crude protein, crude fat, and ash in the muscle of crayfish were not affected by the feeding level, which was similar to the results of Oncorhynchus mykiss and Ctenopharyngodon idella.14,15 There may be some physiological regulation mechanisms that maintain the stability of muscle composition by regulating metabolic pathways at different feeding levels, or the high-temperature environment at that time may have had a more significant effect on the physiological state of crayfish larvae, thereby masking the effect of feeding level on muscle composition. Further research is required to understand the underlying mechanisms that regulate muscle composition in crayfish about feeding rates.
Intestinal digestive enzyme activity is one indicator reflecting crayfish’s ability to digest and absorb nutrients. The changes in digestive enzyme activity during the early development of crustaceans reflect the changes in digestive ability.16 The results indicated that the intestinal amylase and lipase activities in crayfish increased significantly with the rise in feeding rate, initially peaking before declining as the feeding rate continued to increase. This is similar to the trend of digestive enzyme activity observed in the digestive enzyme activity of juvenile hybrid sturgeon with increasing feeding rates17 and also corroborates the experimental results of Wu et al.18 At low feeding rates, the proportion of feed in the ingestion composition of crayfish decreased while that of aquatic plants increased. This may lead to a decrease in the digestive enzyme activity corresponding to the digested feed, while the cellulase activity related to the digestion of aquatic plants may increase.18 Insufficient intake of nutrients may affect the development of the intestinal digestive glands of crayfish, resulting in low activity of digestive enzymes secreted. As the feeding rate increases, crayfish adapt by secreting more digestive enzymes and enhancing their enzyme activity to fully absorb nutrients from decomposed food, thereby promoting growth and development. The results of this experiment showed that the activities of the digestive enzymes of crayfish were the highest when the feeding rate was 6%, indicating that this amount of feed could better stimulate the secretion of intestinal digestive enzymes and improve enzyme activity. When the feeding rate increased to 8%-10%, the activity of intestinal digestive enzymes decreased, indicating that the corresponding digestive organs of the intestinal tract may be under load, and the secretion of digestive enzymes may be inhibited.
The structure and composition of intestinal microorganisms affect the host’s immune response, nutrient absorption, and energy balance.19 At the same time, the structure and function of the intestinal microbial community are closely related, which can indicate the host’s health status. The dynamic balance of the intestinal flora of aquatic animals is affected by many factors, including the feeding rate.20 In this study, at the phylum level, the dominant intestinal flora of the five groups were Firmicutes, Bacteroidetes, Proteobacteria, Actinobacteria, and Verrucomicrobia, which was similar to the results of Yao et al.21 on P. clarkii.
Bacteroides can be used as biomarkers to measure the intestinal health of animals and play an essential role in the degradation of dietary fiber.22 On the other hand, some Streptomyces and Actinobacteria bacteria can promote nutrient absorption and catabolism.23 Streptomyces could regulate the intestinal environment and promote the metabolic function of crayfish. Actinobacteria play a crucial role in maintaining intestinal homeostasis. The results of this experiment showed that at the phylum level,24 appropriately increasing the feeding rate can improve the relative abundance of Firmicutes and the intestinal flora homeostasis index of crayfish, while when the feeding rate reaches 10%, the relative abundance of Proteobacteria is higher than that of other groups. This may be due to oversaturated feeding leading to a severe digestive system load, resulting in damage and changes in the intestinal environment. At the genus level, the main beneficial bacteria are Bacteroides25 and Clostridium,26 and the main harmful or potentially harmful bacteria are Citrobacter.27 In this experiment, most of the intestinal flora of the two groups of crayfish were not classified, and it was found that the abundance of conditional pathogenic bacteria such as Citrobacter decreased significantly after the increase in feeding rate (6%). In contrast, the abundance of Bacteroides and Clostridium increased. This may be due to the reasonable feeding rate stabilizing the ecological balance of the intestinal flora.
Conclusion
Based on the results above, the optimal daily feeding rate for Procambarus clarkii (initial weight of 8.33 ± 0.50 g) was 6.0% of their body weight. The intestinal microbiota composition of crayfish at a 6% feeding rate was healthier.
Acknowledgments
This work was supported by the National Key Research and Development Plan project (2023YFD2402000), the National Natural Science Foundation of China (No. 32102767), the Research on Public Welfare Technology Application of Science and Technology Project of Huzhou in China (2024GZ30), the Yancheng Fishery High-Quality Development Project (2022yc003), the Jiangsu Modern Agricultural Industrial Technology System Construction Special Fund (JATS [2023] 471), the Postgraduate Research and Innovation Project of Huzhou University (2024KYCX98) and Zhejiang Provincial College Student Innovation and Entrepreneurship Training Program (S202410347060). We are also very grateful to the Lixiahe Area Agricultural Sciences Research Institute for helping us with the experiments in this study.
Authors’ Contribution
Conceptualization: Jinglong Chen (Equal), Aimin Wang (Equal), Jianhua Ming (Equal). Formal Analysis: Jinglong Chen (Equal), Jianhua Ming (Equal). Methodology: Jinglong Chen (Equal), Mingyou Li (Equal). Software: Jinglong Chen (Equal), Guangming Han (Equal). Validation: Jinglong Chen (Equal), Hongyan Tian (Equal), Bo Liu (Equal). Writing – original draft: Jinglong Chen (Lead), Jianhua Ming (Equal). Writing – review & editing: Jinglong Chen (Equal), Aimin Wang (Equal). Investigation: Jinglong Chen (Equal), Wuxiao Zhang (Equal), Silei Xia (Equal), Jian Gao (Equal), Mengyue Zhang (Equal). Resources: Aimin Wang (Equal), Jianhua Ming (Equal), Jiahong Zhang (Equal). Supervision: Aimin Wang (Equal), Xiangming Kou (Equal), Peng Shao (Equal), Aimin Zhu (Equal). Funding acquisition: Aimin Wang (Lead), Jianhua Ming (Lead). Project administration: Aimin Wang (Equal).
Competing of Interest – COPE
No competing interests were disclosed.
Ethical Conduct Approval – IACUC
The article adheres to the Convention on Biological Diversity and the Convention on Trade in Endangered Species of Wild Fauna and Flora Research.
Informed Consent Statement
All authors and institutions have confirmed this manuscript for publication.
Data Availability Statement
All are available upon reasonable request.