
Introduction
In recent years, with the rapid development of Internet technology and the maturity of the logistics cold chain, e-commerce platforms have become one of the important channels for consumers to shop. According to the data of the “Chinese Fresh Food E-commerce Market Data Report in 2020”, as of 2020, the transaction scale of the Chinese fresh food e-commerce market is up to more than 400 billion yuan, and the average number of active people per month is more than 40 million people. This indicates that the fresh food e-commerce market is booming, which provides a good opportunity for the rise of the online shopping industry of aquatic products.Especially during the COVID-19 epidemic, domestic quarantine measures led to a further increase in demand for fresh seafood through online channels. After the precipitation and accumulation in recent years, the overall scale of the aquatic products e-commerce market in China has exceeded 70 billion yuan.
In this context, live broadcast marketing, as a new e-commerce sales model, attracts a large number of consumers’ attention and purchase through real-time display and promotion of products by anchors. Especially in the aquatic products industry, the influence of e-commerce anchors is becoming increasingly significant, and it is quietly changing the traditional sales model.
The advantages of online purchase of aquatic products are mainly embodied in the following aspects. Firstly, consumers can obtain more product information through e-commerce platforms, including origin, breeding methods, processing technology, etc., so as to make more informed purchasing decisions.1 Second, the development of cold chain logistics technology has made the transport and preservation of aquatic products more efficient, ensuring the freshness and quality of the products.2 In addition, the various promotional activities usually offered by e-commerce platforms have increased consumers’ willingness to purchase.3
However, although e-commerce anchors are playing an increasingly important role in aquatic products sales, there is still a relative lack of systematic research on consumer behavior in this field.
Especially in the field of seafood, consumers tend to be wary of products due to their perishability and inconsistent quality. Therefore, e-commerce anchors play a key role in shaping the product image and enhancing the trust of consumers. In addition, when promoting users’ transactions, the e-commerce live streaming platform is quite different from traditional social commerce in terms of user interactivity, entertainment, etc.4 In the live streaming rooms, consumers can watch the dynamic display of the anchors of live streaming, and more intuitively feel the characteristics of aquatic products more intuitively, at the same time,they can socially communicate with anchors or other consumers in the same shopping environment, which can make up for the lack of social factors in the pure online shopping environment and find the factors that support them to make a shopping decision. According to research, most consumers will be influenced by the social influence of other consumers in the same shopping environment, thus changing their shopping decisions, which is amplified in the live streaming environment, thus forming a herd effect. Moreover, through the live broadcast of the anchor, real-time dynamic information also touches the consumer side.Consumer perception is more likely to be activated in the sales channel of live streaming, so in this context, what kind of value perception dimension will make consumers have the will to buy aquatic products?
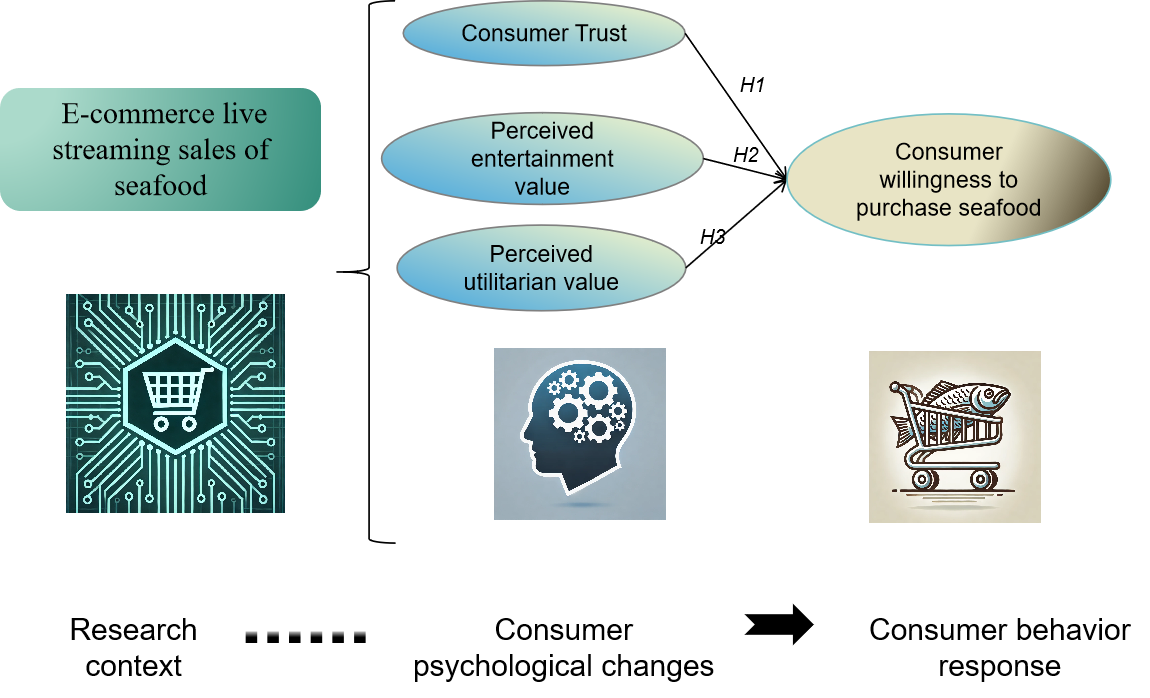
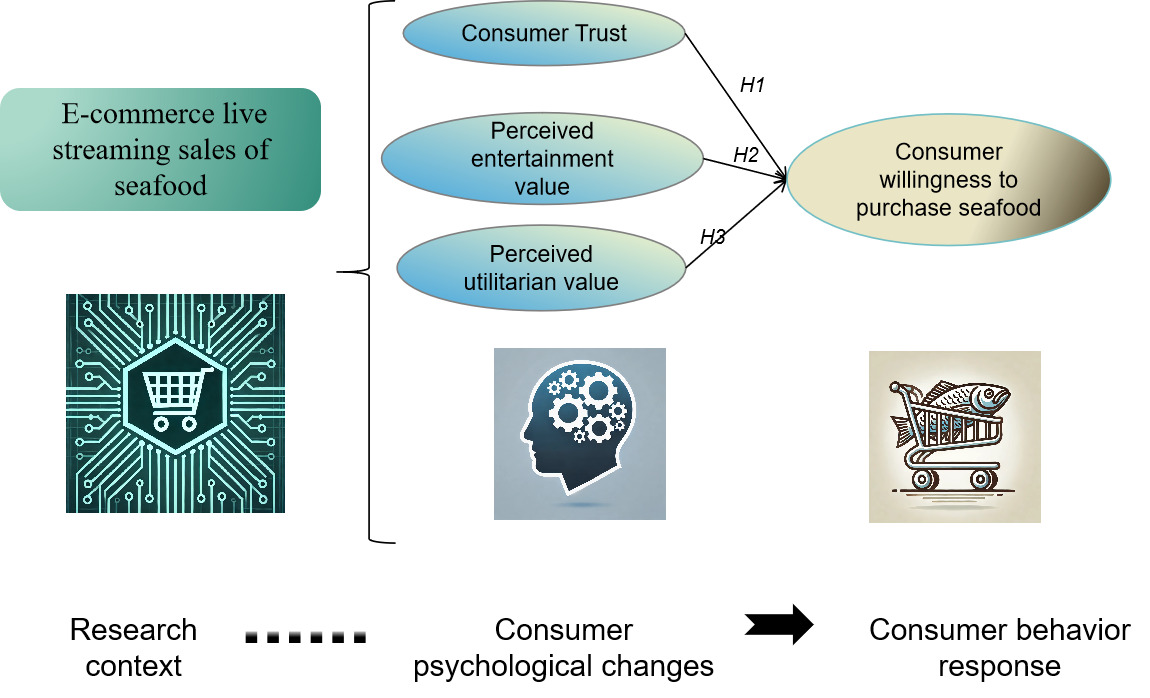
In order to solve the above research flaws as well as research problems, this paper starts from the perspective of consumer trust, perceived value, and explores the psychological change mechanism of consumers’ purchase of aquatic products in the specific context of anchor aquatic products with goods. It seeks to theoretically answer the important question of how to effectively land at the consumer level in the context of anchor live carrying aquatic products, and also provides management practice enlightment for the effective online conversion of aquatic product sales
Theoretical Foundations and Hypothetical Extrapolation
Live streaming and e-commerce live streaming
Live Streaming re-entered the limelight around 2016 as a novelty, with ‘re-’ implying that this form of media had existed before. According to the occasion of broadcasting, it can be divided into live broadcasting and studio broadcasting in the radio and television industry.5 However, with the popularity of the Internet, mobile phones are not only a communication tool, but also an entertainment tool for users, and with the change of entertainment carriers, mobile phone live streaming,that is, webcasting, is becoming more and more widespread and occupying the attention of users. Here, referring to the concept of communication and live TV streaming, webcasting can be interpreted as a process of generating and publishing information synchronously with the occurrence and development of events on the spot, which is a information network publishing method with a two-way flow process.6Its form can also be divided into streaming media live broadcast, text and picture live broadcast, video and audio live broadcast or live broadcast obtained from sources provided by a third party (such as TV). It not only has the functions of storage and search, but also has the characteristics of two-way communication, changing broadcast content and reducing costs.7 At the same time, along with the continuous progress and expansion of Internet technology, the content of live streaming is also developing and updating constantly.The current known live content has been involved in sports, e-sports, automobiles, legal auctions, shopping and other kinds of content. The characteristics of live streaming information update speed, profoundly changed the way people receive the world dynamics, shortened the time to receive information and enhanced the user’s sense of experience and participation, so that the users can really feel the concept of the “global village” and feel the freshness at any time and any place. With the advent of the 5 g era, the live streaming technology will make more remarkable progress. At that time, the mode and type of live streaming will be more diversified.
E-commerce live streaming, as an emerging business model, as the name suggests, is a transactional live streaming activity rooted in live streaming platforms or video platforms, as well as a live streaming form adopted by e-commerce platforms. Essentially, it belongs to a branch of webcasting, both the immediacy of information dissemination, two-way interaction between users and anchors, and a high degree of entertainment, at the same time orienting to transactional behaviour and marketing activities. This new trading business model pioneered by the original video platform benefits from the high user stickiness and interactivity of the platform. These users are used to staying on the platform for a long time and watching live content originally, meaning that the platform has a huge amount of natural traffic. On this basis, the platform has achieved effective realisation of traffic through live streaming with goods, without having to bear the burden of warehousing of goods or the responsibility of after-sales service, thus transforming into an efficient intermediary platform. For this type of video platform, live e-commerce not only provides a new transformation opportunity for it, but also becomes an effective way to attract new users. More importantly, it enables the platform to make full use of its own huge traffic resources, significantly boosting platform revenue and further expanding its market influence through rational allocation.
Consumer trust
When trust is introduced into the e-commerce environment, it is understood as “a response to a situation, an individual’s psychology and behaviour determined by situational stimuli”.8 Consumer trust is the emotional reliance that consumers place on a salesperson (in the case of a live e-commerce environment, it is a live anchor, and similarly in the following) in the face of uncertainty; The emotional reliance that consumers still place on a salesperson in the face of possible risk; And the emotional reliance that consumers still place on a salesperson even when they can anticipate that the salesperson may be deceptive, or when they clearly perceive the risk.9 In the context of aquatic product consumption, trust is still an important consideration for consumers when choosing to purchase aquatic products online.10
Consumers in a live streaming environment often experience a distinct difference from typical online shopping. Factors such as the decoration style of the live streaming room, the specialization of the product detail pages, and the content contributions from other consumers can lead to cognitive and emotional resonance with the host or fellow viewers. This shared experience can foster a sense of goodwill toward the host and other participants, making it easier for consumers to trust the live streaming environment and increasing the likelihood of making a purchase. Additionally, real-time data such as the number of add-ons, details of sold goods, and ongoing transactions, combined with endorsements from the platform, brand, and host, further enhance consumers’ trust in the live streaming.
Hypothesis 1: Consumer trust is positively related to consumer purchase intention in aquatic product e-commerce live streaming.
Perceived Value
Product perception is a driver of aquatic product consumption intention, and consumers’ perception of aquatic product perceptions significantly influences their purchase decisions.11 Consumer perceived value helps consumers make trade-offs between getting and paying for a perceived product or service, thus obtaining a comprehensive evaluation after trade-offs.12
Consumers’ perceived values, including functional and emotional aspects, play a crucial role in their aquatic product consumption decisions. This emphasises the importance of marketing strategies in driving consumption by enhancing these perceived values.13 In the context of this study, perceived entertainment value can be understood as the fact that consumers are attracted to enter the viewing by the language, dynamic expressions, interactions, etc. of the e-commerce live streaming room anchors. That is, emotional pleasure is an important factor influencing consumers to make purchase decisions whether they shop offline or online.
Perceived utilitarian value is usually opposed to perceived entertainment value. Perceived utilitarian value can be understood as meaning that consumers are more attracted by the product or service itself than by the emotional experience, that is, utilitarian value influences consumers’ rational decision-making. Consistency in the attributes of the product or service itself facilitates the consumers’ purchasing decision.14 Consumers’ perceived utilitarian value will be influenced by the anchor and change,thus affecting the purchase of seafood. Based on the above analysis, this paper proposes the following two hypotheses:
Hypothesis 2:In the live broadcast of seafood by e-commerce, the entertainment value perceived by consumers is positively related to consumers’ purchase intention.
Hypothesis 3: In seafood e-commerce live streaming, consumer perceived utilitarian value is positively related to consumers’ purchase intention.
Research design
The research presented in this paper primarily utilizes a questionnaire survey method, comprising a total of 18 questions. The survey begins with a polite introduction, explaining that the purpose of the questionnaire is to study the factors influencing consumers’ purchasing intentions for aquatic products. It also assures respondents that their information will remain confidential and anonymous, with all data used solely for research purposes. Questions 1-4 gather basic demographic information from the respondents, including gender, age, educational background, and monthly disposable income. Question 5 serves as a screening question to determine whether respondents belong to the target survey group, specifically whether they have watched e-commerce livestreams related to aquatic products. If respondents answer “No,” the questionnaire concludes. If they answer “Yes,” they proceed to the main section of the questionnaire, which examines the factors influencing their purchasing intentions based on Taobao livestreaming. The main body of the questionnaire employs a Likert 5-point scale, where “1” indicates strong disagreement, “2” indicates disagreement, “3” indicates neutrality, “4” indicates agreement, and “5” indicates strong agreement. This section investigates the various factors influencing consumers’ purchasing intentions using this Likert scale format.
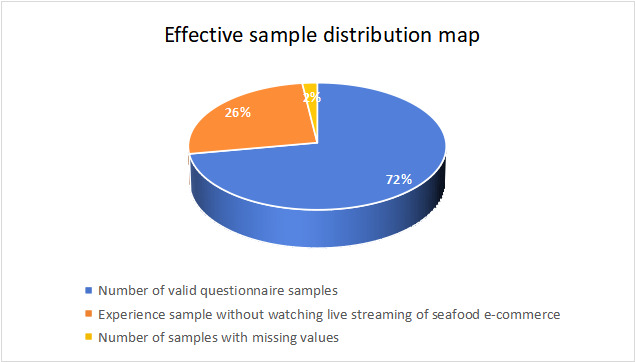
The questionnaire was designed, released and recovered mainly through the “Sojump” platform, and the release channels included WeChat, WeChat Official Account, QQ, Weibo, Douban and other social platforms. A total of 457 questionnaires were collected, and 330 were valid by screening whether the respondents have watched e-commerce livestreaming related to aquatic products, while 118 respondents had no experience of watching. In addition, another 9 samples had missing values and the answering time was too short and the above samples were eventually eliminated, so finally the data samples that could be analyzed reached 72%(Fig.2).
The key variables selected in this paper include consumer trust, perceived entertainment value, perceived utility value, environmental self-efficacy, and consumer purchasing intention. In order to ensure the reliability and validity of the questionnaire measurement, the measurement items were all referred to the mature scale in relevant studies, and were Combined with the characteristics of aquatic products consumption and the research theme of e-commerce livestreaming. The expression of relevant words in some items is reasonably modified and adjusted without changing the original meaning. Details of the scale are as follows:
Descriptive Statistics analysis
As shown in Table 2, there are 20 males, accounting for 6.1%, and 310 females, accounting for 93.9%. From this data, it can be seen that most of the respondents watching live seafood are female. Although the proportion of male respondents is very small, but there are many male respondents who are interested in seafood and are taking a wait-and-see attitude. The statistics shows that some people are shopping in the livestreaming. This deserves attention and consideration.
As shown in Table 3, among the respondents who watched live aquatic product streams, 15 were 18 years old or younger, accounting for 4.5% of the total; 230 respondents were aged 19-25, making up 69.7%; 59 respondents were aged 26-30, representing 17.9%; and 26 respondents were aged 31 and above, accounting for 7.9%. These data indicate that nearly 70% of the viewers fall within the 19-25 age range, a group known for its curiosity about new experiences and willingness to explore. This suggests that e-commerce livestreaming is particularly effective at attracting this demographic. The 26-30 age group, often characterized by stable employment and income, generally maintains a positive and optimistic attitude toward consumption, making them a key target audience for seafood e-commerce livestreaming.
As can be seen from Table 4, among the 330 respondents who have watched relevant livestreaming, 232 have a bachelor degree, accounting for the largest proportion (70.3%). The next largest group is graduate students and above, accounting for 15.2%, a total of 50. Nearly 85% of the respondents are people who have received higher education in China, so we can know that the pan-entertainment of seafood livestreaming is also favored by people with higher education.
It can be seen from Table 5 that 41.9% of the respondents have a monthly disposable income of 3,000 yuan or above, accounting for the largest proportion; Secondly, the number of people with disposable income in the range of 1001-2000 yuan reached 32.4%, a total of 110; There were 52 respondents with disposable income between 2001 and 3000 yuan. The amount of disposable income usually directly affects consumers’ shopping decisions. In the results of this survey, the disposable income of users who have watched the e-commerce livestreaming of seafood is relatively considerable.
As shown in Table 6, the average value of each variable exceeds 2.5, indicating that consumers generally hold a positive attitude toward livestreaming of seafood. Additionally, the relatively low measures of dispersion, as reflected in the average values and standard deviations of each variable, suggest that the sample is of good quality and the responses are consistently reliable.
As can be seen from Table 7, Cronbach’s Alpha coefficients of consumer trust, perceived entertainment value and consumer purchasing intention are all greater than 0.8, indicating that the credibility of the questionnaire is very good, and the variable design of the questionnaire has a good correlation. Cronbach’s Alpha coefficient of perceived utility value is 0.712, between 0.7-0.8, and the reliability is acceptable. On the whole, the design of this questionnaire has good credibility, and the analysis results are reliable.
As can be seen from Table 8, the KMO values of consumer trust, perceived entertainment value and other factors are all greater than 0.5, indicating that there is a certain correlation between the variables, and the questionnaire is effective. The significance is equal to or less than 0.001, indicating that the questionnaire is also suitable for factor analysis.
It can be seen from Table 9 that the factor loadings of consumer trust, perceived entertainment value, perceived utility value and consumer purchasing intention are all greater than 0.5, indicating that each common factor has a good explanatory ability for its own variables. The eigenvalues of the other four variables are 4.815, 3.231, 1.552 and 3.625 respectively, all of which are greater than 1, and a common factor is extracted from each variable. The total explanatory power corresponding to these four variables was 68.784%, 80.763%, 77.616% and 51.789%, respectively, which were all greater than 50%, indicating that the selected factors had good representativeness. It can be seen from the above that the variables in this questionnaire have good explanatory ability.
Correlation analysis
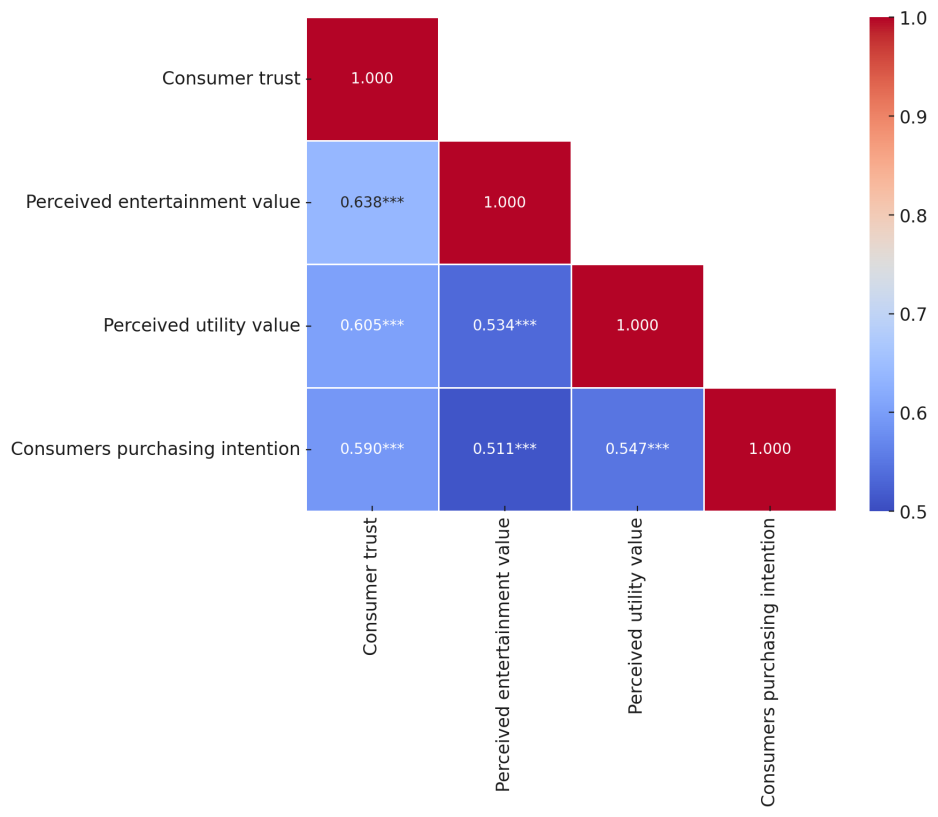
As can be seen from Fig.3, the sum of correlation coefficients between consumer trust and consumer purchasing intention is 0.590, and the significance is 0.000, less than 0.001, indicating that consumer trust is positively correlated with consumers’ purchasing intention. The correlation coefficient sum between the perceived entertainment value and consumers’ purchasing intention is 0.511, and the significance is 0.000, less than 0.001, indicating that the perceived entertainment value is positively correlated with consumers’ purchasing intention. The correlation coefficient sum between perceived utility value and consumers’ purchasing intention is 0.547, and the significance is 0.000, less than 0.001, indicating that perceived utility value is positively correlated with consumers’ purchase intention. The above analysis shows that most of the variables have a good correlation, and the research hypothesis proposed in this study has been preliminarily verified. The analysis results of Pearson correlation coefficient provide a good evidence for the hypothesis testing in the following paper.

Hypothesis testing
After the above correlation analysis results are obtained, SPSS24.0 statistical tool is still used to verify the research hypothesis proposed in Chapter 3. In this study, three independent variables of consumer trust, perceived entertainment value and perceived utility value are selected as the control variables of the regression model of consumer purchasing intention.
As can be seen from Table 10, the adjusted R square of 0.347 indicates that consumer trust can explain 34.7% of the change in consumers’ purchasing intention. The standardization coefficient is 0.545, and the significance is 0.000, less than 0.001, which indicates that consumer trust has a significant impact on consumers’ purchasing intention. At the same time, the Durbin-Watson value is close to 2, indicating that there is no autocorrelation between the residuals (i.e. the residuals are independent).
It can be seen from Table 11 that R is 0.511, indicating that goodness of fit is a large effect. The adjusted R square of 0.259 indicates that the perceived entertainment value can only explain 25.9% of the change in consumers’ purchasing intention. The standardization coefficient is 0.511 and the significance is 0.000, which is less than 0.001, indicating that the perceived entertainment value has a significant impact on consumers’ purchasing intention.
As can be seen from Table 12, R is 0.547, indicating that goodness of fit is a large effect. The adjusted R-squared of 0.297 indicates that the perceived entertainment value can only explain 29.7% of the change in consumers’ purchasing intention. The standardization coefficient is 0.547, and the significance is 0.000, less than 0.001, indicating that the perceived utility value has a significant impact on consumers’ purchasing intention.
In this regression model, by building consumer trust, perceived entertainment value and perceived utility value as independent variables and consumers’ purchasing intention as dependent variables, it can be concluded from the above table that these three factors have significant positive effects on consumers’ purchasing intention, that is, all three hypotheses have been verified, and the above results will be discussed in the following paper.
Discussion
Conclusion
This study uses 330 valid questionnaires as research samples and takes the perceived value model as the theoretical framework, and combines the perspective of consumers’ online trust to explore the impact of the context of live interaction on consumers’ purchasing intention of seafood.Our research has reference value for aquatic product consumers. Especially for those who have experience in live streaming to purchase seafood, it is possible to analyze their attitude changes from a psychological perspective.
The results show that: First, consumer trust is positively correlated with consumers’ purchasing intention, that is, hypothesis 1 is valid. This conclusion is basically consistent with the logic of Morgan’s point of view, and our research is specific to livestreaming sales in the context of e-commerce,19 and discusses the interpersonal trust dimension of anchors when selling aquatic products. Therefore, we described the research objects and situations more specifically, which not only tested the importance of interpersonal trust in the livestreaming sales of seafood, but also expanded the applicable scope of the research on consumer trust.
Perceived entertainment value and perceived utility value can positively affect consumers’ purchasing intention of seafood. So hypothesis 2 and hypothesis 3 are true. In other words, from the two dimensions of theory perceived value theory , this paper reveals the process of consumers’ thinking about seafood under the situation of streamers selling goods. Compared with previous studies,20,21 we explored perceived value theory in the context of special e-commerce streamers selling goods. At the same time, we studied the consumption behavior of seafood, a special category of commodities, which not only enriched the application scope of perceived value theory, but also extended the framework of perceived value theory .
Managerial implication
To enhance consumers’ willingness to purchase seafood via e-commerce livestreaming, the government and relevant institutions should prioritize the establishment of a more transparent product information disclosure mechanism. This would ensure that consumers have access to detailed information regarding the source and quality of seafood, thereby increasing their trust. Additionally, there should be a push towards standardizing professional training and certification for streamers to elevate their expertise and credibility. The government should also implement robust cybersecurity and privacy protection regulations to safeguard consumers’ personal information and transactions.
For businesses, offering attractive pricing and promotional strategies during livestreams can boost consumers’ purchasing motivation. Moreover, establishing a reliable after-sales service system, including policies like no-questions-asked returns and quick refunds, can further build consumer trust in online shopping. In practice, companies should focus on enhancing the transparency and entertainment value of livestream content. This can be achieved by providing detailed disclosures about seafood and offering real-time logistics tracking to strengthen consumer trust. Collaborating with streamers who possess professional knowledge and a strong reputation is crucial, and regular professional training on seafood should be conducted to reinforce streamers’ credibility and consumer confidence.
To improve perceived entertainment value, businesses can incorporate interactive activities and engaging content within the livestreams, while leveraging social media platforms to amplify communication and increase consumer participation. Additionally, strengthening network security measures, protecting consumer information, and enhancing brand image through membership programs and brand-related activities are essential strategies for fostering long-term consumer purchasing intentions.
Future recommendations
This study still presents several areas that warrant further exploration. We propose that future research could be advanced in the following three directions: (1) This study employs an empirical research approach, which inherently has limitations. Future research can refer to wang’s method,22 which could benefit from incorporating situational experimental methods to complement this approach. (2) Although the study utilizes established theoretical frameworks, such as perceived value theory, to investigate the impact of online green interaction on consumers’ green food purchasing intentions, it did not employ qualitative research methods to extract influencing factors. This omission may result in the theoretical model not fully capturing the unique aspects of green food purchasing behavior. (3) The survey data, collected via self-reported questionnaires, particularly regarding aquatic product behavior, may not accurately reflect actual behavior due to potential self-report biases—a common limitation in consumer behavior research. Future studies could address this by employing cross-validation techniques using neuroscience methods, such as electrodermal response, eye-tracking experiments, and facial expression analysis. (4) As the live broadcast of aquatic products is a new practice channel, the future research can be cut in from more fields: for example, learning from articles in the field of aquatic products logistics,23 adding the background of live broadcast e-commerce, and studying the optimization path of logistics distribution for merchants. Besides, referring to Xu’s spatial econometric method,24,25 further research can study the spatial-temporal pattern and spillover effect of e-commerce industrial agglomeration of aquatic products live broadcast.
Acknowledgments
This research was funded by the “National Social Science Foundation of China: 22BGL274”;and Science and Research Start-up Funding project from STIEI: AI Reshaping Fintech Skills in Shanghai (GCC2023015)
Authors’ Contribution
Conceptualization: Shiwei Xu (Lead). Formal Analysis: Shiwei Xu (Equal), Xuping Huang (Equal), Wenjing Huang (Equal), Dan Wu (Equal). Resources: Shiwei Xu (Equal), Fengling Guo (Equal). Methodology: Fengling Guo (Equal), Xuping Huang (Equal), Siyuan Zhang (Equal). Investigation: Fengling Guo (Equal), Xuping Huang (Equal), Siyuan Zhang (Equal), Wenjing Huang (Equal), Yilei Ren (Equal). Writing – original draft: Fengling Guo (Equal), Siyuan Zhang (Equal). Supervision: Xuping Huang (Lead). Funding acquisition: Xuping Huang (Equal), Siyuan Zhang (Equal). Writing – review & editing: Yilei Ren (Equal), Dan Wu (Equal).
CONFLICT OF INTEREST
The authors declare that they have no conflicts of interest.
Data Availability Statement
The data supporting this study’s findings are available from the corresponding author upon reasonable request.