Introduction
Globally, some 40 million people are directly engaged in capture fisheries and aquaculture, and fisheries are not only a major economic source for many coastal communities but also one of the important sources of food supply globally. Global fisheries currently face significant challenges, including overfishing. To ensure the sustainable utilization of fisheries resources over the long term, the Food and Agriculture Organization of the United Nations (FAO) has advocated for a “Blue Transition.” This approach promotes fisheries and aquaculture through sustainable practices that minimize environmental impact while maximizing economic benefits and social well-being. Concurrently, countries around the world are implementing various measures to protect fishery resources, such as establishing fishing quotas, creating marine protected areas, and enforcing fisheries management policies. From China’s perspective, the further development of the fisheries economy is crucial for maintaining a positive cycle within its marine ecosystem, optimizing the utilization of marine resources, and ensuring steady economic progress. It is imperative to explore new modes of fishery development to transform the existing development model of the fisheries industry and address issues such as resource depletion, an imperfect industrial chain, and lagging technological innovation. The digital economy, characterized by the use of digital technologies such as the Internet, big data, and cloud computing, transcends temporal and spatial limitations, providing extensive data resources and technical support for fishery development. Industrial digitization accounts for 86.8% of the digital economy, indicating that globally, digital technology and data resources are accelerating their integration into the real economy at a deeper level and in a wider range of fields and have become an important force driving economic growth. Notably, several listed companies in China’s fisheries sector have embarked on digitalization initiatives. For instance, CNFC Overseas Fisheries Co., Ltd. convened a board meeting on August 29, 2023, to approve a “Proposal on the Establishment of a Wholly-Owned Subsidiary,” aimed at promoting the digitalization and upgrading of the company’s high-end fish industry chain. This initiative seeks to establish a tuna-based high-end fish “industry + digitalization” platform, ultimately positioning the new subsidiary as an international hub for high-end aquatic product trading, settlement, and pricing. The experience of exploring digital transformation within Chinese fishing companies provides a valuable foundation for this research.
The extant literature on the operational efficiency of fishing businesses is limited in scope, with the majority of studies focusing solely on technical efficiency and employing imprecise measurement indicators. Digital technology emerges as a powerful tool that not only facilitates the analysis of online data related to recreational fisheries but also enhances fisheries management through the real-time formulation of data-driven policies.1 It has been suggested that the digital economy may promote advancements in marine fisheries through innovative green technologies2; however, a comprehensive and effective evaluation system for measuring the input-output effectiveness of listed fishery companies remains undeveloped.
The contributions of this paper are twofold: (1) By analyzing the impact of digital technologies (e.g., IoT, Big Data, Artificial Intelligence) on the operational efficiency of fishery firms, this research explores the integration of digitization with traditional business practices within the fisheries sector, thereby enriching the existing theoretical framework of fishery management. (2) The findings provide practical insights for achieving more accurate fishery management, mitigating overfishing, and preserving marine ecosystems, which are essential for the long-term sustainability of resources and the natural environment and for the enduring development of the fishing industry.
Materials and Methods
Domestic and international empirical studies on fishery efficiency primarily rely on Data Envelopment Analysis (DEA) and Stochastic Frontier Analysis (SFA) models, often focusing on the overexploitation of fishery resources to balance fleet capacity with resource protection. Maravelias and Tsitsika3 conducted a DEA study in the eastern Mediterranean Sea and found an overcapacity in the current fleet. Similarly, Li and Xu4 used a DEA-Tobit two-stage analysis to assess China’s offshore fishing efficiency, revealing that while efficiency is generally high, most provinces are experiencing diminishing returns to scale. This suggests that the input of fishery resources has exceeded the optimal scale, leading to efficiency losses.
Kim et al.5 applied the SFA method to evaluate the production efficiency of the gillnet fishery targeting sand sharks off South Korea’s east coast, uncovering inefficiencies in the coastal gillnet fishing vessels. Meanwhile, Duy and Flaaten6 used DEA and a stochastic production frontier approach to calculate the technical efficiency of Vietnam’s offshore fishery, further contributing to the global understanding of fishery efficiency.
Numerous studies have emerged at the Chinese level exploring fishery carbon emissions and the factors influencing emission efficiency. The findings indicate significant variability in carbon sink efficiency across provinces, with narrowing differences in relative and absolute efficiency and economic value, showing continuous growth.7 Additionally, a complex spatial correlation network has been observed, with regional differences in aquaculture structure, technology, infrastructure, and economic development contributing to the spatial correlation of fishery carbon emission efficiency.8
Current research on the impact of digitization on marine fisheries largely focuses on micro-level perspectives. Specific developments in information technology influence the maritime industry and its capacity for sustainable growth in the digital economy. Schoening et al.9 advocated using Image FAIR Digital Objects (iFDO) for gathering marine habitat data, while others identified key challenges in developing efficient imaging analysis and monitoring tools, leading to improvements in Ocean Vision AI’s capabilities. Pan et al.10 explored the application of digital ocean technologies, such as Geographic Information Systems (GIS), Remote Sensing (RS), and Virtual Reality, to coastal development, fisheries, and marine environments.
In the European context, Nham et al.11 investigated the link between digitization and the sustainable extraction of marine minerals, concluding that digital technologies significantly impact the sustainability of marine resources and the blue economy. Fang et al. confirmed that the growth of China’s marine industry is closely tied to digital innovation. Tzachor et al.12 highlighted the potential of digital twins as a powerful tool for enhancing sustainability in ocean management by preventing pollution, habitat destruction, and overfishing, while Brönner et al.13 emphasized the role of digital twins in providing accurate ocean condition predictions to facilitate real-time decision-making across marine-related industries, including fisheries, shipping, and offshore energy production.
In summary, while existing literature extensively discusses the relationship between digital technology and economic growth in marine fisheries, there is a lack of in-depth research on constructing a reasonable and effective evaluation system to measure the impact of digital transformation on fishery enterprise operational efficiency. This study addresses this gap by analyzing a sample of listed Chinese fishery companies from 2012 to 2022. The study employs the DEA-BCC and Malmquist index models to evaluate operational efficiency and uses the Tobit model to investigate the relationship between operational efficiency and digital transformation. Finally, it recommends that fishery enterprises implement digitalization practices and optimize their operational efficiency.
Model construction
In academic studies, the mainstream methods for measuring operational efficiency are primarily divided into Stochastic Frontier Analysis (SFA) and Data Envelopment Analysis (DEA). Since SFA can only evaluate operational efficiency in single-output, multi-input scenarios, it falls short of capturing the complexities of real-world business operations, which often involve multiple outputs. As a result, this study employs the DEA model as the principal analytical tool for evaluating the operational efficiency of companies within the fisheries industry.
DEA is based on the concept of “relative efficiency evaluation” and was first introduced by Charnes et al.14 with the DEA-CCR model, which operates under the assumption of constant returns to scale. Later, Banker and Cooper15 introduced the BCC model, which assumes variable returns to scale and decomposes technical efficiency into two components: pure technical efficiency and scale efficiency. Given the challenges fishery-listed companies face in adhering to constant returns to scale in real-world operations, this study adopts the DEA-BCC model, which accounts for variable returns to scale, to evaluate the static operational efficiency of these companies.
The study employs the Malmquist index to assess the dynamic changes in operational efficiency over time, providing a more comprehensive evaluation of efficiency trends within the fisheries sector. Finally, the Tobit model is used for further analysis to explore the impact of digital transformation on the operational efficiency of listed fishery enterprises.
DEA-BCC model
Data Envelopment Analysis (DEA), as proposed by Charnes et al.,14 is a method for calculating the relative efficiency between sample data based on multiple input and output variables using linear programming. In this study, the DEA-BCC model is adopted to assess the operational efficiency of Chinese-listed fisheries companies, considering the practical reality of fluctuating returns to scale. The model is structured as follows:
min
s.t.\left\{ \begin{array}{r} \sum_{j = 1}^{n}{x_{ij} + S_{i}^{-} = \theta x_{ij}\ ,i = 1,2,\cdots,n} \\ \sum_{j = 1}^{n}{x_{ij} + a_{j} = y_{ij}\ ,r = 1,2,\cdots,n} \\ \sum_{j = 1}^{n}{a_{j} = 1} \\ \theta,a_{j},S_{i}^{-},S_{r}^{+} \geq 0\ ,j = 1,2,\cdots,n \end{array} \right.\ \tag{2}
Where x denotes the number of inputs, y denotes the number of outputs, n represents the number of decision-making units, is the integrated efficiency index and is the weight variable, the slack variable and the surpuls variable reflect the amount of output insufficiency and input redundancy, respectively. = 1 indicates that DEA is effective, and vice versa, DEA is ineffective. The value of the comprehensive efficiency of DEA can be split into pure technical efficiency and scale efficiency. Comprehensive efficiency = pure technical efficiency × scale efficiency.
DEA-Malmqiust Index Model
The Malmquist index was first introduced by Malmquist (1953), and later applied by Caves et al. (1974) to measure changes in production efficiency. Building on this, Färe et al. combined the Malmquist index with DEA theory to establish a method for analyzing total factor productivity growth (TFPCH) across different time periods. This addressed the limitation of the static DEA model, which cannot evaluate panel data or changes over time.
The Malmquist index evaluates changes in efficiency by decomposing total factor productivity into two key components: the technical efficiency change index (EFFCH) and the technical progress index (TECH). Together, these indices form the total factor productivity change index (TFPCH), providing a comprehensive view of both efficiency improvements and technological advancements over time.
The model is constructed as follows:
\min{\lbrack\theta - \varepsilon(e^{-}S^{-} + e^{+}S^{+})\rbrack}\tag{3}
s.t.\left\{ \begin{array}{r} \sum_{j = 1}^{n}{x_{j}\lambda_{j} + S^{-} = \theta x_{k}} \\ \sum_{j = 1}^{n}{x_{j}\lambda_{j} + S^{-} = \theta x_{k}} \\ \lambda_{j} \geq 0\ ,j = 1,2,\cdots,n \\ {S^{+} = \left( s_{1}^{+},s_{2}^{+},\cdots,s_{q}^{+} \right)}^{T} \geq 0, \\ S^{-} = ({(s_{1}^{-},s_{2}^{-},\cdots,s_{q}^{-})}^{T} \geq 0 \end{array} \right.\tag{4}
Where is the efficiency value; is the weight of input and output indicators of decision cell j; is the input vector of decision cell j, is the output vector of decision cell j, p is the number of input indicators, and q is the number of output indicators; is the p-dimensional unit row vector, and is the q-dimensional unit row vector; and are the input and output slack variables, respectively; and is the non-Archimedean infinitesimal quantity. When = 1 and the decision unit k inputs and outputs are DEA effective; when = 1 and the decision unit k inputs and outputs are weakly DEA effective; when < 1, then the decision unit k is non-DEA effective, and needs to be adjusted for the input and output configuration. If n additional convexity constraints that is the variable scale payoff BCC model.
The Malmquist index model has been constructed based on the efficiency measurement results of the DEA model, with the objective of reflecting changes in operating efficiency in different periods. This approach allows for a comprehensive dynamic analysis of the operating efficiency of listed fishery companies. This is because the DEA model’s analysis of the operating efficiency of listed fishery companies is a static analysis, which fails to reflect dynamic changes in the operating efficiency of listed fishery companies. The Malmquist index is a tool for calculating the change in total factor productivity, or the change in technical efficiency of inputs and outputs for decision-making units under period t technology from period t to period t+1, and the change in technical efficiency of decision-making units under period t+1 technology from period t to period t+1. Total factor productivity change (TFPCH) can be explained by technical efficiency change (EFFCH) and technical progress (TECH) as follows:
\scriptsize\begin{aligned}M\left( x_{t},y_{t},x_{t + 1},y_{t + 1} \right) =& \frac{D^{t + 1}(x_{t + 1},y_{t + 1})}{D^{t}(x_{t},y_{t})} \\&\times {\lbrack\frac{D^{t}(x_{t + 1},y_{t + 1})}{D^{t + 1}(x_{t + 1},y_{t + 1})} \times \frac{D^{t}(x_{t},y_{t})}{D^{t + 1}(x_{t},y_{t})}\rbrack}^{1/2} \\=& EFFCH \times TECH\end{aligned}\tag{5}
Where and represent the relative efficiency of inputs and outputs of the decision-making unit with reference to the technology level in period t and period t+1, respectively. When M is greater than 1, total factor productivity is growing from period t to period t+1; when M is equal to 1, it is stagnant, and when it is less than 1, it is declining. The total factor production change can be further broken down into the following equation, given that technical efficiency is equal to the product of pure technical efficiency and scale efficiency.
\begin{aligned}M\left( x_{t},y_{t},x_{t + 1},y_{t + 1} \right) =&\ TFPCH\ \\=& \ EFFCH\ \times TECH\ \\&= \ PECH\ \\&\times \ SECH\ \times \ TECH\end{aligned}\tag{6}
Tobit model
The range of efficiency values that can be calculated using the DEA model is restricted to values between 0 and 1. Regression analysis based on the maximum likelihood method (MLE) is typically performed for the constrained dependent variable using the Tobit model. This is a more precise and scientific approach to analyzing the primary factors influencing changes in the dependent variable. The specific form of the Tobit model is as follows:
y_{i} = \left\{ \begin{array}{r} c_{1},\ \ 若y_{i}^{*} \leq c_{1} \\ x_{1}\beta + \varepsilon_{i},\ \ 若c_{1} \leq y_{i}^{*} \leq c_{2} \\ c_{2},\ \ 若y_{i}^{*} \geq c_{2} \end{array} \right.\tag{7}
Where is a vector of regression parameters, is a vector of explanatory variables, is a vector of explanatory variables, and is a vector of values taken by the explanatory variables. A typical form of the Tobit model is to set to 0, and to positive infinity and the stochastic perturbation term obeys the normal distribution N(0, with an expectation of 0 and variance of In this paper, the following Tobit model is constructed:
\begin{aligned}{Crste}_{it} =& \beta_{0} + \beta_{1}{Digital}_{it} + \beta_{2}{Lev}_{it} \\&+ \beta_{3}{Grossprofit}_{it} + \beta_{4}{Cashflow}_{it} \\&+ \beta_{5}{Ctr}_{it} + \beta_{6}{Cap}_{it} + \beta_{7}{Cl}_{it} \\&+ \beta_{7}{Board}_{it} + \beta_{8}{Indep}_{it} + \varepsilon_{it}\end{aligned}\tag{8}
Where, is the operating efficiency of the ith enterprise listed in China’s fishery industry in the th year (the operating efficiency here refers to the comprehensive efficiency in the results measured by the BCC model), i=1, 2,…, 7; t=2012, 2013,…, 2022; is the stochastic perturbation term.
Data source and variable setting
The study focuses on the fisheries-listed firms in the industry categorization standard established by the China Securities Regulatory Commission in 2012, selected based on their relevance to the research content (Table 1). It excludes the ST and the enterprises with missing key variables and finally selects seven fishery-listed companies with relevant data from 2012 to 2022 as the research object of this paper. Data in this paper are all from the China Stock Market & Accounting Research Database (CSMAR), and the measurement software used includes DEAP2.1 and STATA17.
Input-Output Indicators
Input Indicators
-
Asset Inputs. Asset inputs are crucial to an enterprise’s operation and development and vital in enhancing its financial standing and competitive edge. This paper categorizes asset inputs based on the nature and purpose of the assets, selecting four key indicators: enterprise size, fixed asset ratio, number of employees, and R&D ratio. These indicators respectively represent total capital input, physical input, personnel input, and technology input. Logarithmic transformation is applied to address discrepancies in scale between enterprise size and the number of employees to eliminate potential heteroskedasticity issues.
-
Operating Condition. An enterprise’s operating condition can be evaluated through various financial metrics, including accounts receivable turnover, inventory turnover, current asset turnover, fixed asset turnover, and total asset turnover. These indicators provide insight into a company’s financial health, operational efficiency, and profitability. Among these, the current asset turnover ratio indicates how efficiently an enterprise converts its current assets into cash. A higher ratio suggests effective management of assets such as inventories and accounts receivable, minimizing waste and idleness. On the other hand, total asset turnover measures all assets’ ability to generate sales revenue. A higher ratio indicates more efficient asset utilization, which, in turn, enhances return on capital. This study focuses on two key ratios, total asset turnover, and current asset turnover, as they reflect both comprehensive asset utilization and short-term efficiency.
-
Risk Profile. Enterprises are exposed to risks during daily operations, particularly related to insufficient liquidity or difficulty converting assets into cash. These risks can impair an enterprise’s ability to repay debts and affect its creditworthiness and operations. The liquidity and quick ratios are commonly used to evaluate an enterprise’s risk profile. These straightforward calculations provide an early warning system by identifying potential financial challenges based on trends in these ratios.
Output Indicators
An enterprise’s productivity and economic efficiency can largely be assessed through an analysis of its production processes. By examining output, enterprises gain insights into their production capacity, market competitiveness, and the rationality of resource allocation, enabling informed business decisions. Return on assets (ROA) is a key indicator for comparing asset utilization efficiency across enterprises of different sizes or for the same enterprise over different periods. This metric helps evaluate performance relative to industry standards, providing a relatively objective basis for comparison.
On the other hand, the operational profit growth rate measures the degree of increase in operational profit over a specified period. Analyzing this growth rate offers insights into profitability trends, which are crucial for forecasting future financial health. A higher growth rate typically indicates strong growth potential and solid market positioning. While ROA focuses on asset utilization efficiency, the operational profit growth rate emphasizes growth velocity. These indicators provide a comprehensive view of an enterprise’s financial health and future development prospects (Table 2).
This paper utilizes data from seven Chinese fisheries companies listed on the stock market, spanning 2012 to 2022, as decision-making units (DMUs). To ensure reliable results, it is essential that the number of DMUs is at least three times the number of input and output indicators used in the data envelopment analysis (DEA) model. Furthermore, the number of DMUs should ideally match the product of the number of input and output indicators. This study selects eight input and two output indicators, meeting the model’s basic requirements.
Given the presence of negative and zero values in the original data, preprocessing is necessary to ensure the scientific accuracy and effectiveness of the efficiency measurement. Therefore, the data are preprocessed using Min-Max standardization. The formula for this standardization is as follows:
X_{ij} = \frac{X_{ij} - min(X_{j})}{\max\left( X_{j} \right) - min(X_{j})}\tag{9}
An enterprise’s productivity and economic efficiency can largely be assessed through an analysis of its production processes. By examining output, enterprises gain insights into their production capacity, market competitiveness, and the rationality of resource allocation, enabling informed business decisions. Return on assets (ROA) is a key indicator for comparing asset utilization efficiency across enterprises of different sizes or for the same enterprise over different periods. This metric helps evaluate performance relative to industry standards, providing a relatively objective basis for comparison.
On the other hand, the operational profit growth rate measures the degree of increase in operational profit over a specified period. Analyzing this growth rate offers insights into profitability trends, which are crucial for forecasting future financial health. A higher growth rate typically indicates strong growth potential and solid market positioning. While ROA focuses on asset utilization efficiency, the operational profit growth rate emphasizes growth velocity. These indicators provide a comprehensive view of an enterprise’s current financial health and future development prospects.
This paper utilizes data from seven Chinese fisheries companies listed on the stock market, spanning 2012 to 2022, as decision-making units (DMUs). To ensure reliable results, it is essential that the number of DMUs is at least three times the number of input and output indicators used in the data envelopment analysis (DEA) model. Furthermore, the number of DMUs should ideally match the product of the number of input and output indicators. This study selects eight input and two output indicators, meeting the model’s basic requirements.
Given the presence of negative and zero values in the original data, preprocessing is necessary to ensure the scientific accuracy and effectiveness of the efficiency measurement. Therefore, the data are preprocessed using Min-Max standardization. The formula for this standardization is as follows (Table 3).
Results
The empirical analysis in this paper consists of three main parts. First, a static analysis is conducted using the DEA-BCC model to assess changes in three key efficiency indicators: comprehensive efficiency (Crste), technical efficiency (Vrste), and scale efficiency (Scale) for seven Chinese fishery-listed companies from 2012 to 2022. Second, a dynamic analysis is carried out using the Malmquist index to decompose the changes in total factor productivity (TFP) of these companies. Finally, the Tobit regression model is employed to examine the impact of digital transformation on the operational efficiency of listed fishery enterprises.
Static Analysis Using the DEA-BCC Model
The comprehensive efficiency, technical efficiency, and scale efficiency values of the seven fishery-listed companies were calculated using the static BCC model. The model provides insights into their operational efficiency from 2012 to 2022. The results are presented in Table 4.
From a macro perspective, the average values of comprehensive, technical, and scale efficiency for these companies over the 2012–2022 period are 0.957, 0.983, and 0.973, respectively. The higher mean value of technical efficiency compared to scale efficiency suggests that most decision-making units (DMUs) efficiently maximized outputs with the given level of inputs. However, the relatively lower scale efficiency indicates that these companies could benefit from improvements at the scale level.
From a micro perspective, none of the seven listed enterprises achieved a comprehensive efficiency score of 1, meaning they did not reach the DEA-efficient state. Orient Ocean and Baiyang had the lowest comprehensive efficiency values, indicating significant resource waste. In contrast, four of the seven enterprises achieved a technical efficiency score 1, signifying that these DMUs have reached optimal technical efficiency under their current scale and resource allocation. In other words, they have maximized output or minimized inputs under the given technical constraints.
Further analysis revealed that four firms had Crste values lower than Scale, indicating the presence of diseconomies of scale. This suggests that these firms may benefit from downsizing or optimizing their resource allocation by reassessing their input-output balance (Table 4).
DEA-Malmquist Index Dynamic Analysis
The traditional DEA model overlooks the influence of overall technological progress within the industry to which a decision-making unit (DMU) belongs. To address this, the present study extends prior research by examining Chinese fishery-listed companies’ total factor productivity (TFP) from 2012 to 2022. It employs the Malmquist index model to analyze the dynamic changes in efficiency growth among these firms.
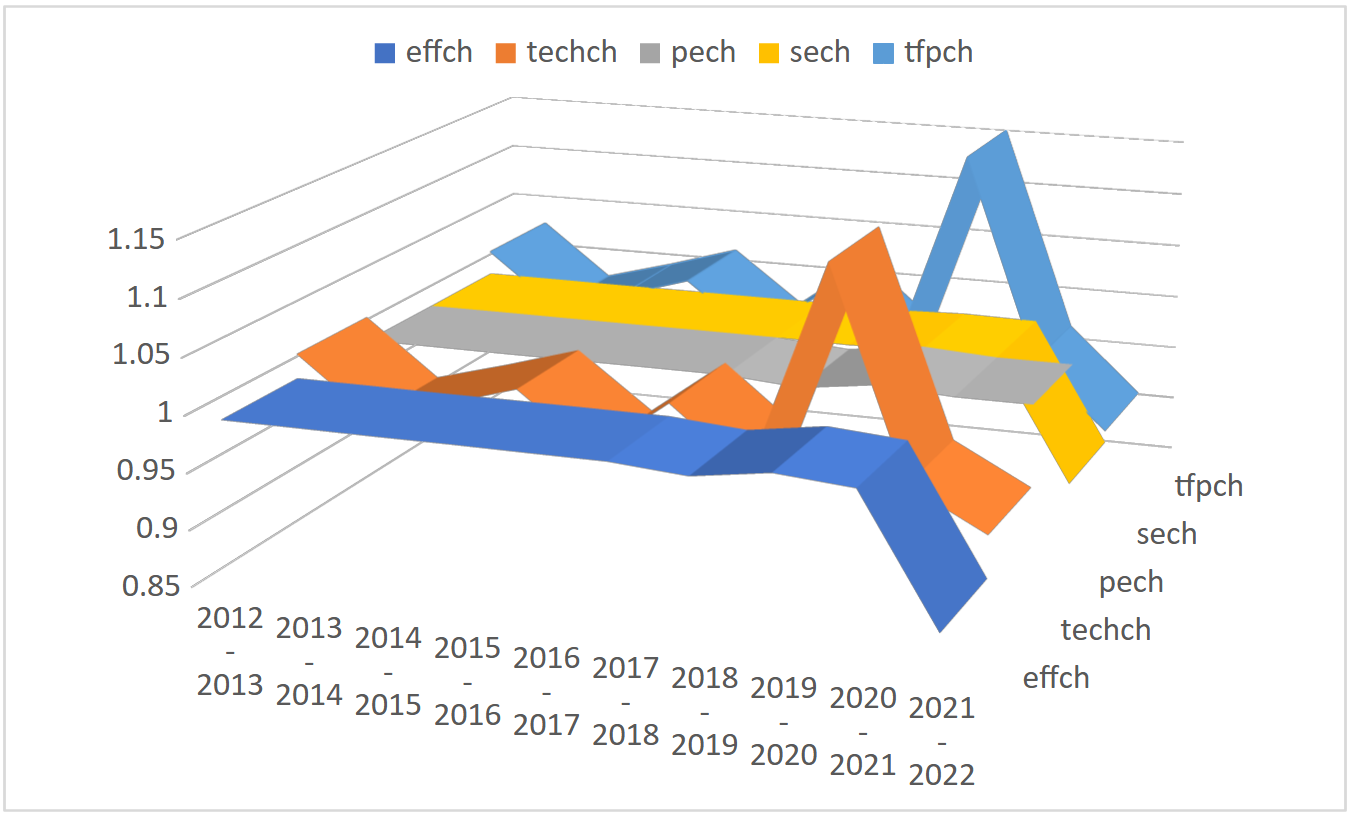
Regarding overall efficiency changes, the average total factor productivity of Chinese fishery-listed companies during this period was 0.989, implying a 0.1% annual decline relative to the base period. A year-by-year analysis of the data reveals that the Malmquist index was below 1 in most years, except for the periods 2012–2013, 2015–2016, 2017–2018, and 2019–2020, indicating that total factor productivity declined in the other years compared to the previous year.
By decomposing the Malmquist index into a technical efficiency index and a technical progress index, it can be observed that technical efficiency decreased by 0.1% per year, while technical progress declined by 0.04% annually. This suggests that the decline in technical efficiency is the primary cause of the reduction in total factor productivity. Using the relationship TFPCH = EFFCH * TECH = PECH * SECH * TECH, which further breaks down technical efficiency into pure technical efficiency and scale efficiency, it is evident that the mean value of pure technical efficiency remained at 1, while the mean value of scale efficiency was 0.989, reflecting a 0.1% annual decrease compared to the base period.
This analysis indicates that the decline in scale efficiency is the main factor contributing to the reduction in technical efficiency, which in turn leads to the overall decrease in total factor productivity among fishery-listed companies (Table 5).
As shown in Figure 1, the annual average Malmquist index and its decomposition for Chinese fishery-listed companies reveal different fluctuation patterns. The fluctuations in technical progress efficiency and total factor productivity (TFP) are more pronounced, and their trends remain closely aligned. In contrast, the fluctuation trends of technical efficiency and its components—pure technical efficiency and scale efficiency—are relatively stable. However, during the final period, a significant decline in scale efficiency led to a noticeable drop in overall technical efficiency.

In recent years, the productivity changes of Chinese fishery-listed companies have closely followed the efficiency changes associated with technological progress. To enhance their performance, these companies should focus on increasing capital investment in research and development (R&D), supporting technological innovation and new product development, regularly reviewing and refining their production processes, and adopting more advanced manufacturing technologies. By doing so, they can better align their productivity growth with technological advancements and improve overall efficiency.
As shown in Table 6, from 2012 to 2022, two Chinese fishery-listed companies—ZONECO and HOMEY—achieved total factor productivity (TFP) values greater than 1. Conversely, five companies recorded TFP values below 1. Oriental Ocean experienced the most significant decline in TFP, with a decrease of 0.56% per year, while the TFP of the remaining four companies ranged between 0.97 and 1.
The decomposition results indicate that the average decline in total factor productivity is primarily attributable to a decrease in the scale efficiency index. This suggests that many decision-making units may not operate at their optimal scale, leading to lower resource utilization efficiency among most fishery enterprises.
Tobit regression results
Descriptive Statistics of Variables
As shown in Table 7, the operational efficiency of Chinese fishery-listed companies exhibits a minimum value of 0.184 and a maximum value of 1, with a mean value of 0.957. This indicates that, overall, the comprehensive efficiency of these companies is close to the effective threshold, although some enterprises remain ineffective. The digital transformation scores of the enterprises in the sample range from a minimum of 0 to a maximum of 2.833, highlighting a significant gap in transformation levels among the companies.
Regarding the control variables, there is considerable variation in capital intensity and comprehensive leverage among the enterprises, suggesting that they rely on capital to differing degrees during production. Some companies depend more on labor or asset-light operations. Additionally, while the overall risk level of the enterprises in the sample is relatively low, certain companies exhibit higher comprehensive leverage coefficients, indicating greater sensitivity to sales fluctuations and an increased risk profile. Other control variables show minimal differences in mean and median values, with standard deviations remaining within a reasonable range.
Regression Results and Analysis
The regression results presented in Table 8 reveal a significantly positive effect of enterprise digital transformation on the operating efficiency of fishery-listed companies at the 1% level. The Z-statistic of 2.79 indicates that as the degree of digital transformation increases, the operating efficiency of these enterprises also improves.
In analyzing the control variables
Debt-to-Assets Ratio, Gross Profit Margin, and Independent Director Ratio: The operating efficiency of enterprises is significantly negatively correlated with these factors. A higher debt-to-assets ratio typically indicates a greater reliance on debt financing, leading to increased interest payments and higher financial costs. Additionally, if a company attempts to boost its gross profit margin by raising product prices, it may risk losing market competitiveness and sales volume. This approach can also divert management attention from essential cost-control measures. Furthermore, independent directors often come from varied backgrounds and may possess differing management philosophies, complicating decision-making. To ensure that independent directors understand company operations and can provide effective recommendations, enterprises may need to invest more in information sharing and communication, potentially increasing management costs. Consequently, operational efficiency tends to decline as financial, product, and management costs rise.
Cash Flow Ratios: The analysis shows a significant positive correlation between firms’ operating efficiency and cash flow ratios. Adequate cash flow enables companies to capitalize on market opportunities more rapidly—such as investing in new projects, acquiring competitors, or expanding market share—while ensuring efficient utilization of cash resources and minimizing idle funds.
Capital Intensity, Comprehensive Leverage, and Board Size: The study found that these three variables do not significantly influence operational efficiency. However, all three displayed positive coefficients, suggesting that increased capital investment can lower the cost per production unit as firms achieve economies of scale. Additionally, fixed interest payments on debt can amplify earnings per share growth relative to overall profit growth due to financial leverage, thereby enhancing a firm’s profitability. Moreover, an increase in board size may necessitate more discussions for corporate decision-making, enhancing the quality and robustness of those decisions.
In summary, the findings highlight the crucial role of digital transformation in enhancing operational efficiency while also identifying key financial and managerial factors that influence performance in fishery-listed enterprises.
Discussion
This study analyzes a sample of Chinese fisheries-listed companies from 2012 to 2022, employing the Data Envelopment Analysis-BCC (DEA-BCC) and Malmquist index models to evaluate the companies’ operating efficiency. Additionally, a Tobit model is utilized to empirically investigate the relationship between operating efficiency and digital transformation. The key findings are as follows:
-
The mean values of comprehensive efficiency, technical efficiency, and scale efficiency for Chinese fishery-listed companies from 2012 to 2022 are all below 1, with the mean technical efficiency exceeding the mean scale efficiency. This indicates that companies should reevaluate their resource allocation strategies and adjust their inputs accordingly.
-
The average total factor productivity of Chinese fishery-listed companies during this period is 0.989, suggesting a decline of 0.1% per year relative to the base period. Decomposing the Malmquist index reveals that the primary reason for this decline is the reduction in scale efficiency, which adversely affects technical efficiency.
-
Implementing digital transformation strategies can significantly enhance the operational efficiency of listed fishing companies. This underscores the significance of digital transformation as a pivotal element in modernizing and intelligently enhancing the fishing industry. Furthermore, the regression model indicates that improvements in the cash flow ratio of fishery enterprises can enhance operational efficiency, whereas increases in the debt-to-assets ratio, gross profit margin, and independent director ratio tend to decrease operational efficiency.
Based on these empirical findings, this paper offers the following recommendations to improve the operational efficiency of fishery enterprises:
-
Addressing Scale Efficiency: The decline in the total factor productivity among firms in the fisheries sector is primarily due to reduced scale efficiency. Many enterprises are operating with a Crste < Scale, suggesting an opportunity to optimize resource allocation or reduce the size of the enterprise effectively. This involves reconsidering the proportions of input factors and enhancing output levels. While optimizing production processes to boost efficiency, it is also essential to align the development stages of enterprises with prevailing market demands, timely adjust internal organizational structures, and enhance organizational flexibility and responsiveness.
-
Information and Logistics Management: Fishery enterprises should establish a comprehensive information management system that integrates finance, purchasing, sales, inventory, and other aspects to enable full-process digital management. At the logistics level, adopting intelligent logistics systems can help rationally plan transportation routes and schedules, reduce logistics costs, and accelerate goods turnover. Technologically, enterprises should invest in advanced hardware, such as smart sensors and drones, to monitor and manage fishing grounds, vessels, and fishing activities. Additionally, increasing research and development investment in cutting-edge technologies like the Internet of Things (IoT), big data analysis, and artificial intelligence (AI) can further improve operational efficiency. The creation of a unified data management platform and associated software tools for the integration of disparate data sources, including meteorological and marine environmental information, will facilitate the analysis of market demand trends and the guidance of fishermen in adjusting the types and quantities of fish caught to prevent market saturation and price declines. The increased application of digital tools in the fishery will facilitate interactive mechanisms among information flow, logistics, and technology.
-
Integration of Precision Agriculture in Aquaculture: To achieve sophisticated management and effective resource utilization, the principles and methodologies of precision agriculture should be integrated into regular operations. Additionally, computer simulation technologies can help assess the ecological impacts of fishing activities, thereby mitigating adverse effects on the marine environment.
Acknowledgments
This study was supported by the Humanities and Social Science Fund Project of the Ministry of Education of China (24C10426011), the Shandong Provincial Natural Science Foundation (ZR2022QG020), and the Key R&D Program (Soft Science Project) of Shandong Province (2024RKY0304). We also thank the anonymous reviewers for their valuable comments and suggestions, which have significantly improved this manuscript. We appreciate the editors for their insightful feedback and editorial handling.
Authors’ Contribution
Conceptualization: Lanlan Sun (Equal), Qingqing Jiang (Equal), Zhuming Zhao (Equal). Formal Analysis: Lanlan Sun (Equal), Lu Zhang (Equal). Funding acquisition: Lanlan Sun (Equal), Zhuming Zhao (Equal). Supervision: Lanlan Sun (Lead). Validation: Lanlan Sun (Equal), Zhuming Zhao (Equal). Writing – original draft: Lanlan Sun (Equal), Lu Zhang (Equal). Data curation: Lu Zhang (Lead). Software: Lu Zhang (Lead). Investigation: Qingqing Jiang (Equal), Zhuming Zhao (Equal). Project administration: Qingqing Jiang (Lead). Visualization: Qingqing Jiang (Lead). Writing – review & editing: Qingqing Jiang (Equal), Zhuming Zhao (Equal). Resources: Zhuming Zhao (Lead).
Competing of Interest – COPE
No competing interests were disclosed.
Informed Consent Statement
All authors and institutions have confirmed this manuscript for publication.
Data Availability Statement
All are available upon reasonable request.