


Introduction
The sea cucumber, Apostichopus japonicus (Selenka), is an epibenthic species that has long been exploited as an important fishery resource along the coast of China. Chinese consumers believe that consuming sea cucumbers improves health and prevents disease, making this species the most farmed sea cucumber with the highest value and demand in the market. Sea cucumber cultivation in ponds has become the highest-value single mariculture variety in China, with a culture area exceeding 2×10⁵ hm,1 an annual output of approximately 204,000 tons, and a value of more than $5.2 billion.2
Salinity is a critical environmental factor that affects the growth, survival, distribution, and physiological processes of marine animals.1,3,4 Abrupt salinity changes, often caused by heavy summer rainfall, can have sublethal effects on marine echinoderms, especially those in coastal waters.4,5 An increasing number of studies have characterized the acclimation responses of aquatic animals to low-salinity stress.5–7 Many studies have focused on environmental and community interactions that occur after a species is introduced into a new habitat. For population survival, organisms must undergo varying degrees of natural selection pressures. Collective adaptation to a new environment can be achieved through the gradual elimination of less fit individuals over many generations. The rate of acclimation to salinity, particularly in cultural regions, is likely to be an important modifier of salinity tolerance. Previous research has shown that sea cucumbers, as echinoderms, have limited adaptability to salinity, ranging from 26 to 39 psu.8,9 To date, the lowest salinity at which sea cucumbers can be successfully cultured in ponds is approximately 20 psu,10 which indicate that the salinity tolerance of A. japonicus from different regions or at different times is different. Large-scale production of aquaculture species must be based on adequate knowledge of its ecological requirements for optimal development. A. japonicus cultured in shallow ponds experience far greater environmental variability than those in coastal seawater. Considering the natural differences in salinity between offshore waters and mariculture ponds, it is crucial to investigate the salinity tolerance of cultured and wild A. japonicus populations. To the best of our knowledge, no study to date has compared the salinity tolerance of cultured and wild A. japonicus. The effects of salinity on the survival of pond-cultured A. japonicus have rarely been explored, but such investigations may enhance our understanding of the current sea cucumber farming industry.
Several studies have shown that stress-related biomarkers are useful tools for assessing the biological effects of environmental stress. Biomarkers such as enzyme activity (e.g., superoxide dismutase and catalase) have been demonstrated to be valuable for assessing the effects of stress conditions on organisms.11,12 RNA sequencing (RNA-seq) has been used to explore novel gene pathways and mechanisms using high-throughput techniques.13 We screened for differentially expressed genes (DEGs) under low-salinity conditions to elucidate the key pathways regulating osmosis. Although the association between enzymatic activity and the transcriptome is not always certain, establishing this link will help us to better understand the mechanisms of salinity tolerance in sea cucumbers.
The main objectives of this study were to (1) compare the salinity tolerance of sea cucumbers from different regions, (2) examine the responses of sea cucumber enzyme activity and transcriptomes to salinity, and (3) interpret the mechanisms responsible for the observed differences in salinity tolerance.
Materials and Methods
A. japonicus collection
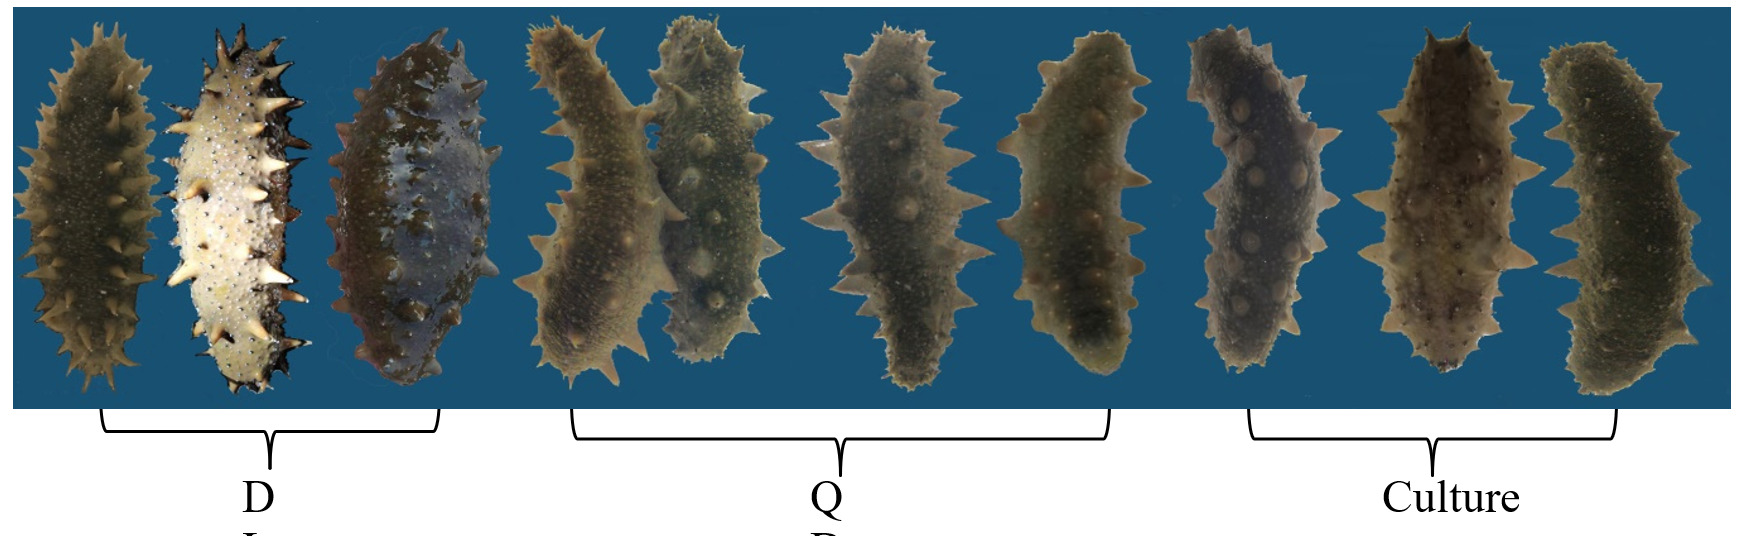
Wild populations of A. japonicus were collected from 6-7 m underwater at Tianheng Island in Qingdao (QD, 92.4± 13.2g), Shandong Province and Zhangzidao Islandin Dalian (DL, 98.5 ± 15.1g), Liaoning Province, China. Cultured sea cucumber A. japonicus (CT, 95.6 ± 9.6g) was purchased from local coastal ponds at Tianheng Island in November 2020 (Fig. 1, Fig. 2).

Sea cucumbers were immediately transported to the laboratory and temporary cultured at 15 ± 0.5 ℃, 29 ± 0.5 psu for 1 week in eight aerated 200 L plastic barrels. Background parameters of water temporarily cultured were measured during the experiment (pH: 7.9 ± 0.2, dissolved oxygen: 6.0 ± 1.0 mg/L). The water was exchanged 50% once per day by means of suction to discharge the feces of sea cucumbers. Individuals with a similar mean body weight (94.8 ± 14.4g) were selected for the study.
Survival rates and Enzyme assays
For the salinity tolerance experiment, 480 sea cucumbers were distributed in 24 rectangular translucent plastic boxes (450×300×300 mm) containing 33 L of water. Each box contained 20 sea cucumbers, with three replicates per treatment. Control conditions were maintained using sand-filtered seawater at 15.2-17.3 °C and 29.1-29.8 ppt salinity, with 50% daily water replacement. Sea cucumbers were acclimated to seven environmental salinities (17, 20, 23, 26, 35, 40, and 45 psu) by adjusting the salinity by 1-2 psu per day using dechlorinated tap water (for dilution) or artificial sea salt (for enrichment) until test salinities were reached.
Sea cucumbers were exposed to different salinities for 96 h, and their survival was monitored. Sea cucumbers were considered dead if they lost their attachment capacity and showed no shrinkage response upon contact with a glass rod. The survival rates were calculated as the number of surviving sea cucumbers after 96 h divided by the initial number of sea cucumbers.
After 24 h of exposure to the target salinity levels, three sea cucumbers from each box with mortality below 20% (20, 23, 26, 35, and 40 psu) were randomly sampled. A mixture of the digestive tract, body walls, and respiratory trees was processed immediately. Approximately 0.5 mL of fluid was extracted for enzyme activity analysis of superoxide dismutase (SOD), Na+-K+-ATPase (NKA), and catalase (CAT), while 0.5 g was homogenized for amylase (Amy) activity analysis. The remaining individuals were monitored for 96 h survival.
Enzymatic activities were analyzed using commercial kits (Nanjing Jiancheng Bioengineering Institute, Nanjing, China). The activities of SOD (EC 1.15.1.1), CAT (EC 1.11.1.6), NKA (EC 7.2.2.13), and Amy (EC 3.2.1.1) were measured as previously described.13–16
RNA isolation, library preparation, and Illumina sequencing
For each population (DL, QD, and CT), three sea cucumbers were randomly selected from 23 salinity treatment groups after 24 h. Total RNA was extracted from pooled samples of the integument, respiratory trees, and anterior intestine using TRIzol reagent (Invitrogen, Carlsbad, CA, USA) according to the manufacturer’s instructions. RNA integrity was assessed using the NanoDrop ND-2000C spectrophotometer. mRNA isolation, cDNA synthesis, and library preparation were performed by Biomarker Technologies (Beijing, China). Finally, samples from each individual and position were matched to the same population, resulting in three RNA-sequencing databases: CT (cultured sea cucumber from Qingdao), QD (wild sea cucumber from Qingdao), and DL (wild sea cucumber from Dalian).
Function Annotation and Identification of DEGs
Unigenes were annotated using homology alignments against Gene Ontology (GO) (E-value<10=5) (http: //www. geneontology.org/), Clusters of Orthologous Groups (COG) (http: //www.ncbi. nlm.nih.gov/ COG/), and Kyoto Encyclopedia of Genes and Genomes (KEGG) (http: //www. genome.jp/kegg/) databases. Genes with an adjusted significance level of P < 0.05 were considered differentially expressed. Transcription factor prediction was performed using BMKCloud (www.biocloud.net).
Validation by quantitative real-time PCR
To verify the reliability of the DEGs identified in RNA-seq expression analysis, 24 genes (Table 2), were selected for expression level validation across the three populations. These genes were primarily selected from the osmolarity regulation pathways, including protein processing in the endoplasmic reticulum (ER), phagosome, metabolism of xenobiotics by cytochrome P450 (CYP), sphingolipid metabolism, and fatty acid synthesis. Additional genes were selected from the signal transduction mechanisms, carbohydrate transport and metabolism, and lipid transport and metabolism pathways. Gene-specific primers for the DEGs were designed using the Primer Premier 5 software (Table 2). β-actin was used as the reference gene to normalize the relative expression levels. All qPCR experiments were performed with three technical and three biological replicates.
Statistical analysis
Significant differences among samples data were analyzed using SPSS 20.0 for Windows (IBM SPSS Inc., Chicago, IL, USA). One-way analysis of variance (ANOVA) was used to compare the effect of salinity on survival rates and enzyme activities (SOD, CAT, Na+-K+-ATPase, and Amy), followed by Duncan’s multiple comparison tests for post-hoc comparisons. Differences were considered to be significant at P < 0.05.
Results
The survival rate of cultured sea cucumber and wild sea cucumber at different salinity
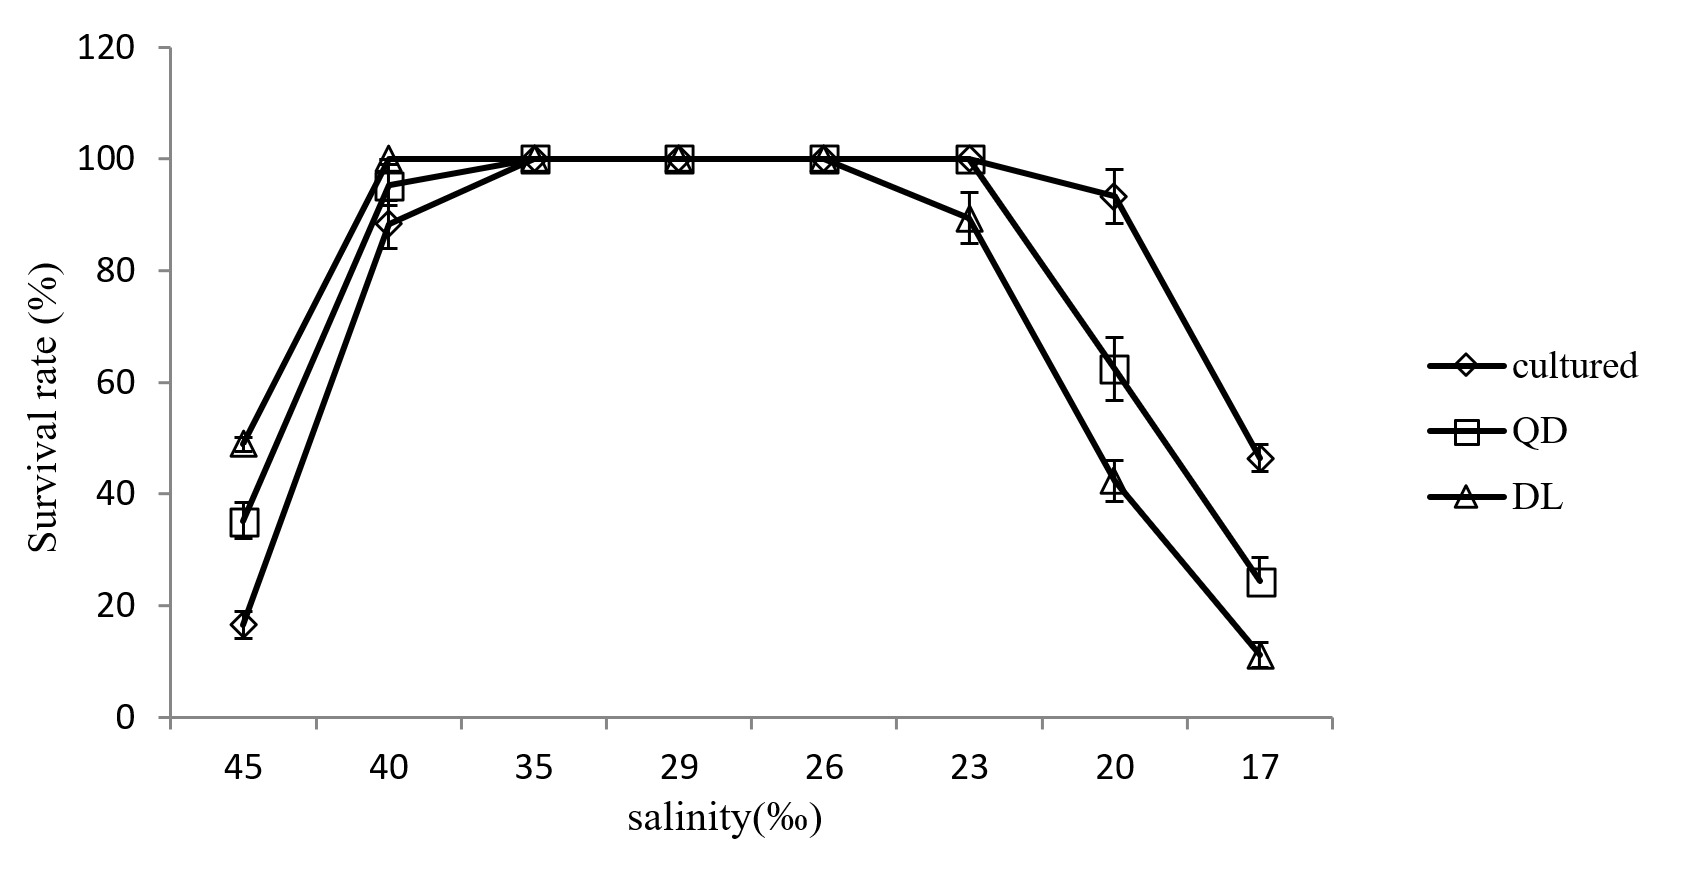
Survival rates of cultured and wild A. japonicus populations at different salinities are shown in Figure 3. No mortality was observed at 23-35 psu in the cultured population, at 26-40 psu in the DL wild population, and at 23-35 psu in the QD wild population. However, significant differences in survival rates were observed among the three populations at 45, 20, and 17 psu. Although no significant differences were observed between the QD and CT populations, both differed significantly from the DL population at 40 and 23 psu. Generally, CT sea cucumbers exhibited better tolerance to low salinity than DL and QD sea cucumbers, whereas DL and QD sea cucumbers demonstrated superior tolerance to high salinity.
Enzyme activities at different salinities
The activities of four enzymes—SOD, CAT, Amy, and NKA—exhibited an initial increase followed by a decrease with changing salinity (P < 0.05). In cultured sea cucumbers, SOD, CAT, and NKA activity increased significantly as salinity decreased from 29 to 23 psu, peaking at 23 psu. Although these enzyme activities decreased at 20 psu, they remained significantly higher than those at 29 psu. In DL and QD sea cucumbers, SOD, CAT, NKA, and Amy activities initially increased at 26 psu, but decreased at 23 psu. At 20 psu, the activities of all four enzymes were significantly lower than those at 29 psu (P < 0.05) (Fig. 4A). In the cultured population, CAT, NKA, and Amy activities first increased at 35 psu but significantly decreased at 40 psu (P < 0.05). In contrast, SOD, CAT, and NKA activities in the DL and QD populations continued to increase at 40 psu, but only decreased significantly at 45 psu. Amy enzyme activity in the QD population first increased at 35 psu before decreasing at 40 psu, whereas no significant differences were observed from 29 to 40 psu (Fig. 4B-D).
__cat_(b)__amy_(c)_and_nka_(d)_activity_of_*a._.png)
These enzymatic activity patterns suggest that the cultured A. japonicus population is more sensitive to high-salinity environments, whereas wild populations are more sensitive to low-salinity environments. This difference likely stems from the stable oceanic conditions with minimal salinity fluctuations experienced by wild organisms, in contrast to the variable salinity conditions encountered by cultured organisms owing to rainfall or water exchange in ponds.
Identification of DEGs and GO, KEGG analysis
Transcriptome analysis revealed substantial differences in gene expression after salinity stress. A total of 10,603 DEGs were identified between the DL and CT samples, including 5338 upregulated and 5265 downregulated genes; 6822 DEGs were found between the CT and QD samples, including 3500 upregulated and 3322 downregulated genes; and 7779 DEGs were found between the QD and DL samples, including 4031 upregulated and 3478 downregulated genes (FDR=0.01, FC=2, Table S1).
Venn diagram analysis showed that 1,197 DEGs were shared among the three comparisons (DL vs. CT, CT vs. QD, and QD vs. DL). Additionally, 5,123 DEGs were shared between QD vs. DL and DL vs. CT, 2,692 DEGs between QD vs. DL and CT vs. QD, and 3,009 DEGs between CT vs. QD and DL vs. CT (Fig. 5).
_among_three_.png)
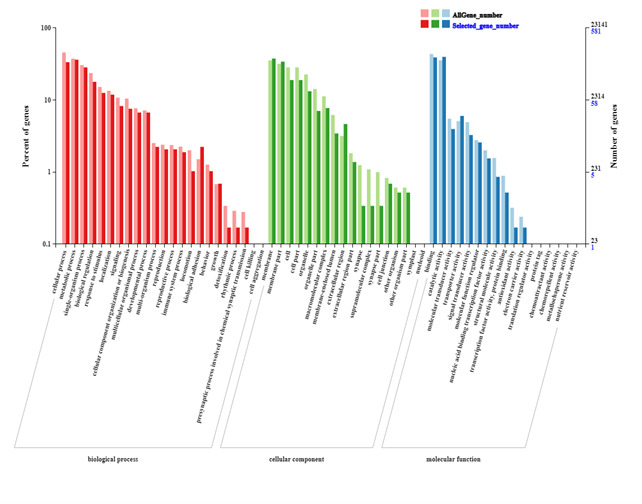
The GO functional classification of the 1,197 common DEGs selected in the Venn diagram is shown in Fig. 6. The terms “cellular process,” “membrane,” and “binding” were the most enriched terms in the biological process, cellular component, and molecular function categories, respectively. However, the classifications showing the greatest differences in gene expression were “detoxification”, “synapse,” and “antioxidant activity” in these three functional categories. (Fig. 6)
A heatmap of the DEGs among the DL, QD, and CT populations (Fig. 7A) showed diverse expression patterns, with many genes showing opposite trends between populations. KEGG pathway analysis identified 207, 167, and 194 pathways for DEGs from DL vs. CT, CT vs. QD, and QD vs. DL comparisons, respectively. Of these, 130 pathways were shared among all three comparisons, while 73 and 76 pathways were unique to one or two DEG groups, respectively. Notable shared pathways included “glycerophospholipid metabolism” and “starch and sucrose metabolism”. “Antigen processing and presentation” and “oxidative phosphorylation” were enriched in both DL vs. CT and DL vs. QD comparisons; “propanoate metabolism” and “beta-alanine metabolism” were enriched in CT vs. QD and DL vs. QD comparisons,; and “alpha-linolenic acid metabolism” and “propanoate metabolism” were enriched in DL vs. CT and CT vs. QD comparisons (Table 1, Fig. 7B). Following the low salinity challenge, 1,344 DEGs (1,014 upregulated and 330 downregulated) were identified between DL and CT, 630 DEGs (403 upregulated and 227 downregulated) between CT and QD, and 683 DEGs (497 upregulated and 186 downregulated) between QD and DL (Fig. 8).
_among_dl__qd_and_ct_populations_of_*a._japoni.png)

Validation of DEGs with qRT-PCR
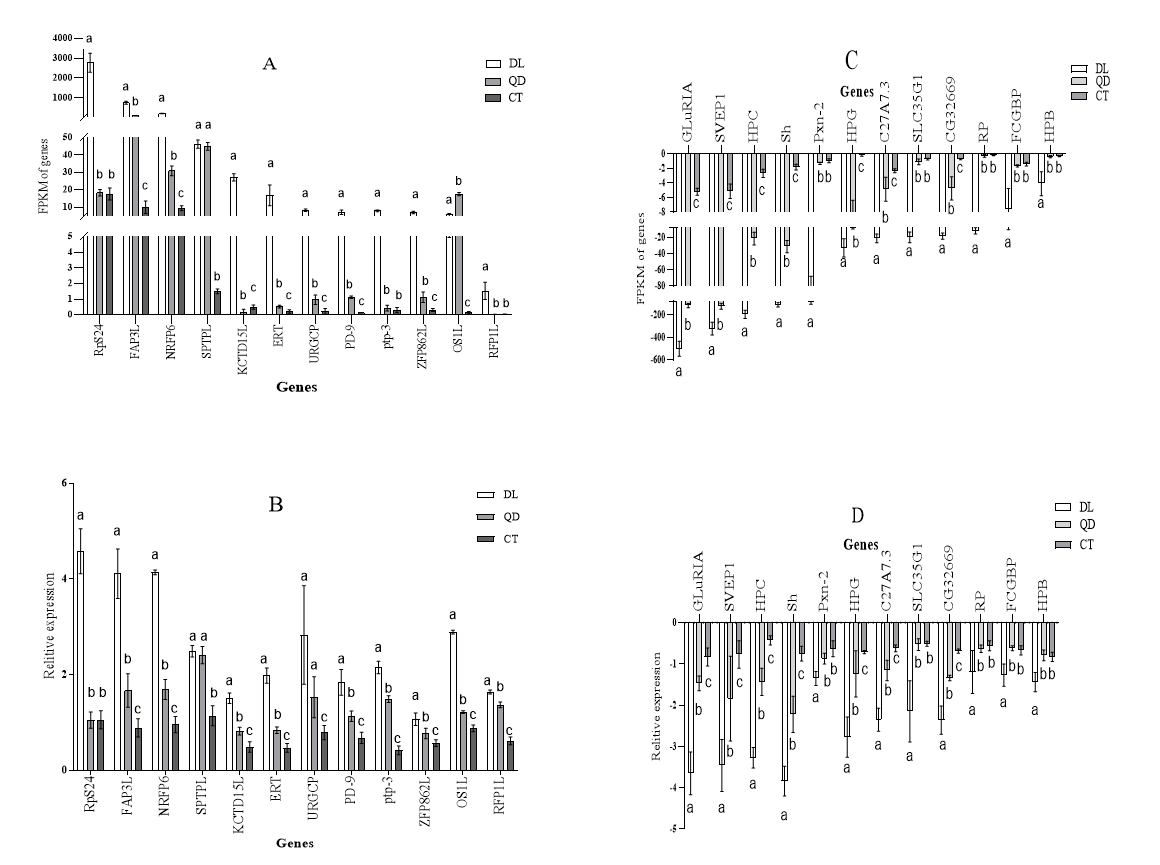
To verify the accuracy of RNA-Seq analysis, 24 DEGs involved in osmolarity metabolism were selected for quantitative PCR (qPCR) validation. Primers for the selected unigenes were designed using Primer Premier 5 software (Table 2). As shown in Fig. 9, the transcriptome data were largely consistent with the qRT-PCR results. Minor discrepancies between RT-PCR and RNA-Seq data could be attributed to differences in their sensitivity for estimating gene expression levels between the two methods.17

Discussions
Saline tolerance of the sea cucumber
Temperature and salinity are of different importance. Temperature directly determines the rate of chemical reactions and the metabolism and vitality of aquatic organisms, but salinity is generally an adaptive factor, and organisms can respond to physiological changes. In China, sea cucumber culture ponds are usually 2-3m deep, making them vulnerable to changes in environmental conditions. Water salinity in these ponds can drop below 20 psu in summer during the rainy season and during typhoons.10 The salinity tolerance of the A. japonicus population depended on the salinity experienced during the acclimation process. Dong et al. found that A. japonicus was an osmotic conformer and that the activity of NKA showed an adaptive response to changes in ambient salinity.8 The increasingly lower salinity tolerance of cultured sea cucumbers seen in our study may be due to decades of pond farming overlaid with the factory seedling culture of A. japonicus. Similar results have been reported for the abalone Haliotis diversicolorsupertexta; when salinity was increased or decreased, H. diversicolorsupertexta juveniles acclimated to seawater of 25 psu at 30 ℃ survived as 14-33 psu, and those acclimated to 35 psu at 20 ℃ survived a salinity of 20-45 psu.18 Previous studies on salinity tolerance in tilapia,19 abalone,18 yellowfin seabream and crucifix crab suggest that when an animal is gradually acclimated to the experimental conditions, the tolerance range tends to be broader.20–22 In addition, this work makes the bold prediction that, given a long enough domestication time scale, biological salinity tolerance will continually break through the survival limits, or the limits will continue to expand.
Effect of salinity changes on the related enzyme activity of sea cucumber
A. japonicus can alter their biochemical mechanisms under salinity-associated stress such as increasing their antioxidant defenses to cope with the higher oxidative stress resulting from salinity condition.23 Salinity stress induced a decrease in catalase activity.24 The α-amylase is a digestive and metabolic enzyme that catalyzes the hydrolysis of α-(1, 4) glycosidic linkages in starch and polysaccharides, etc. α-amylase activity has been reported to be lower in seeds imbibed in solution supplemented with salt than that in control solution.25 NKA is fundamental in maintaining ionic cellular homeostasis that facilitates the transfer of ions across the cell membrane via active transport,26 but salinity has severe impacts on organisms’ homeostasis and histological structure.27
We speculate that cultured A. japonicus (CT) might have a higher tolerance capacity to low salinity than wild populations (DL and QD), based on the changing trends of these four enzymatic activities. Under low-salinity conditions of 23-20 psu, the SOD, CAT, and NKA activities of the cultured population were significantly higher than those of DL and QD. Amy activity was significantly higher than that of DL and QD but was not significantly different at 23 psu. Conversely, under high salinity conditions of 40-45 psu, the enzymatic activity of CT was significantly lower than that of DL and QD, which represent sea cucumbers from wild populations. This suggests that the cultured population may have a poor ability to adapt to high-salt environments. In summary, the enzymatic activity of A. japonicus is significantly influenced by salinity. The results of different enzyme activities and survival rates in the three populations of A. japonicus demonstrate that wild organisms are expected to perform better in oceanic conditions, whereas cultivated organisms are better adapted to low salinities.
Influence of breeding environment on the salinity adaptability of A. japonicus
Adaptations to salinity may vary among different phenotypes of the same species.28 Artificial breeding and culture environment selection may increase the genotypic differences between wild and cultured sea cucumbers. In the present study, this may explain why different phenotypes of A. japonicus show different metabolic responses to varying salinities.7 Overall, this study provides insights into the different effects of salinity on the wild and breeding populations of A. japonicus. Various miRNA families have been associated with the regulation of gene expression in response to salt stress.29 To date, numerous genes have been identified to play important roles in salinity regulation, including lysozyme,30 Na+/K+-ATPase,27 Hsp70 mRNA,9 Serine proteinase inhibitor gene and carotenoids,31 calcyclin-binding protein,32 mitogen-activated protein kinase,33,34 HSP90,35 thyrotropin and corticotrophin.36 Future studies are required to identify differences in salinity-related genes among the three populations of A. japonicus.
The differences in survival salinities may reflect the fact that sea cucumbers in each area are members of physiologically distinct races that respond differently to environmental factors. Ponds are more susceptible to low salinity water due to rainfall, making it challenging to maintain high salinity levels, especially in ponds with favorable water exchange rates. Consequently, the adaptation of cultured sea cucumber strains to low-salinity conditions has facilitated the development of a pond-based sea cucumber breeding industry.
The information obtained in this study will be valuable for the further development of the A. japonicus aquaculture industry. Our improved aquaculture techniques have allowed us to expand upon the preliminary data on salinity tolerance.
Acknowledgments
The study was supported by grants from the National Natural Science Foundation of China (31972791), the Natural Science Foundation of Shandong Province (ZR2020MC192), and the “First Class Fishery Discipline” program in Shandong Province, China
Authors’ Contribution
Conceptualization: [Yuming Zhao], [Bo Liu]; Methodology: [Yuming Zhao]; Formal analysis and investigation: [Yuming Zhao], [Yanmin Su]; Writing - original draft preparation: [Yuming Zhao, Bo Liu]; Writing - review and editing: [Yanmin Su], [Feng Wang]; Funding acquisition: [Bo Liu]; Resources: [Rongjie Chen]; Supervision: [Yuming Zhao], [Rongjie Chen], [Yanmin Su].
Competing of Interest – COPE
The authors declare no conflict of interest.
Ethical Conduct Approval – IACUC
The Animal Care and Use Committee of Qingdao Agricultural University (license number: SYXK [SD] 20170005) reviewed and approved this animal study.
Informed Consent Statement
All authors and institutions have confirmed this manuscript for publication.
Data Availability Statement
All are available upon reasonable request.