


Introduction
The glucose transporter 2 (GLUT2), a member of the glucose transporter family (GLUTs), was initially discovered in the human liver and kidney, with specific expression in the liver, kidney, and small gut. Subsequent research revealed a significant presence in pancreatic islet β cells as well.1 GLUT2, characterized by its low affinity and high capacity for glucose transport, is primarily localized in the plasma membrane of epithelial cells in the aforementioned tissues, where it facilitates glucose transport.2 Currently, most studies on GLUT2 are related to mammalian diseases together with sodium-glucose cotransporter, and few studies have been conducted in aquatic animals. Terova et al.3 conducted a study on the role of GLUT2 in the European wolf bass, demonstrating that GLUT2 may be involved in facilitating glucose transport from liver glycogen degradation in liver cells during hypoxic conditions. Hall et al.4 conducted a study on the expression of GLUT2 in the liver of Atlantic cod and observed a significant correlation between liver GLUT2 expression and blood glucose levels when values for GLUT expression from all individuals were plotted against blood glucose levels. GLUT2 was also found in the kidney, gut, and liver of rainbow trout, according to some researchers.5 Martinez-Quintana et al.6 studied the expression of GLUT2 in the hepatopancreas of Litopenaeus vannamei, the results showed that the expression of GLUT2 was up-regulated in the hepatopancreas under hypoxia. These studies suggest that the function and regulatory mechanisms of GLUT2 in aquatic animals deserve further in-depth study, especially the mechanism of action under different environmental stresses.
Salinity is an important environmental factor affecting the physiological metabolism of aquatic animals. The change in salinity would affect the growth, survival, reproduction, molting, physiological metabolism, and osmotic regulation of aquatic animals.7,8 Salinity exhibits noticeable diurnal fluctuations and seasonal variations under natural conditions. Additionally, factors such as severe weather events like rainstorms and typhoons, as well as water changes in aquaculture practices, can also alter salinity levels in the water environment. This dramatic fluctuation of salinity stress can easily cause shrimp’s stress response.
In this study, we utilized RACE technology to obtain the full-length cDNA sequence of GLUT2 from P. monodon and analyzed its expression pattern during larval development, in different tissues, during molting stages, and under low-salinity stress. This study aims to offer fundamental data for investigating the regulatory mechanism underlying the response to low salt stress in P. monodon. Additionally, it contributes valuable insights for breeding for salinity tolerance of P. monodon.
Materials and Methods
Experimental animals
Specimens of P. monodon were obtained from the Shenzhen Experimental Base of the South China Sea Fisheries Research Institute. These shrimps, measuring 8 cm in length and weighing approximately 10 g, are currently being temporarily cultivated in cement ponds filled with natural seawater, maintained at a temperature of 27°C.Three male and three female shrimps were randomly selected for the study. Tissue samples were collected from the hepatopancreas, gills, heart, gut, stomach, lymph, epidermis, muscle, eyestalk ganglion, ootheca, and testis of each shrimp as appropriate. The samples from the three shrimp individuals were then pooled into a single tube, preserved in RNAlater at 4°C overnight, and subsequently stored at -80°C for future use.
During the summer breeding of P. monodon in the Shenzhen base of the South China Sea Fisheries Research Institute, samples (3 groups of parallel samples) of its larval development stages were collected, including zygote (Z), nauplius (N), zoea I (Z1), zoea II (Z2), zoea III (Z3), mysis I (M1), mysis II (M2), mysis III (M3) and postlarva stage (P). The larval development stages of P. monodon refer to the Breeding Technology of P. monodon.9 The samples were placed in RNAlater solution at 4 °C overnight and then at - 80 °C for standby.
P. monodon with a body mass of 20 ± 2g and a body length of 12 ± 1cm was selected for sampling in each stage of molting, including stage A (postmolt), C (intermolt), D (premolt), E (ecdysis).10 At each molting stage, 6 ± 1 shrimp’s hepatopancreas, gills and gut were stored in RNAlater Solution at 4 °C overnight and then stored at - 80 °C.
Healthy shrimps were randomly selected from the temporary breeding pool as experimental materials. The experiment was divided into two groups, with salinity of 30 ‰ (control group) and salinity of 3 ‰ (experimental group). Each group was provided with 3 parallel tanks, in which 300 L seawater with different salinity was added, 60 shrimps were put in each tank, and the culture temperature was 28 ± 2 °C. Throughout the duration of the experiment, deceased shrimp were retrieved from individual plastic buckets at 3-hour intervals and documented.
The salinity concentration in the experiment was achieved by mixing seawater and freshwater for aquaculture and was adjusted to the target salinity using a salinity tester (AZ8371, Hengxin, Taiwan). In the control group, three individuals with better vitality were selected, and their gill tissues, gut tissues, and hepatopancreas tissues were collected. These tissues were then mixed and uniformly preserved in RNAlater solution. At the 3rd, 6th, 12th, 24th, 48th, 72nd, and 96th hours, respectively, three individuals with better vitality during the molting interval were selected from the plastic bucket with a salinity of 3‰. The same types of tissues as those from the control group were collected, mixed, and uniformly preserved in RNAlater solution at 4°C overnight, followed by storage at -80°C.
Experimental methods
Extraction of total RNA and construction of cDNA library
According to the protocol outlined in the HiPure Fibrous RNA Plus Kit, total RNA extraction was performed on each sample. A 1:5 ratio of ten loading buffers and RNA was prepared. The purity of the total RNA was assessed through 1.5% agarose gel electrophoresis conducted at 150V for 15 minutes using a nucleic acid electrophoresis apparatus. Additionally, the integrity of the RNA was evaluated using a NanoDrop 2000 nucleic acid quantitative assay instrument. When the ratio of 260 nm/280 nm measured by the NanoDrop 2000 falls within the range of 1.8 to 2.0, and the 28s and 18s bands of the RNA samples are clearly visible without any observable drag, it suggests that the extracted total RNA is of high quality and suitable for the construction of a cDNA library and the subsequent generation of 3’ and 5’ RACE templates. Prime ScriptTMⅡReverse Transcriptase Kit kit’s method was utilized to create the cDNA library from the total RNA of the aforementioned tissues. Following the experiment, the cDNA isolated from various tissues must be suitably diluted and kept at -80 °C for standby.
cDNA cloning of PmGLUT2
The sequence was obtained from the transcriptome library of P. monodon in the laboratory, and was preliminarily named as the glucose transporter 2 (PmGLUT2) after NCBI comparison.11–14 PmGLUT2 was sent to Beijing Ruibo Xingke Guangzhou Branch for synthesis, and the sequence obtained was validated. The primers required for the experiment were designed using Primer Premier 5.0. According to SMARTer ® RACE 5 ‘/3’ Kit instructions were used to extract the complete length of the PmGLUT2 gene. The primers required in the experiment were shown in Table 1.
Bioinformatics analysis
The resultant sequence from the 3’/5’-RACE PCR clone was merged using DNAMAN 8 software to achieve the complete length of PmGLUT2. Find the open reading box with ORF Finder (https://www.ncbi.nlm.nih.gov/orffinder/). Use EMBOSS to predict amino acid sequence (http://www.bioinformatics.nl/emboss-explorer/). Use NCBI’s BLAST (https://blast.ncbi.nlm.nih.gov/Blast.cgi) tool to compares the predicted amino acid sequence with the protein database for similarity analysis. The Clustal X program was employed to compare the GLUT2 sequence of PmGLUT2 with that of the closely related L. vannamei. Utilizing ExPASy ProtParam (https://web.expasy.org/protparam/), calculate the concentrations of different amino acids, as well as their theoretical molecular weight and isoelectric point. Protein domain was analysis by using SMART4.0 (http://smart.embl-heidelberg.de/smart/set_mode.cgi?GENOMIC=1). Utilize the expected glycosylation sites from the Net NGlyc 1.0 Server (http://www.cbs.dtu.dk/services/Net NGlyc/). Utilize the predicted phosphorylation sites from NetPhos 3.1 Server (http://www.cbs.dtu.dk/services/Net Phos/). Third level structure prediction uses SWISS MODEL (https://swissmodel.expasy.org/). In order to build the system evolution tree, Cluster X and MEGA 6.0 software were both used.
Analysis of tissue differential expression and expression analysis under salinity stress
Fluorescent quantitative primer PmGLUT2-qPCR-F/R for PmGLUT2 gene expression analysis designed with Beacon Designer 7.0 software (Table 1) and used EF-1α-F/R for internal reference gene (elongation factor 1α, Gen Bank number was DQ021452).15–18 The column with a vertical axis of value 1 was used as a reference. Using the cDNA of the larval development stages, tissues and molting stages of P. monodon as the template was amplified by Quantitative real-time PCR use Roche LightCycler480II. The reaction volume was 12.5 μL, including 5.25 μL TB GreenTM Premix Ex TaqTM (Tli RNase H Plus), 0.5 μL upstream and downstream primers, 1 μL template cDNA (about 40 ng), ddH2O added to 12.5 μL. Three replicates and negative controls were set for each sample, and no template was added to the negative controls The reaction conditions included an initial denaturation step at 95℃ for 30 seconds, followed by 40 cycles of denaturation at 95℃ for 5 seconds, annealing at 60℃ for 30 seconds, and extension at 95℃ for 5 seconds. Subsequently, the temperature was raised to 95℃ at a rate of 60℃ per minute, followed by a final extension step at 50℃ for 8 minutes. PmGLUT2-qPCR-F/R and EF-1α-F/R were used to analyze the expression of PmGLUT2 under salinity stress (Table 1).
Statistical analysis
Quantitative real-time PCR data were analyzed using the relative Ct method (2–ΔΔCt), and statistical analysis was conducted using One-Way ANOVA with the Tukey post-hoc test in SPSS 24.0 software. A significance level of P<0.05 was used to determine statistical significance.
Results
PmGLUT2 sequence analysis
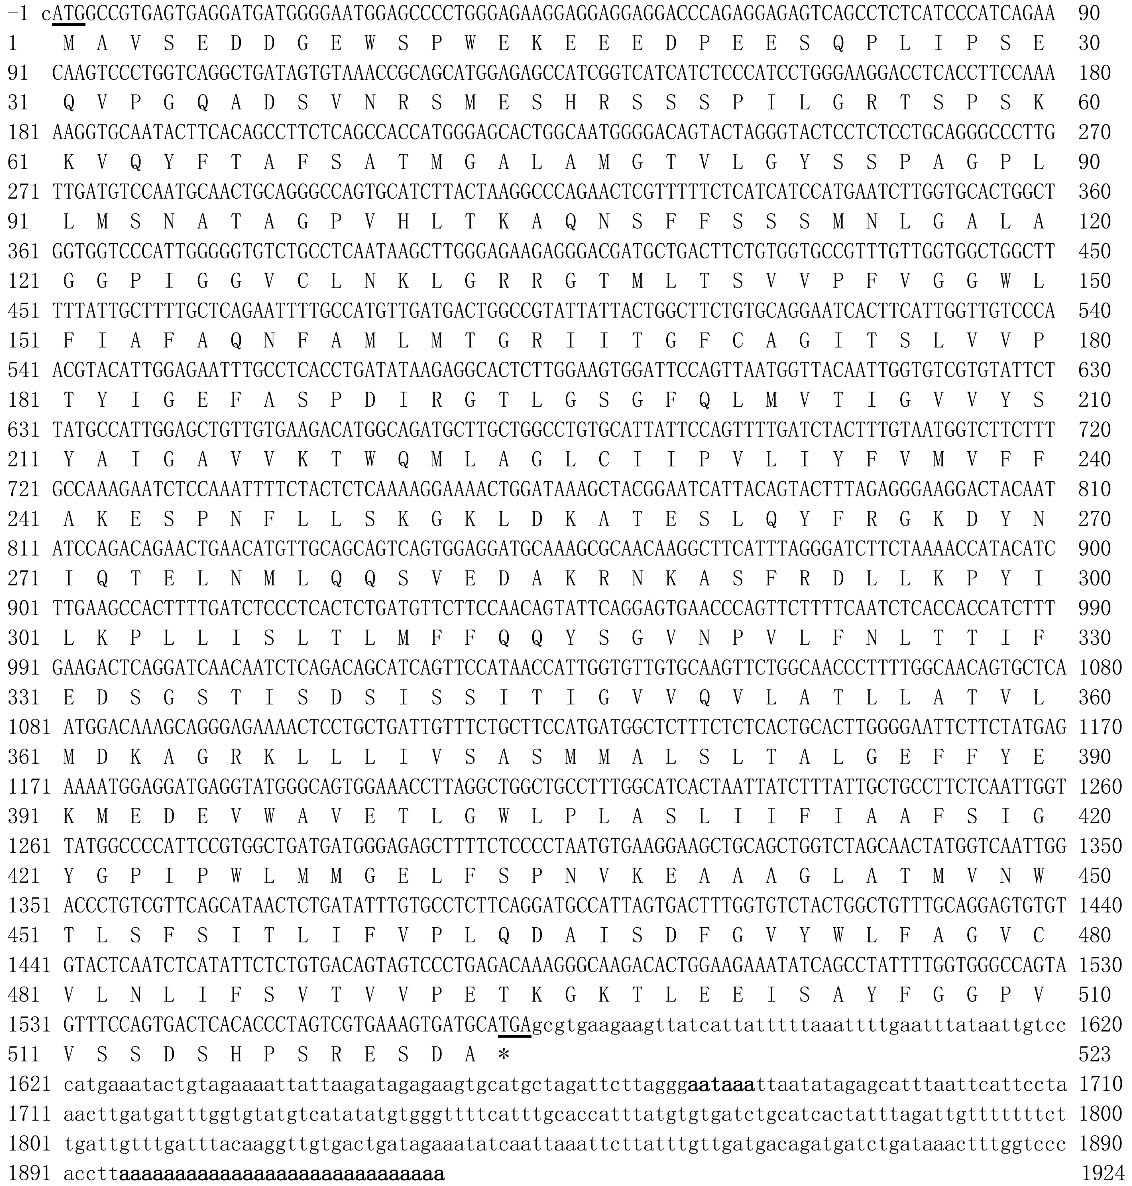
The full length of PmGLUT2 cDNA was obtained by cloning, and the GenBank login number was MK094070. PmGLUT2 had a total length of 2018 bp, a 5’ UTR of 94 bp, a 3’ UTR of 352 bp, including 29 base poly (A) tails, an open reading frame (ORF) of 1572 bp, and can encode 523 amino acids (Figure 1). ExPASy ProtParam predicted that its molecular weight was 56.568 kD and its theoretical isoelectric point was 4.96. NetPhos 3.1 Server predicted that it contains 55 phosphorylation sites (including 37 serine sites, 15 threonine sites and 3 tyrosine sites), NetNGlyc 1.0 Server predicted that it contains 4 N-glycosylation sites, and SignalP-5.0 predicted that this sequence does not contain signal peptide. SMART 4.0 predicts that PmGLUT2 had 12 transmembrane domains (Figure 1), including a glucose (and other small molecule carbohydrates) transport functional domain located at 54~506 aa.

Homology analysis
The amino acid sequence of PmGLUT2 was analyzed for homology with GLUT2 in NCBI BLAST, revealing a high degree of similarity with that of P. vannamei. The three-dimensional structure of the protein was constructed using SWISS-MODEL, which was similar to the three-dimensional structure of L. vannamei GLUT2 (Figure 2). Using Cluster X software, protein sequence comparisons were made between the GLUT2 amino acid sequence of L. vannamei retrieved from NCBI and PmGLUT2 amino acid sequence. The results showed that the GLUT2 of P. monodon and L. vannamei (AIT97017.1) were relatively conservative, with a homology of 60.54% (Figure 3). Utilizing MEGA 6.06 software and employing the NJ (Neighbor Joining) method, a phylogenetic tree was constructed for PmGLUT2 and L. vannamei through 1000 iterations with the Bootstrap method (Figure 4). Within the group, the glucose transporter GLUT2 of P. monodon and the trehalose-promoting transporter Tret1 of L. vannamei were grouped together in a distinct branch, which subsequently clustered with the GLUT2 of L. vannamei.


Analysis of PmGLUT2 expression during larval development
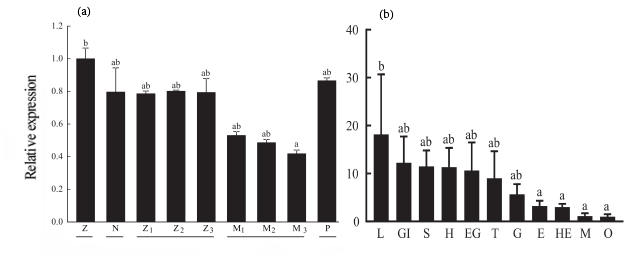
The expression of PmGLUT2 in each stage of the larval development of P. monodon was detected. From the zygote to the postlarvae stage, the expression of PmGLUT2 decreased first and then increased, but there was no significant difference (Figure 5).

PmGLUT2 tissue expression analysis
The expression of PmGLUT2 in various tissues of P. monodon was detected. PmGLUT2 was expressed in all tissues of P. monodon (Figure 5), with the highest expression level in lymph tissue, followed by a higher expression level in gill tissue, about 12 times that in muscle, and a lower expression level in muscle and ootheca.
Analysis of PmGLUT2 expression in different stages of molting
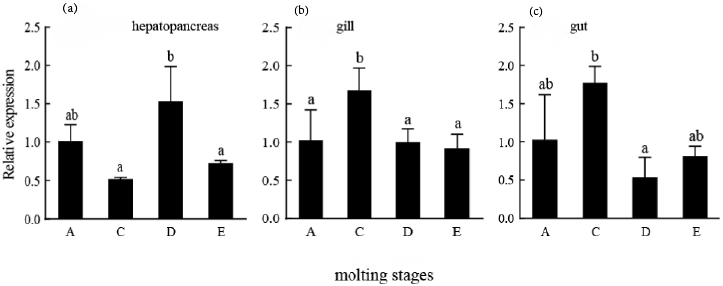
The expression of PmGLUT2 in each stage of the molting of P. monodon was detected. The expression of PmGLUT2 in the hepatopancreas was the highest in the premolt and the lowest in the intermolt. The expression of PmGLUT2 in gills was the highest in intermolt, which was significantly different from that in premolt, ecdysis and postmolt (P<0.05). The expression of PmGLUT2 in the gut was the highest in the intermolt and the lowest in the premolt and then increased gradually (Figure 6).

Expression analysis of PmGLUT2 under salinity stress
The relative expression of PmGLUT2 in hepatopancreas, gill, and gut tissues of P. monodon under salinity stress was studied by qRT-PCR. In the experiment of the salinity acute stress group, the expression of PmGLUT2 in hepatopancreas, gills, and gut tissues is shown in Figure 7. The expression of PmGLUT2 in hepatopancreas decreased significantly at the 3rd hour, which was significantly different from the control group (P<0.05). The expression remained low at the 72nd hour and then increased at the 96th hour, which was no significant difference from the control group. The expression of PmGLUT2 in gills decreased significantly at the 3rd hour, which was significantly different from that in the control group (P<0.05). Subsequently, the expression level fluctuated at a low level, and there was no significant difference. The expression of PmGLUT2 in the gut did not change significantly in the first 24 hours but increased significantly at the 48th and 72nd hours (P<0.05) and then decreased at the 96th hour, showing no significant difference compared with the control group.

Discussion
The expression of PmGLUT2 decreased while P. monodon larvae developed, then slightly increased up to the larval stage. However, PmGLUT2 expression was typically low at all phases, it could be due to the fact that the nauplius stage’s nourishment came entirely from the yolk, the larva’s digestive and absorption systems were imperfect, preventing it from feeding, and there was less glucose absorbed and transported.2 At the larval stage, the expression level begins to rise as the digestive organs gradually mature, begin to feed on benthos, and begin to get small molecule carbohydrates like glucose from food.
The investigation of PmGLUT2 expression across various tissues revealed its presence in a diverse range of tissue types. Notably, PmGLUT2 was highly expressed in the lymph, gills, stomach, and gut, suggesting that these tissues are particularly active in glucose transport or absorption. Shrimp lymph is their immunological system, the gill is the tissue responsible for excretion into the environment, gas exchange, and ion transport. The organs responsible for digestion and absorption include the stomach and gut, while the lymph and gill play a crucial role in the transportation of glucose for energy production. Additionally, the stomach and gut serve as the main locations for glucose absorption. The differential expression of GLUT2 across various tissues suggested a potential regulatory function in the immune response, digestion, and nutrient absorption processes of P. monodon.
The hepatopancreas, gills, and gut were selected for a molting expression study to substantiate the connection between PmGLUT2 and the molting process in P. monodon. The findings demonstrated that PmGLUT2 expression was highest in the hepatopancreas at the premolt stage and highest in the gills and gut at the intermolt. Intermolt is a period of rapid development and eating for shrimp, characterized by high activity, robust respiration and excretion, robust digesting and absorption, and elevated PmGLUT2 expression in the gills and guts. The expression of the gut tends to increase in the ecdysis stage, which may be connected to the peritrophic membrane’s repair and energy supply.19
Based on the results of the experiment conducted under acute low salinity stress conditions, it was observed that the expression of PmGLUT2 was downregulated in the hepatopancreas and gills, while showing an increasing trend in the gut over time. The primary function of GLUT2 is to facilitate the absorption and transportation of glucose, suggesting that the inhibition of PmGLUT2 expression in response to acute low salinity stress may be linked to a potential decrease in feeding behavior in P. monodon.2 Fluctuations in salinity levels have been shown to impact the feeding behavior of shrimp, potentially leading to reduced energy intake and subsequent limitations in energy supply.20 To sustain essential life functions, shrimp may enhance glucose absorption efficiency by modulating the expression of glucose transporters, such as GLUT2, in the gut to meet energy demands. Further experimental investigations and thorough analysis are necessary to accurately elucidate the underlying link between reduced shrimp feeding behavior and heightened expression of GLUT2 in the gut. L.vannamei’s immune system was examined by Liu et al21 in relation to salinity changes. The findings indicated a significant decrease in the blood cell count of L. vannamei within 24 hours of a salinity change, with subsequent stabilization after one day. A positive correlation with salinity was observed. Additionally, cytophagy rate, hemolymph phenoloxidase, lysobacteriolytic activity, and α2-macroglobulin activity exhibited peak changes within three days. Salinity changes demonstrated both positive and negative correlations. By day three, the immunity of L. vannamei had returned to baseline levels. The study demonstrated a significant decrease in the immunity of L. vannamei in response to rapid salinity changes, with a notable dose-dependent effect. Subsequently, a gradual immune recovery process was observed, suggesting that the prawn exhibits a capacity for immunomodulatory adaptation to fluctuations in salinity. Furthermore, this immune adaptation displayed a distinct temporal regularity, with peak recovery occurring after a period of three days.21 At the 72nd and 48th hours, respectively, the expression of GLUT2 in the hepatopancreas and gut increased, which may be connected to its adaptation to low salinity immunoregulation. Our study revealed that the expression of GLUT2 was altered under salinity stress, offering valuable insights for future research. Further, more rigorous experiments were needed to confirm the specific mechanisms and patterns of GLUT2 modulation in response to salinity stress. The observed alterations suggested a potential association between GLUT2 and salinity stress, highlighting its significance as a key gene in the response to such environmental factors.
The intricate physiological and metabolic mechanisms of aquatic organisms may involve the combined influence of various genes and pathways under salt stress conditions. Furthermore, factors beyond salinity, such as temperature and dissolved oxygen levels, could also impact the physiological responses and gene regulation in P. monodon. These studies would help reveal the molecular mechanisms of low salt tolerance in P. monodon and provide theoretical support for the sustainable development of aquaculture.22–24
Conclusions
The amino acid sequence analysis revealed that PmGLUT2 lacks a signal peptide and has a transmembrane transport functional domain. The PmGLUT2 gene is widely expressed in tissues of P. monodon and is highly expressed in lymphocytes and gills. PmGLUT2 is related to the molting and low salinity stress response of P. monodon. Investigating the response of P. monodon to low salt stress is crucial for elucidating the mechanisms underlying low salt tolerance. This study also aims to identify and develop new P. monodon varieties with improved salt tolerance, thereby informing and enhancing production practices.
Author Contributions
Data curation: Yundong Li (Equal), Song Jiang (Equal), Qibin Yang (Equal), Lishi Yang (Equal). Software: Yundong Li (Lead). Writing – original draft: Yundong Li (Lead). Writing – review & editing: Yundong Li (Equal), Wenwen Zhang (Equal), Peng He (Equal), Qibin Yang (Equal), Lishi Yang (Equal), Jianhua Huang (Equal), Falin Zhou (Equal). Investigation: Wenwen Zhang (Equal), Peng He (Equal), Jianhua Huang (Equal). Methodology: Song Jiang (Equal), Qibin Yang (Equal), Lishi Yang (Equal). Conceptualization: Falin Zhou (Lead).
Funding
This research was funded by National Key R & D Program of China (2022YFD2401900, 2022YFD2400104); Central Public-interest Scientific Institution Basal Research Fund, CAFS (2023TD34); China Agriculture Research System (CARS-48); Guangdong Basic and Applied Basic Research Foundation (2023A1515012410); Hainan Provincial Natural Science Foundation of China (323MS127); Project funded by China Postdoctoral Science Foundation (2023T160178); Earmarked fund for HNARS (HNARS-10-ZJ01) and Central Public-interest Scientific Institution Basal Research Fund, South China Sea Fisheries Research Institute, CAFS (NO. 2024RC06).
Data Availability
Not applicable.
Ethics approval
The Animal Care and Use Committee approved the use of all the shrimps in these experiments at the Chinese Academy of Fishery Sciences (CAFS), and we also applied the national and institutional guidelines for the care and use of laboratory animals at the CAFS.
Competing interests
The authors report no conflict of interest.