

Introduction
Transcriptome sequencing is a robust approach to study the function of know and predicted genes, which can greatly contribute to obtain the expression information of cells or tissues of species of interest in a certain state at the transcriptional level.1–3 By analyzing the obtained transcriptome sequencing data, we can explore the unknown genes and their expression levels, functional annotation, expression differences and molecular markers screening.4–7 The muscle is an important component of the animal body, accounting for about 30%-40% of the body weight and playing an important physiological role in the growth and development from hatchings to juveniles to adults.8,9 Animal muscle development is influenced by many factors, such as nutritional status, age, feeding style, environmental changes and genetic factors. Among them, gene, as a major factor affecting the growth and development of skeletal muscle in animals, has attracted great attention from many researchers. At present, transcriptome sequencing technology has been used to study the development of skeletal muscle in many species.10 Wang et al. conducted transcriptomic analysis of the muscle tissue of Furui Cyprini 2 with different growth rates.11 A total of 749 differentially expressed genes were identified, of which mb, myl2b, tnni1, fhl1, lamb3 and pdk2 were found to be key genes related to muscle growth. Fan et al. obtained 10,552 differentially expressed genes (DEGs) from Lateolabrax maculatus, and screened out some genes related to muscle growth and development, such as igfbp1, mstn and ghr1.12 Li et al. carried out the research on screening key candidate genes for muscle growth of Coregonus ussurinsis (C. ussurinsis) based on transcriptome sequencing, and found 10 key candidate genes that may be related to muscle growth of C. ussurinsis.13
Andrias davidianus (Chinese Giant Salamander, CGS) belongs to the Amphibia class, Anura order, and Cryptobranchiaceae family. It is the largest existing amphibian in the world and has been called a “living fossil”, often referred to as “baby fish”. Currently, wild individuals have been defined as a national class II wildlife protected animals in China. However, unfortunately for CGS, due to its delicacy, high economic, medicinal, and edible value, it is often the target of illegal hunting.14,15 Given the recent progress in breaking through the artificial breeding bottleneck of the Chinese giant salamander (CGS), it has become the focus of characteristic agricultural cultivars and provides high-quality aquatic animal protein for human consumption. The aquaculture of CGS is also listed as a key project for agricultural industrialization in many places in China. However, the individuals of different size are often found in the same breeding environment condition. This phenomenon seriously restricts the economic benefits of farmers. As far as we know, the muscle growth and development of CGS directly affect its total mass and body weight. However, research on the transcriptome related to the growth and development of skeletal muscle is still poorly understood in CGS. Therefore, identifying genes involved in regulating skeletal muscle growth and development in CGS is becoming an urgent research topic. In our study, transcriptome sequencing was carried out on muscle tissues of CGS at different growth stages under the same culture environment to study their differences at the transcriptome level. Our aim is to identify DEGs and their signaling pathways related to skeletal muscle growth in CGS. This finding presents valuable genetic resources for further study on gene expression regulation in CGS and practical information for further understanding of amphibian skeletal muscle transcript profile and development on a genomic scale.
Materials and Methods
Experimental animals and sample collection
The artificial rearing CGS without apparent injury on the body surface were obtained from a commercial farming company (Jiyuan, China). The muscle samples were collected respectively from five different growth stages (year 0.5, 0.5Y; year 1, 1Y; year 2, 2Y; year 3, 3Y; year 4, 4Y) of CGS with ~8 cm, ~15 cm, ~25 cm, ~35 cm, and ~45 cm in length. For each year stage, three A. davidianus muscle tissues were sampled. All collected samples were frozen quickly in liquid nitrogen and stored at -80℃ for later use. All experiments conducted in this study adhered strictly to the guidelines set forth by the Institutional Animal Care and Use Committee and the Experimental Animal Ethics Committee of Henan University of Science and Technology (HAUST-024-F1218009).
Construction of cDNA library and sequencing
Total RNA was extracted from the muscle tissue utilizing the TRIzol Reagent Kit (Takara, Dalian), and the integrity of the RNA bands was assessed through 1% agarose gel electrophoresis. And then, a Nanodrop 2000 spectrophotometer was used to assess the purity of RNA products (Thermo Fisher Scientific, USA). After verification of quality, mRNA was selectively enriched and isolated using magnetic beads with Oligo (dT) to reverse transcription and fragmentation for the subsequent cDNA library construction from five different CGS muscle samples. The cDNA libraries were constructed by LC-BIO and sequenced using the Illumina 4000 sequencing platform with a strategy of paired-end 150 bp (Hangzhou, China). All sequencing raw data from five libraries are available in Sequence Read Archive (SRA) database with the accession number (PRJNA1049578).
Quality control and transcriptome assembly
The Fastp software is utilized to filter raw data obtained from sequencing by removing sequences containing adapter sequences, N proportion exceeding 5%, all A bases, and low-quality sequences (defined as less than 20 nts comprising over 50% of the sequencing reads). This processing procedure generates high-quality reads, commonly known as clean reads, which are well-suited for subsequent data analysis. Next, Trinity software (v2.8.6) was used to construct the non-redundant transcripts by de novo assembly and forecast the open reading frame (ORF).
Analysis and functional annotation of DEGs
The assembled unigenes were assessed for gene expression levels utilizing the Fragments Per Kilobase of transcript per Million mapped reads (FPKM) method in order to compare DEGs between multiple samples. The 0.5Y group served as the control group, while the other groups represented different age-related growth stages. DEGs were screened using DEGSeq2 with a threshold of FDR (false discovery rate) < 0.01, q < 0.05, and |log2(fold change) | ≥ 1. An internal Perl script is utilized to identify ORF through alignment with Nr database. TransDecoder (http://TransDecoder.sourceforge.net/) is used for the prediction of putative ORFs in sequencing data that do not align with the database. Furthermore, the unigenes were aligned against the Nr, Swiss-Prot, GO, KEGG, and COG databases for gene annotations. Additionally, MISA online software was used for SSR identification.
Real-time qPCR verification of candidate DEGs
Based on transcriptome sequencing data, DEGs associated with muscle development were selected for validation through real-time qPCR. This step served to verify the reliability of the sequencing data. According to the gene sequence of the transcriptome, primers were designed and synthesized by Sangon Biotech Co., Ltd (Shanghai, China) (Table 1). First, the total RNA was reverse transcribed into cDNA using Primescript kit (Takara, Dalian). The expression levels of differentially expressed genes were detected using the BIO-RAD CFX Connect Real-Time PCR system (Bio-rad, USA). The reaction volume for qPCR is 20 µL. The reaction conditions were as follows: pre-denaturation at 95 °C for 1 min; 40 cycles of 95 °C for 30 s and 60 °C for 15 s; one cycle of 95 °C for 30 s, 60 °C for 1 min, and 95 °C for 30 s. All samples were analyzed in triplicate, and the relative expression was calculated by the 2−ΔΔCt method. β-actin was used as the internal reference gene for the normalization control.
Data statistical analysis
Excel 2016 software is used for data processing, and then SPSS 20.0 software is used for T-test analysis or One-way ANOVA. P<0.05 indicates significant difference. Data is presented as mean ± SD.
Results
Analysis and assembly of transcriptome sequences
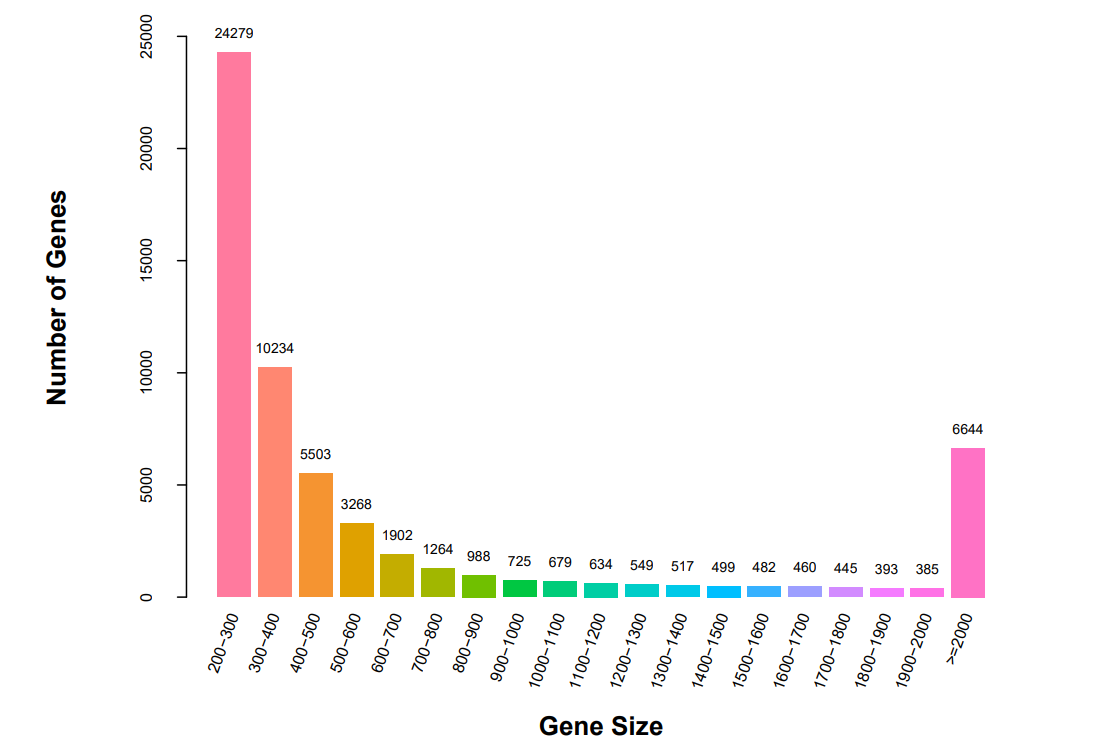
A comparative transcriptome analysis was performed on muscle tissues from five different developmental stages of CGS. It was found that all 15 samples produced raw reads ranging between 86,517,924 and 94,455,358. After removing the low-quality sequences, the high-quality clean reads ranged from 85,159,684 to 92,812,044. Furthermore, the Q30 of the sequencing data for each sample ranged from 94.47% to 95.35%, while the average GC content varied from 48.79% to 50.80%. The results showed that the sequencing data were suitable for further bioinformatics analysis. Finally, a total of 59,850 unigenes were obtained by de novo sequence assembly. Their length ranges from 201 to 96,350 bp, with an average length of 346 bp, of which 6,644 unigenes were ≥2000 bp (Fig. 1).

Functional Annotation of Unigenes
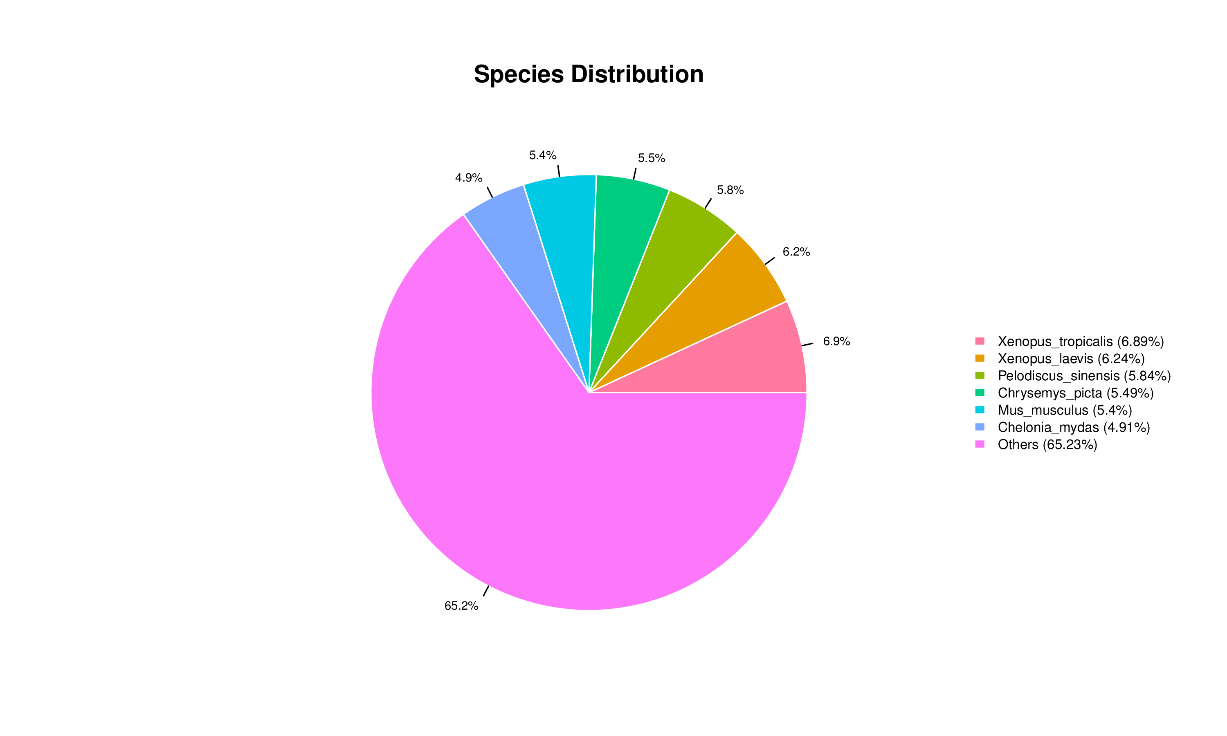
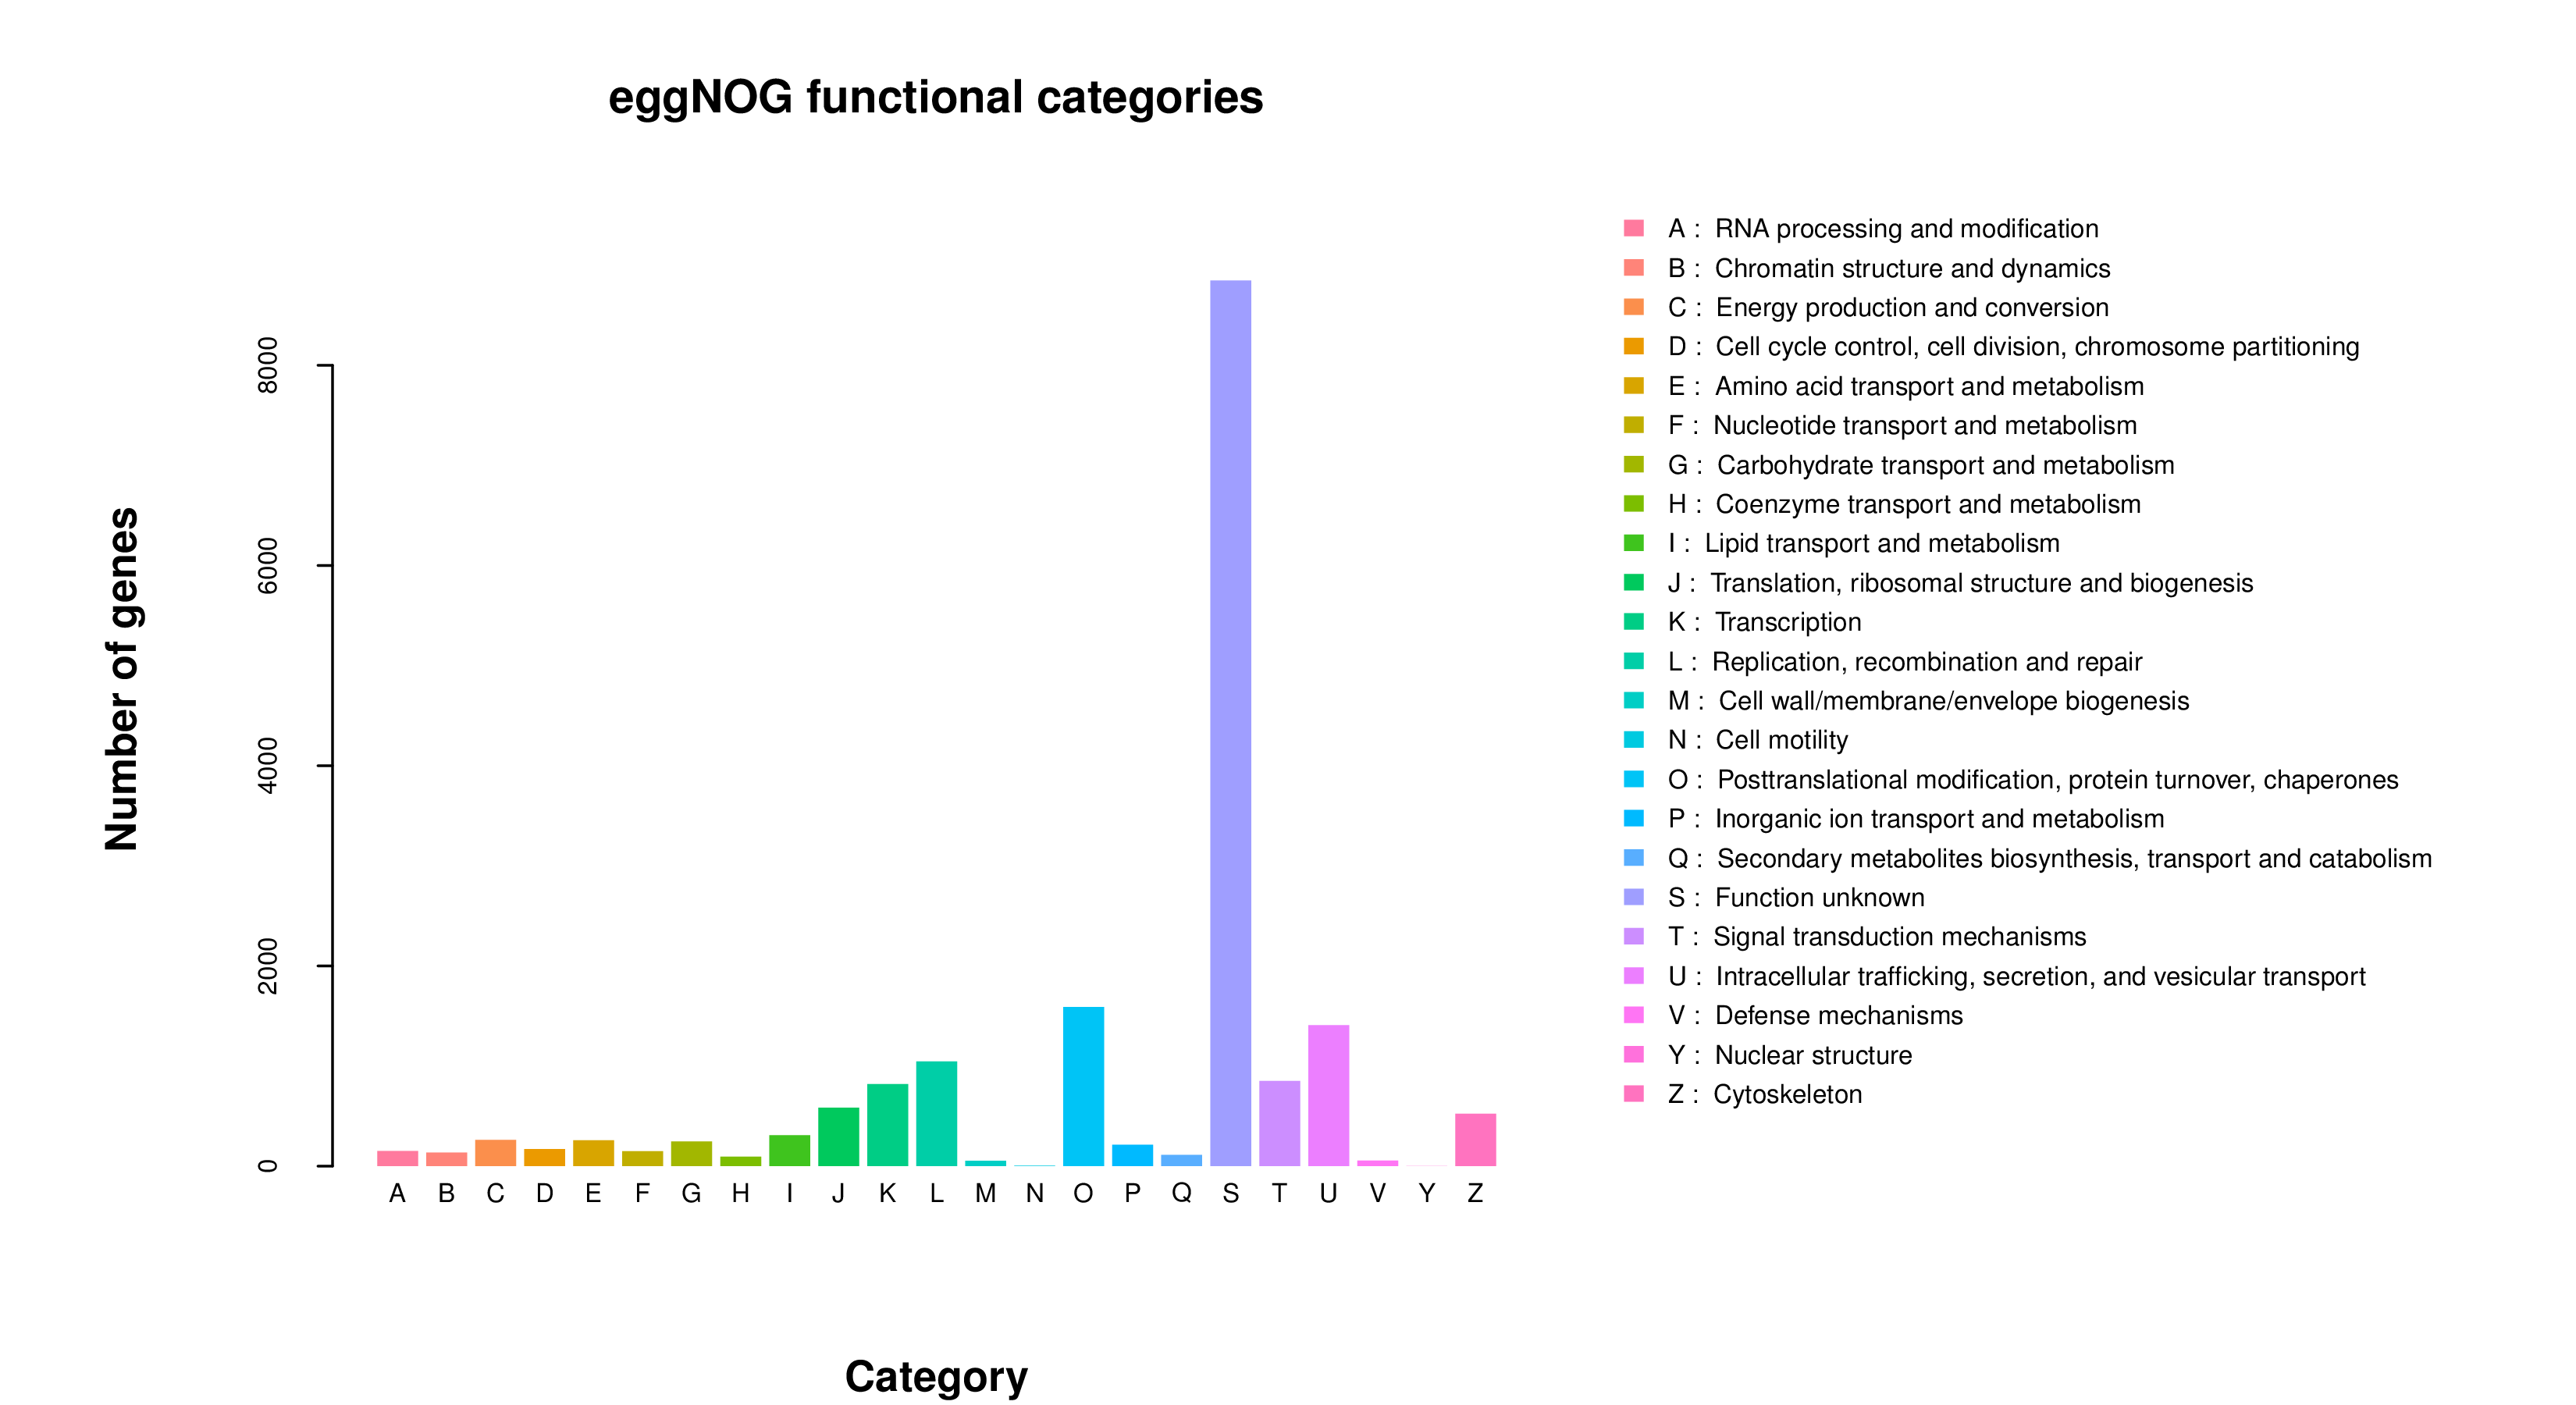
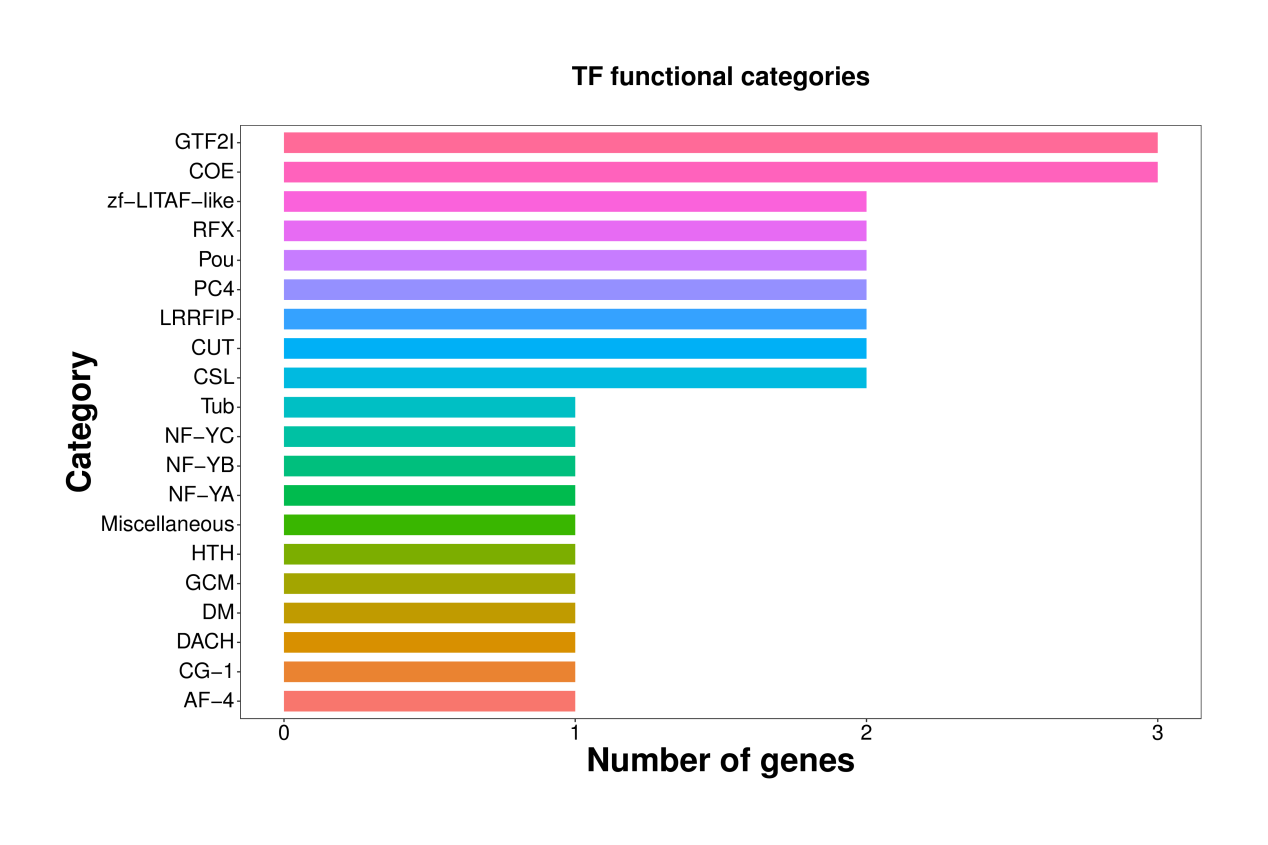
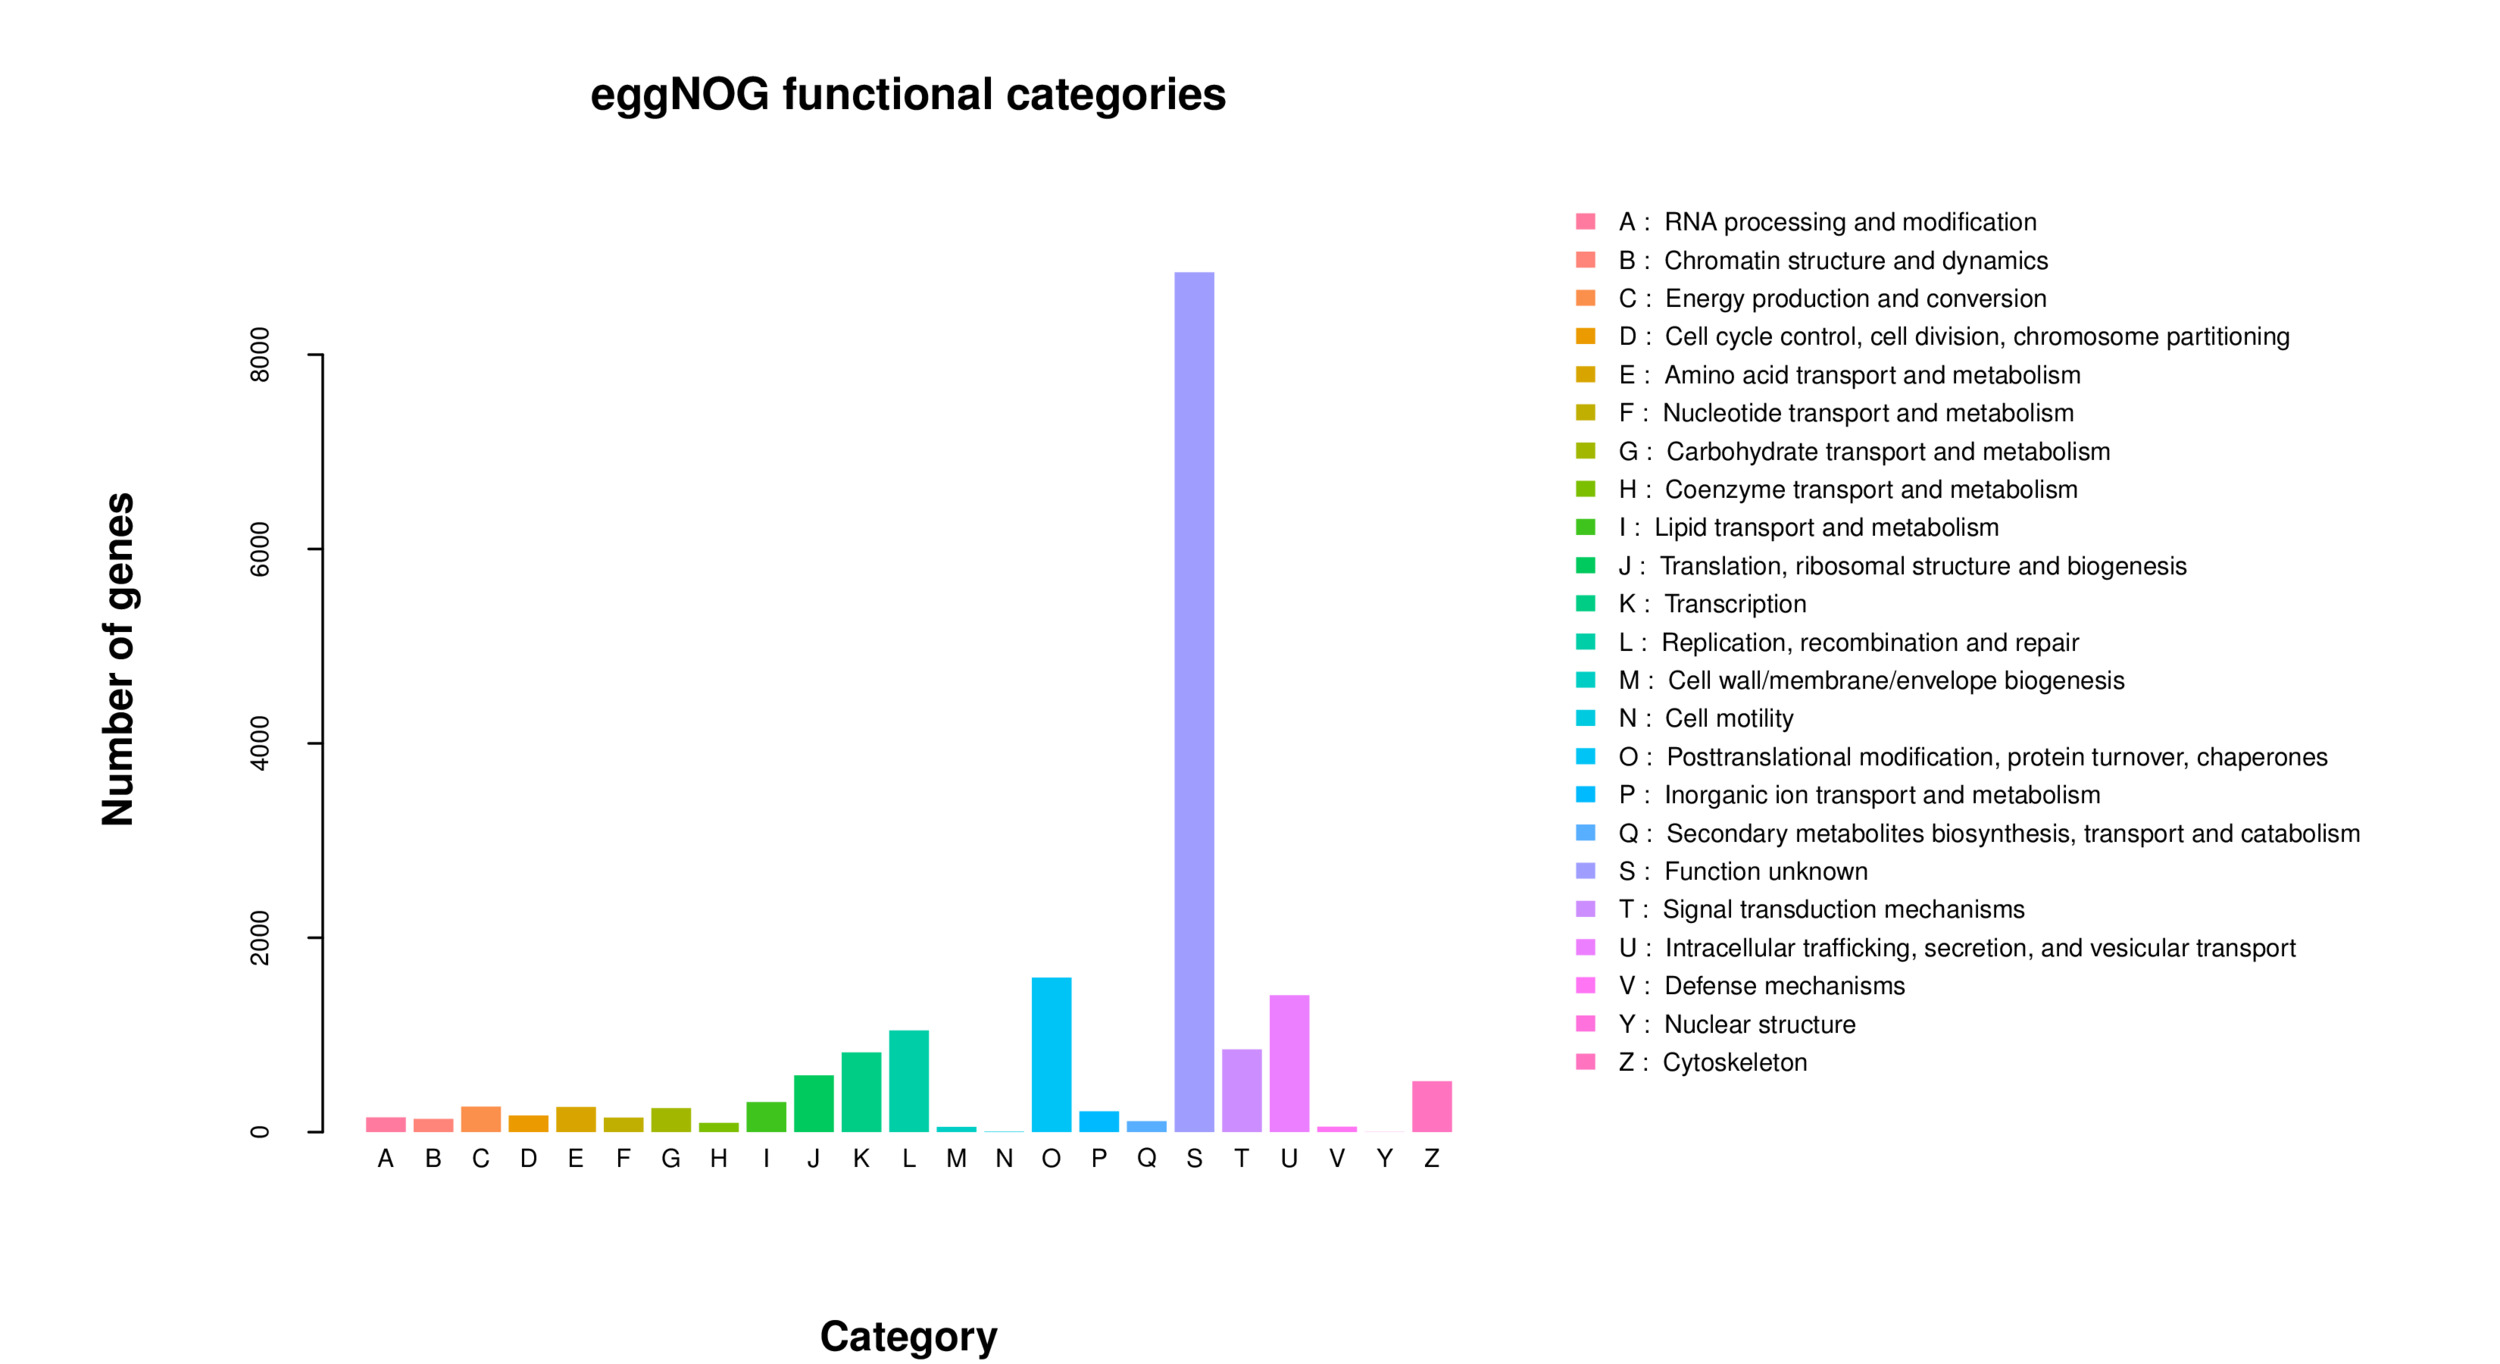
All 59,850 unigenes were aligned with the Nr, TF, Swiss-Prot, Pfam, eggNOG, GO, and KEGG databases, respectively. The results are shown in Table 2. There are 20,710, 1,522, 13,857, and 14,016 unigenes that were annotated into the Nr, TF, Swiss-Prot, and Pfam databases, respectively. Among these, the annotated unigenes in the Nr database constituted 34.60% of all unigenes, with the highest similarity in Xenopus tropicalis (6.89%), followed by Xenopus laevis (6.89%), Pelodiscus sinensis (5.84%), Chrysemys picta (5.49%), Mus musculus (5.40%), and Chelonia mydas (4.91%) (Fig. 2). A total of 1,459 unigenes were annotated across seven different databases, representing 2.40% of all unigenes. Additionally, a total of 20,348 unigenes were successfully annotated in at least one public database, representing 33.96% of all unigenes. The remaining unannotated unigenes may represent novel A. davidianus species-specific genes. Functional classification based on COG annotation using the eggNOG database revealed 23 functional categories (Fig. 3). Among the annotated unigenes, the largest number of annotated genes were classified as “function unknown” (8,904 unigenes), followed by “posttranslational modification, protein turnover, chaperones” (1,839 unigenes), and “intracellular trafficking, secretion, and vesicular transport” (1,798 unigenes). Additionally, considering the key role of transcription factors in gene expression regulation, transcription factors involved in muscle growth of CGS were also analyzed. The findings indicated that a total of 63 transcription factors belonging to 20 different families were predicted, with GTF2I and COE identified as the main ones (Fig. 4).


Identification and prediction of coding sequence
Alignment of the assembled transcriptome sequences against the Nr database revealed that 20,710 unigenes contained ORFs. The length of ORFs ranged from 336 to 3,547 bp, with an average length of 764.54 bp. Among these unigenes, part of unigenes (4,783) exhibited less than 80% ORF integrity. In contrast, only 4,441 and 8,434 unigenes were predicted to have ORF integrity of 93% and 100%, respectively. As for the unannotated sequences, the TransDecoder software is used to detect potential ORFs. The results showed that there were 17,658 unigenes containing ORFs, with an average length of 414.65 bp, and the minimum and maximum lengths were 247 bp and 3,157 bp, respectively.
SSRs detection analysis
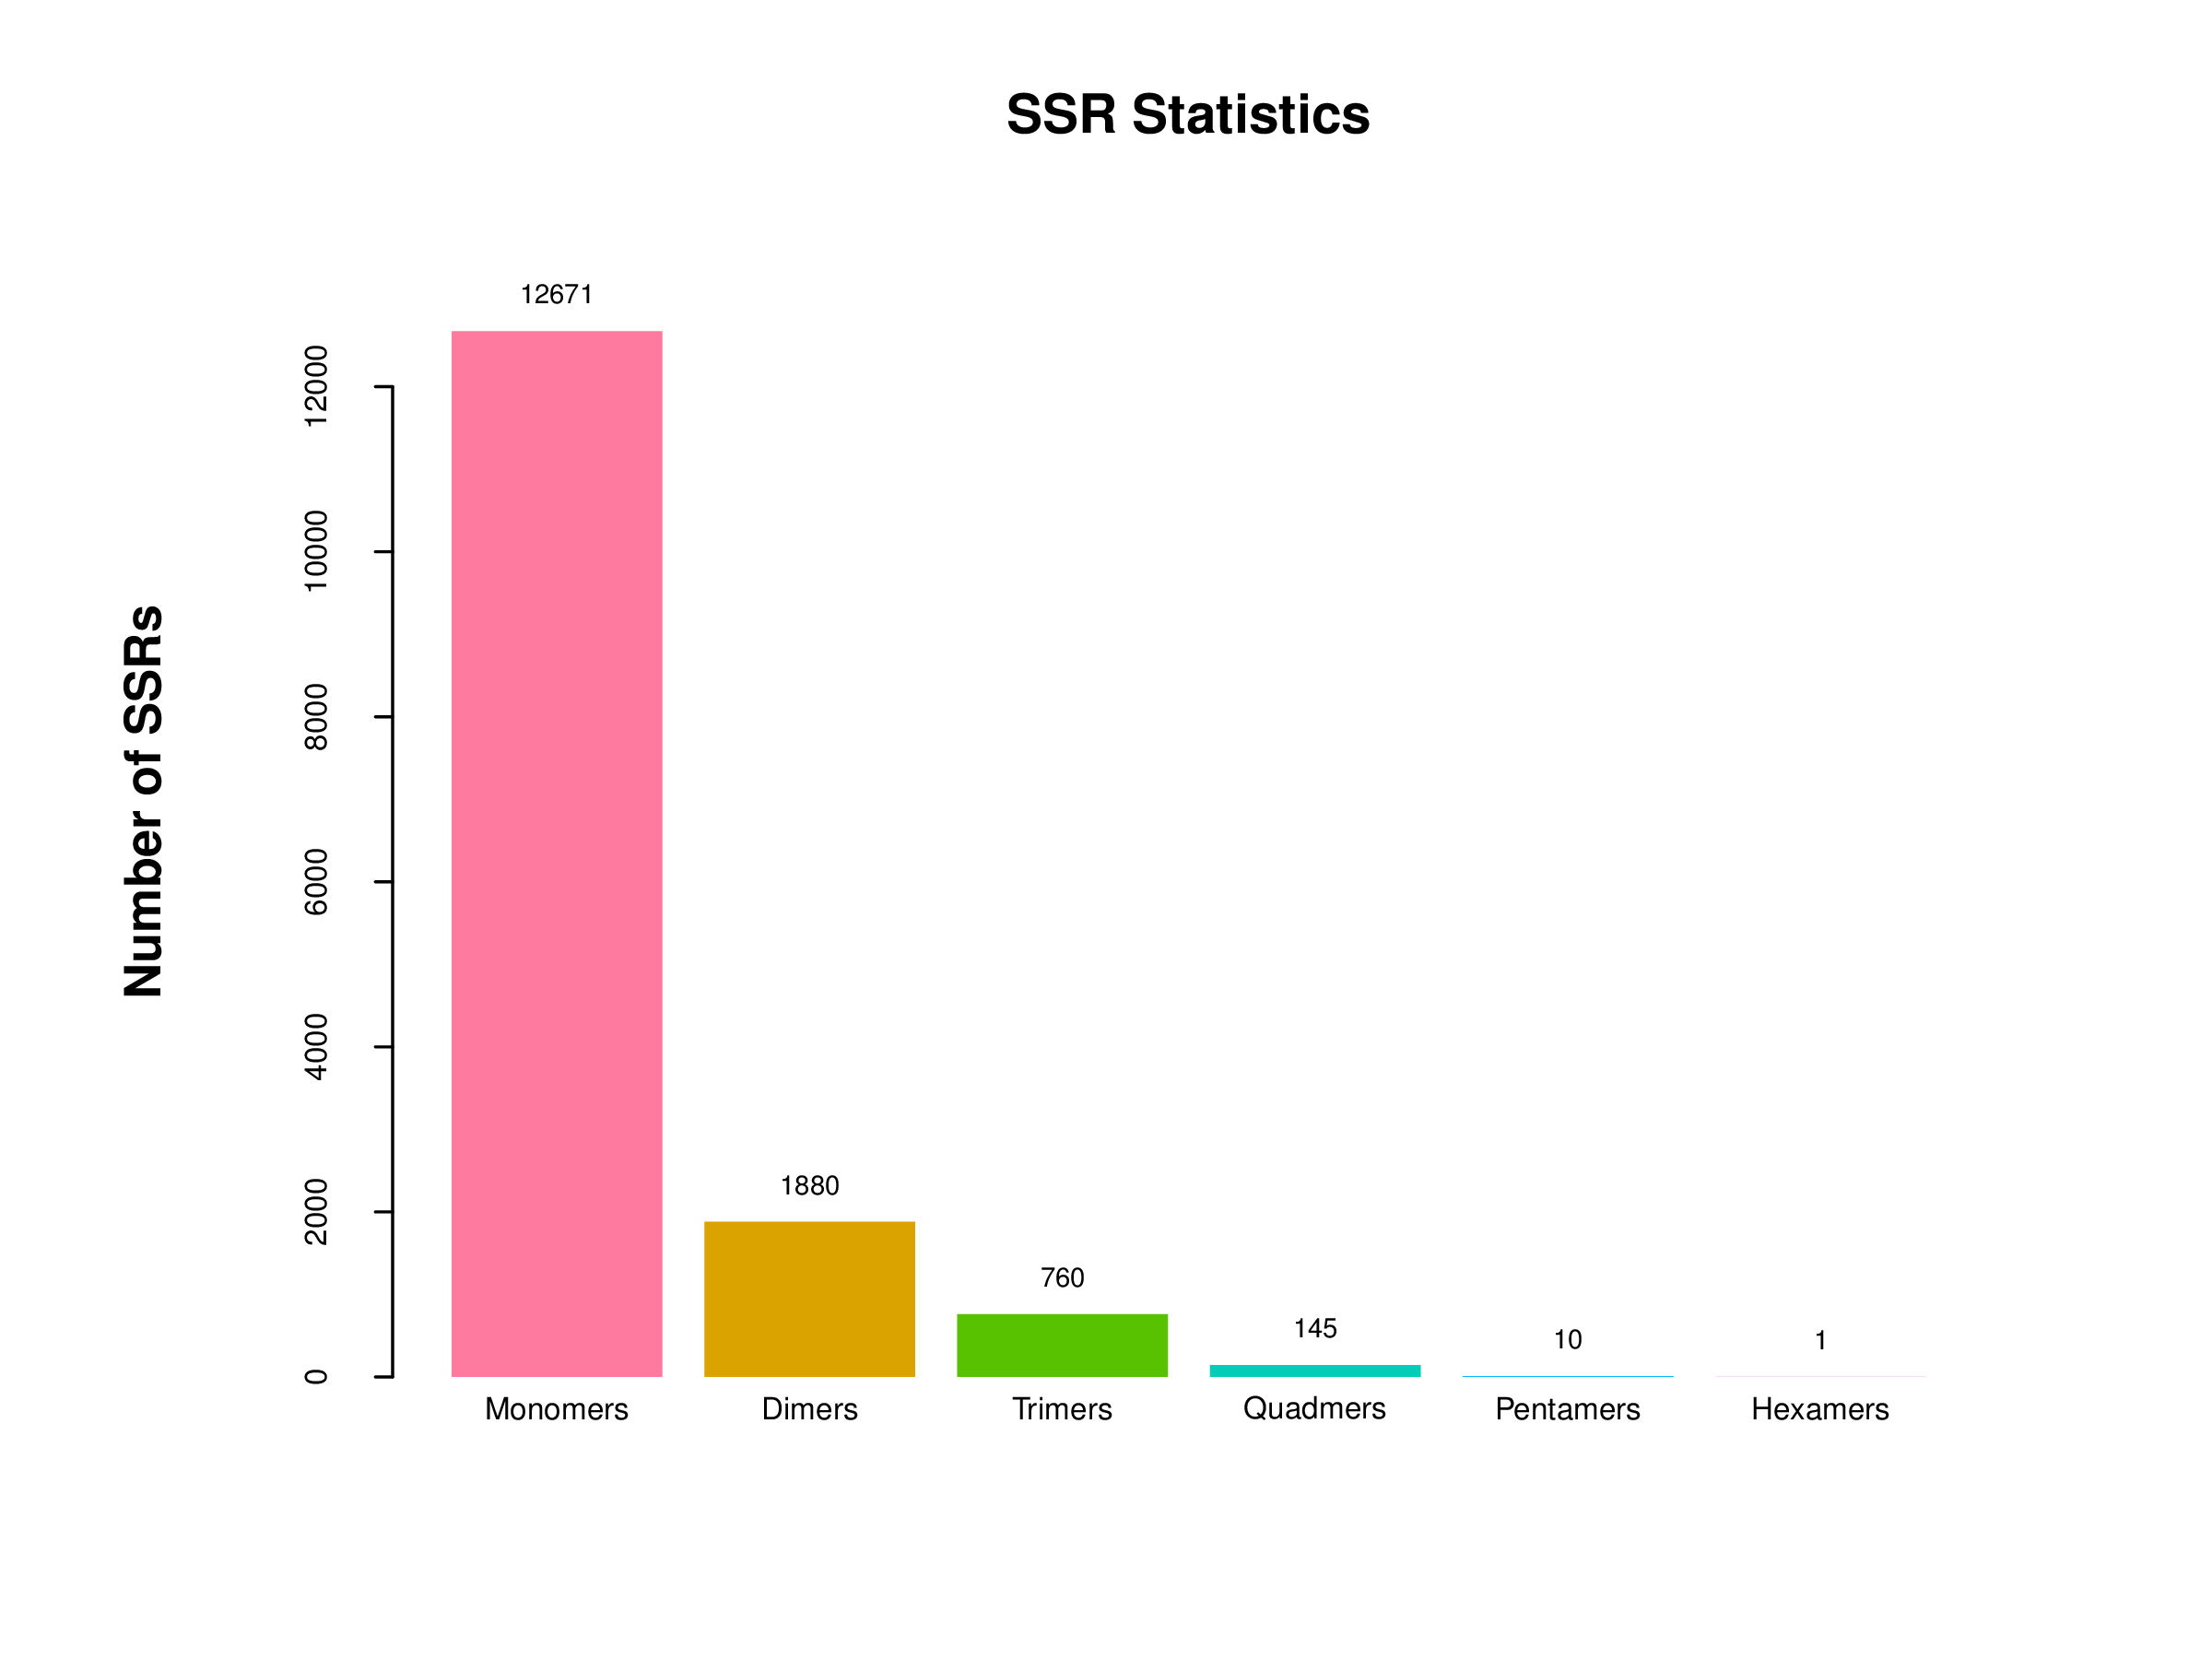
A total of 15,467 (25.84%) SSRs were detected from 59,850 unigenes. The average length between SSR loci was 3,134 bp. Among the various motifs of SSRs, the most prevalent were monomers repeat (12617, 81.57%), followed by dimers repeat (1880, 12.15 %), trimers repeat (760, 4.93%), and quadmers repeat (145, 0.94%) (Fig. 5). Notably, A/T repeats were the most abundant type of motif detected in our SSRs. Similarly, AC/GT repeats were the predominant type of motif in dinucleotide. With increasing repeat numbers, the number of motifs repeat detected in each type decreased.

Analysis of DEGs
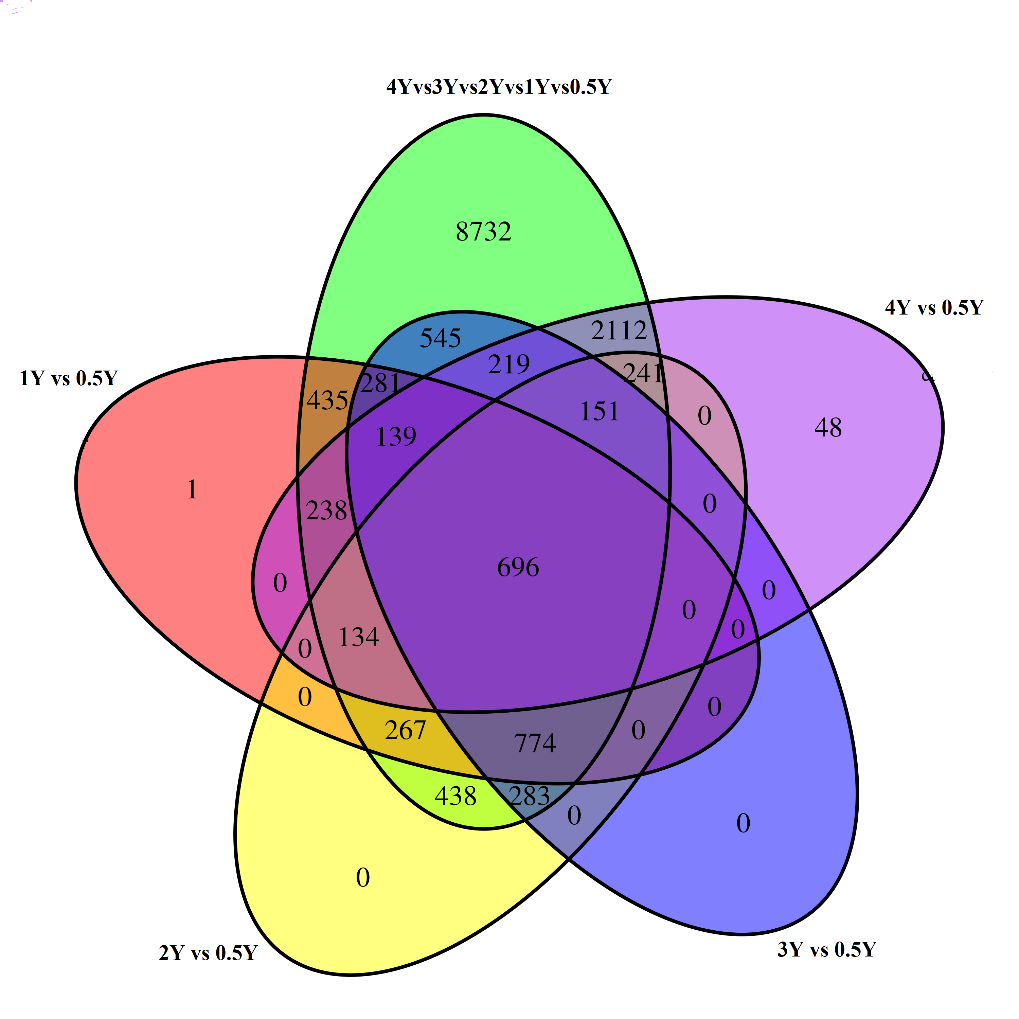
According to the standard of q<0.05 and | log2 (fold change) | ≥ 1, the 4Y, 3Y, 2Y, and 1Y groups were compared with the 0.5Y group to screen for DEGs, respectively. A total of 3,978 DEGs were identified in the 4Y vs 0.5Y comparison groups (Fig. 6A), of which 1,724 unigenes were up-regulated and 2,254 unigenes were down-regulated; 3,088 DEGs were identified in the 3Y vs 0.5Y comparison groups (Fig. 6B), of which 1,475 unigenes were up-regulated and 1,613 unigenes were down-regulated. In the 2Y vs 0.5Y comparison groups, 2,984 DEGs were found (Fig. 6C), of which 1,577 unigenes were up-regulated and 1,407 unigenes were down-regulated. In the 1Y vs 0.5Y comparison groups, 2,965 DEGs were found (Fig. 6D), including 1,420 up-regulated unigenes and 1,545 down-regulated unigenes. As illustrated in Fig. 7, the results revealed that 696 DEGs exhibited their common expression across these groups. Subsequent investigations identified several DEGs associated with muscle growth and development in CGS, including myoglobin, insulin-like growth factor-binding protein 1, myosin heavy chain 7, fibroblast growth factor-binding protein 2, myosin light chain 8, myl4, troponin I type, multiple epidermal growth factor-like domain protein 9, pyruvate dehydrogenase kinase isozyme 2, fibroblast growth factor, growth hormone receptor 1, myostatin, laminin subunit beta-3, myogenic factor, myosin binding protein, inhibitor of growth protein, and so on.


Functional annotation and enrichment analysis of DEGs
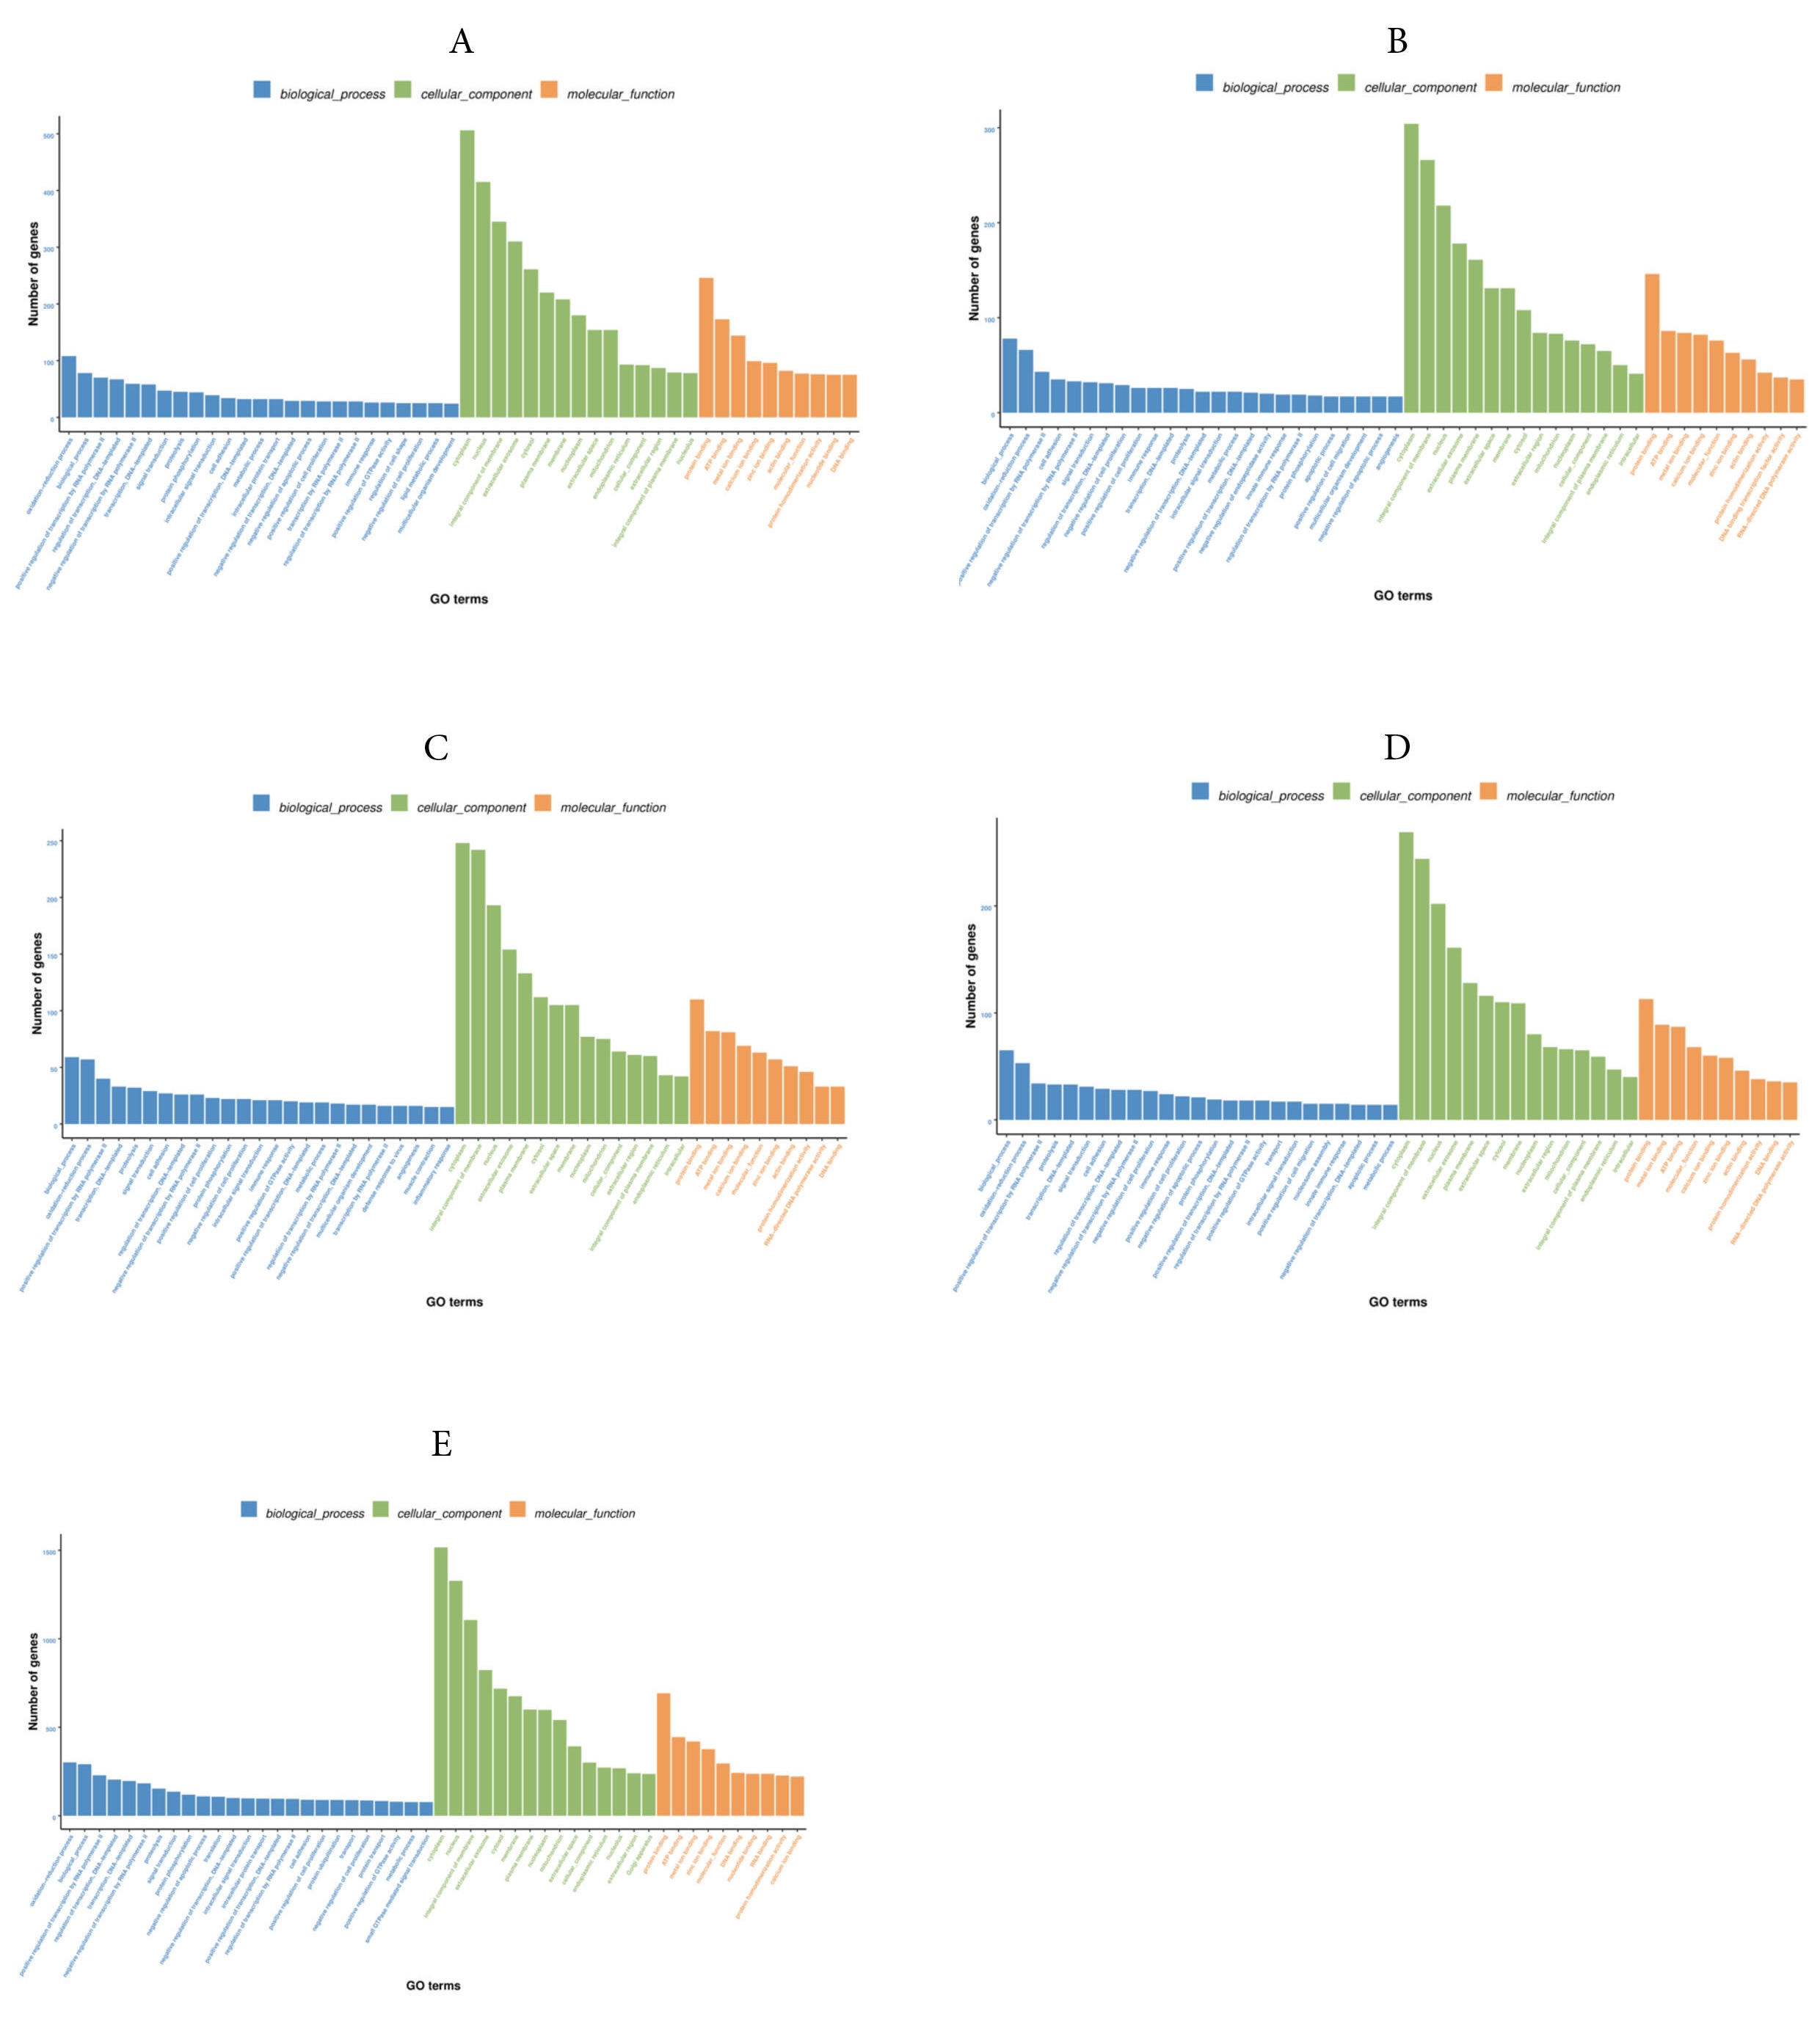
By comparing the 4Y vs 0.5Y groups, GO annotation results showed that 2,549 DEGs were enriched into three GO terms (biological processes, cellular components, and molecular functions). For biological processes, the main enriched terms were oxidation-reduction process and biological process; for cell components, the main enriched terms were cytoplasm and nucleus; for molecular functions, the main enriched terms protein binding and ATP binding entries (Fig. 8A). By comparing the 3Y vs 0.5Y groups, 1,648 DEGs were enriched. Biological processes and oxidation-reduction processes were highly enriched in biological processes term; cytoplasm and integral component of membrane were highly enriched in cell components term; protein binding and ATP binding were highly enriched in molecular functions term (Fig. 8B). By comparing the 2Y vs 0.5Y groups, 1,504 DEGs were enriched. Biological processes and oxidation-reduction processes were highly enriched in biological processes term; cytoplasm and integral component of membrane were highly enriched in cell components term; protein binding and ATP binding were highly enriched in molecular functions term (Fig. 8C). By comparing the 1Y vs 0.5Y groups, 1,552 DEGs were enriched. For biological processes, the main enriched terms were oxidation-reduction process and biological process; For cell components, the main enriched terms were cytoplasm and integral component of membrane; For molecular functions, the main enriched terms were protein binding and metal ion binding entries (Fig. 8D). Furthermore, GO annotation results for commonly DEGs also revealed significant enrichment in various terms (Fig. 8E). For biological processes term, the oxidation-reduction process, biological processes, and positive regulation of transcription by RNA polymerase II were obviously enriched.

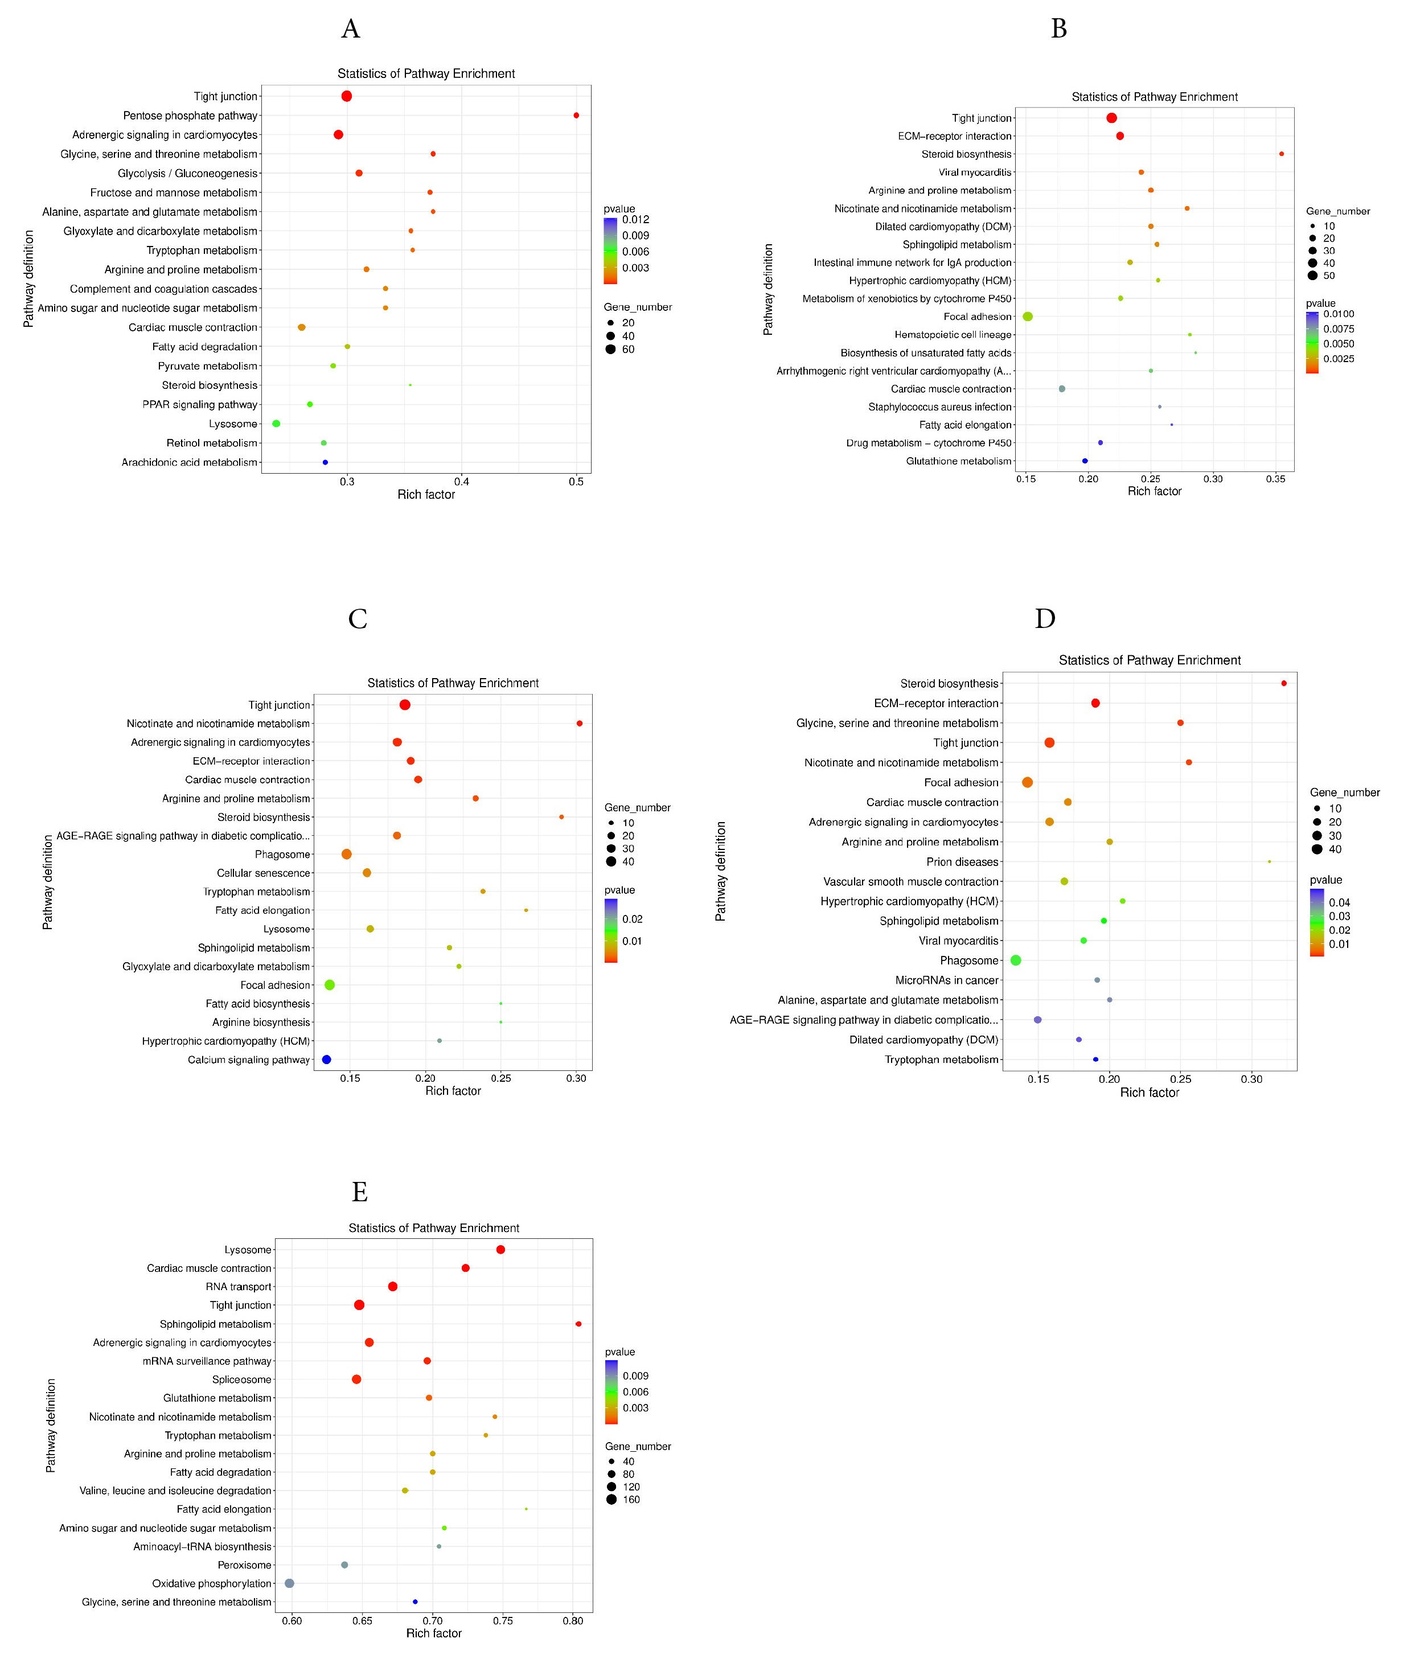
For cellular components term, significant enrichments were observed in the cytoplasm, nucleus, and integral component of the membrane. For molecular functions term, the protein binding, ATP binding, and metal ion binding were significantly enriched. The 20 most significantly enriched pathways were identified in KEGG. In the 4Y vs 0.5Y groups, the DEGs were predominantly enriched in pathways related to tight junctions, the pentose phosphate pathway, and adrenergic signaling in cardiomyocytes (Fig. 9A); In the 3Y vs 0.5Y groups, the DEGs were mainly enriched in tight junctions, ECM receptor interactions, and steroid biosynthesis (Fig. 9B); In the 2Y vs 0.5Y groups, the DEGs were mainly enriched in tight junctions, nicotinic acid, nicotinamide metabolism, and adrenergic signaling in cardiomyocytes (Fig. 9C). In the 1Y vs 0.5Y groups, the DEGs were mainly enriched in steroid biosynthesis, ECM-receptor interaction and glycine, serine and threonine metabolism (Fig. 9D). The most significant KEGG pathway enrichments among all common DEGs were identified including lysosomes, cardiac muscle contraction, and RNA transport (Fig. 9E). In addition, other major pathways related to growth included GnRH signaling pathway, MAPK signaling pathway, regulation of actin cytoskeleton, calcium signaling pathway, Glycolysis/Gluconeogenesis, protein processing in endoplasmic reticulum, and arginine and proline metabolism.
Validation of DEGs by qPCR
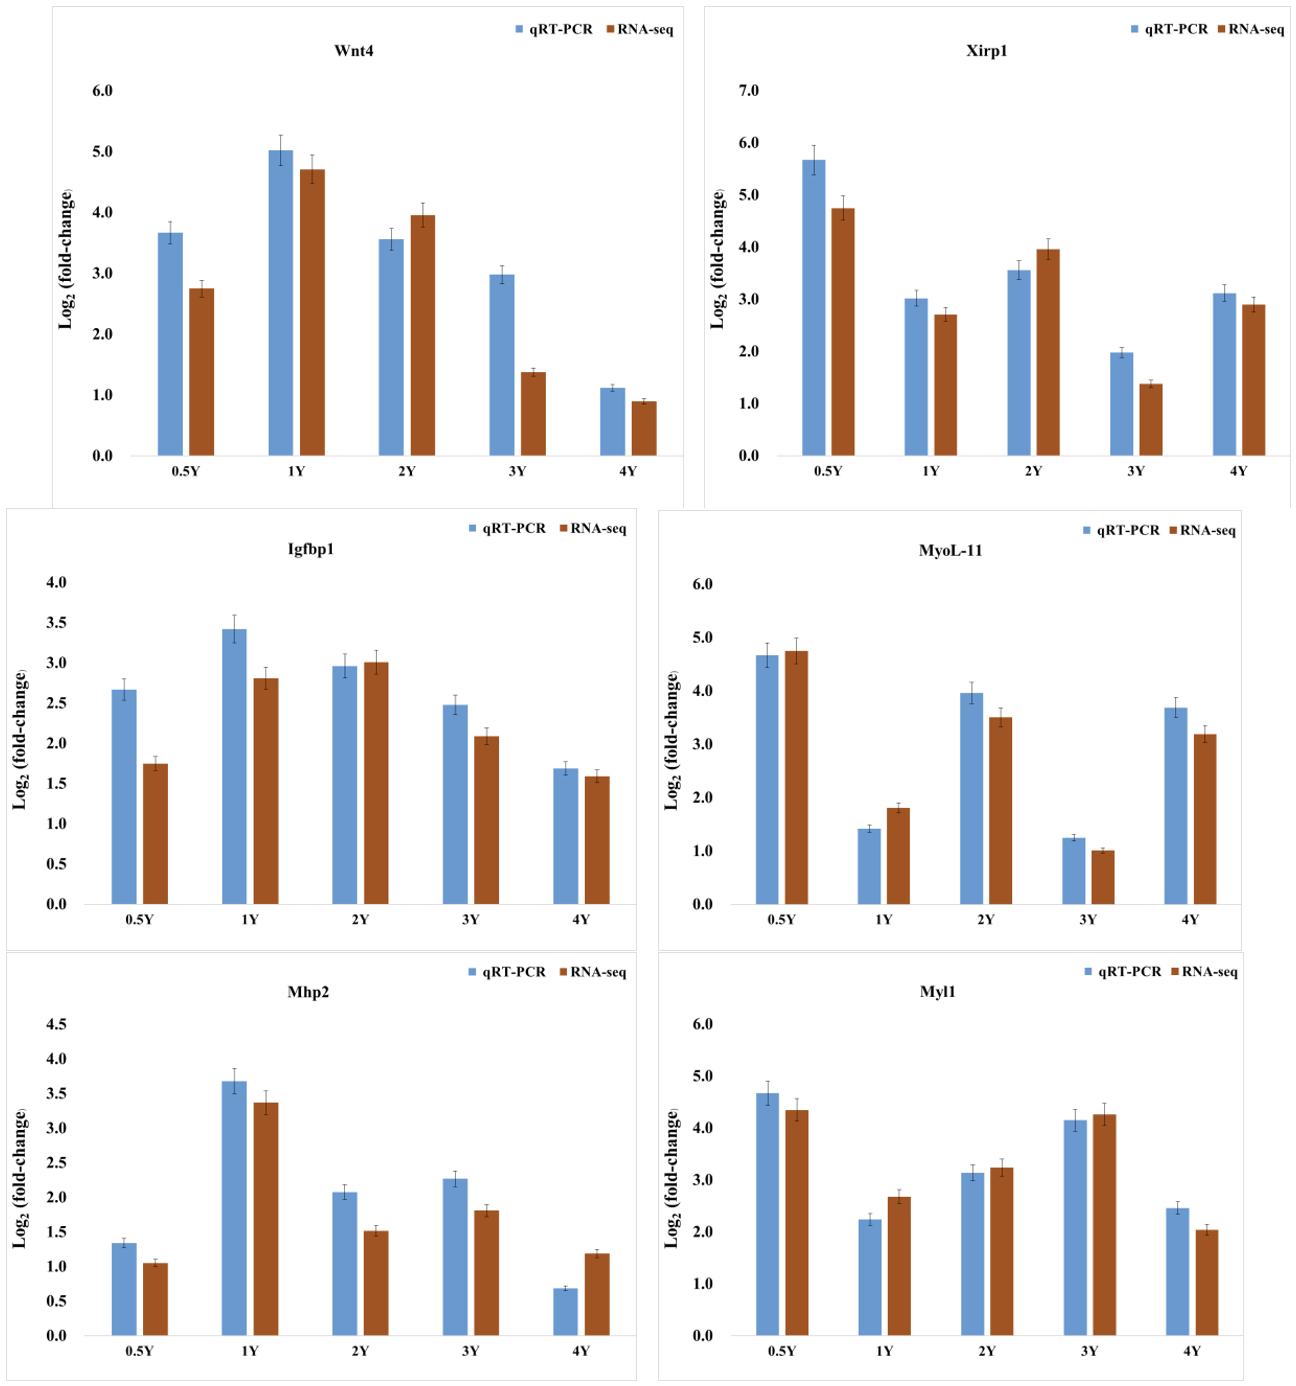
To validate the accuracy and reliability of the sequencing results, six randomly selected DEGs were subjected to qPCR for experimental validation from five different skeletal muscle samples, respectively. The qPCR results demonstrated that the expression levels of wnt4, xirp1, igfbp1, myoL-11, Mhp2, and Myl1 were consistent with the trends obtained from the sequencing results (Fig. 10), indicating the high accuracy and reliability of the transcriptome data.

Discussion
The growth of animal muscle is closely associated with various factors throughout the organism’s life cycle, including genetic individuality, living environment, and food intake, and metabolic, and is particularly influenced by the expression of growth regulating genes.16–18 In this study, CGS was chosen as research subjects to perform transcriptome sequencing from skeletal muscle at five different growth stages. Given that no reference genome sequence is currently available for CGS, only a total of 59,850 unigenes were obtained through the assembly of transcripts using the Trinity software. This data greatly enriches the gene sequence resources of skeletal muscle in CGS and provides a foundation for subsequent functional genomics research on this species. However, only 34.60% of unigenes were successfully annotated in the Nr database. It is hypothesized that the limited foundational molecular research and the incomplete genomic data of CGS has resulted in sparse annotation information of transcriptome. Among the unannotated unigenes, the short unigenes may represent 3’ UTRs or 5’UTRs, non-coding RNAs, or sequences lacking functional domains. Additionally, unigenes over 500 bp are more likely to represent undiscovered new genes, and the study of these unknown genes may reveal some important and complex biological processes in CGS.
Furthermore, the expression levels were analyzed using the assembled data to identify the level of change in DEGs. In the comparison between the 4Y and 0.5Y groups, there were 1,724 and 2,254 DEGs found to be up-regulated and down-regulated, respectively. In the comparison between the 3Y and 0.5Y groups, 1,475 DEGs were identified as up-regulated, while 1,613 were found to be down-regulated. 1,437 DEGs were down-regulated and 1,577 were up-regulated in the comparison between the 2Y and 0.5Y groups. Similarly, in the comparison between the 1Y and 0.5Y groups, there were 1,420 DEGs were up-regulated and 1,545 were down-regulated. Subsequent analysis revealed that more than 36 of DEGs encode for proteins such as troponin, myoglobin, myosin, bone membrane protein, myosin light chain 4, Rho GTPase activating protein 36, branched-chain amino acid aminotransferase 1, and Fibrin 2. It is speculated that DEGs may be conserved in their functions related to the growth and development of skeletal muscle in CGS.19–22 The MYHs gene family plays a critical role in regulating muscle growth. The myosin heavy chain, encoded by MYHs, serves as a subunit of the myosin class II molecule and represents the most abundant protein in skeletal muscle. This particular protein significantly contributes to the process of muscular development.23–25 In this study, 13 MYHs subtypes were found in this family involved in the regulation of muscle growth such as MYH1B, MYH8, MYH13, MYH1, MYH7, MYH16, MYH7b, MYH4, MYH6, MYH3, MYH11, MYH9 and MYH10. Therefore, further research is required to investigate the roles of DEGs related to muscle growth and development in CGS
GO annotation disclosed that DEGs were predominantly enriched in biological processes, cytoplasm, protein binding, and other enriched items, indicating that the development of skeletal muscle in CGS is closely related to cell growth, proliferation, and differentiation. Furthermore, a portion of DEGs were also enriched in terms including myosin filament, muscle contraction, muscle filament sliding, myofibril assembly, fibrinogen complex, myofibril, negative regulation of myotube differentiation, skeletal muscle contraction, cardiac muscle contraction, striated muscle filament, structural constituent of muscle, growth factor activity, insulin-like growth factor binding, growth factor binding, and cell growth regulation. A deeper understanding of these DEGs in function and their expression levels of CGS is needed for further experimental research.
The KEGG pathway enrichment revealed that the most of DEGs were associated with muscle growth and development, as well as with fatty acid and carbohydrate metabolism. Apart from the significant enrichment observed in cardiac muscle contraction and RNA transport, DEGs were implicated in signaling pathways directly associated with skeletal muscle development. These pathways include protein processing in the endoplasmic reticulum, MAPK signaling pathway, Hippo signaling pathway, glycolysis/gluconeogenesis, regulation of the actin cytoskeleton, and fatty acid degradation. RNA transport process is essential step for gene expression, whereas protein processing within the endoplasmic reticulum facilitates protein folding and the degradation of misfolded proteins, thereby underpinning the process of protein synthesis. Research has been demonstrated that the Hippo signaling pathway regulates the expression of muscle cells and plays a crucial role in modulating muscle growth.26 MAPK signaling pathway plays a pivotal role in regulating skeletal muscle in response to oxidative stress, energy fluctuations, and other stressors.27 Meanwhile, it integrates cellular stress signals within skeletal muscle and facilitates adaptive responses, thereby contributing to muscle cells generation and differentiation.28 Glycolysis, the metabolic pathway responsible for generating ATP from glucose, is closely related to muscle fiber and plays an important role in supplying ATP for energy expenditure in skeletal muscle cells.29,30 The actin cytoskeleton regulatory pathway is a dynamic network composed of actin polymers and associated actin binding proteins, which influence the proliferation and myogenic differentiation of animal skeletal muscle satellite cells.31
In addition, some pathways were found to be associated with KEGG metabolic pathways that did not show significant differences but were related to muscle development, including the TGF-beta signaling pathway, the mTOR signaling pathway, and the insulin signaling pathway. It can be seen that myogenesis is a complex process regulated by multiple pathways.
Conclusion
In this study, transcriptome sequencing was performed on skeletal muscle from five different growth stages (0.5Y, 1Y, 2Y, 3Y, and 4Y) in CGS. A total of 696 DEGs were identified, all of which exhibited co-expression across five stages. By GO and KEGG functional enrichment analysis, it was found that DEGs were mainly enriched in cardiac muscle contraction, RNA transport, GnRH signaling pathway, MAPK signaling pathway, regulation of actin cytoskeleton, calcium signaling pathway, and glycolysis/gluconeogenesis. Despite the limited annotation information acquired in our study, a substantial volume of transcriptome data from the skeletal muscle of CGS was successfully annotated. Our research offers an initial clarification of the biological mechanisms, metabolic routes, and signaling pathways correlated with muscle growth and development of CGS. This serves as a basis for future investigations into the functional genes and physiological functions of amphibians.
Acknowledgments
This work was supported by the Key Research Project of Higher Education Institutions of Henan Province (grant number 23A240003).
Authors’ Contribution
Data curation: Zihui Wei (Equal), Weichuan Zhang (Equal). Writing – original draft: Zihui Wei (Lead), Weichuan Zhang (Equal), Di Fei (Equal). Validation: Zihui Wei (Lead). Formal Analysis: Weichuan Zhang (Equal), Hongyu Chen (Equal). Writing – review & editing: Hongyu Chen (Equal). Methodology: Di Fei (Lead). Conceptualization: Zhiyuan Cao (Equal), Yujie Yan (Equal). Resources: Zhiyuan Cao (Equal). Software: Yujie Yan (Lead). Investigation: Yixiang Wan (Lead). Funding acquisition: Yong Huang (Lead).
Informed Consent Statement
All authors and institutions have confirmed this manuscript for publication.
Data Availability Statement
All are available upon reasonable request.