
Introduction
Aquaculture plays vital role in the global food supply. Fish are a popular group for aquafarming. This is because of their diversity, wide adaptability to different water salinity, high nutritional and meat quality, and suitability for many user groups.1,2 Fish hematological profiles and biochemical indicators have long been considered one of the most effective tools to measure and evaluate their health status. Blood parameters reflect the quality of an organism’s living environment, such as pollution, oxygen status,3 and nutrition both in the wild and on farms.4 It should also be noted that many factors can affect the results of hematological and biochemical profiles, including objective factors such as physiological state and gender,5 age,6 period of sex, temperature,7 salinity,8 and subjective factors such as sampling conditions, laboratory techniques, and blood collection methods,9 composition and ratio of anticoagulant used,10 and time and method of sample preservation.11 Dietary factors and supplementation have been shown to exert a substantial impact on fish hematology and biochemistry, as highlighted in various research studies.12–14
Fish blood cell components are divided into erythrocytes, leukocytes and thrombocytes.15 Erythrocytes contain hemoglobin, which plays a major role in the transport of oxygen and carbon dioxide; white blood cells are involved in immune mechanisms and reactions; and platelets - the blood clotting process. RBCs are one of the most important components of blood and are used as a potent biomarker, especially for factors related to environmental pollution.16 Erythrocytes in both lower and higher vertebrates have demonstrated the ability to participate in phagocytic processes in various forms.17–20 Meanwhile, leukocytes primarily function in immune mechanisms and responses, defending the body against harmful agents. In bony fish, leukocytes include basophils, eosinophils, neutrophils, lymphocytes, and monocytes. Changes in leukocyte counts are often associated with health status, living environment, diseases, or dietary supplements.21 Platelets, on the other hand, primarily function in blood clotting and secondarily in immune responses.22 Studying the quantity and morphological characteristics of blood cells allows us to consider and understand the reaction of the fish body to the environment.23 Red drum Sciaenops ocellatus (Linnaeus, 1766) naturally occurs in estuaries and coastal waters of the Gulf of Mexico and the southeastern United States. This fish species was introduced to Vietnam in 1999. It has been produced, bred, and raised commercially in the coastal provinces of Central Vietnam due to its high economic value, easy-to-raise characteristics, delicious meat, and high nutritional content. Red drum farming activities are mainly carried out in estuary areas and cages. The Cua Sot area (Hatinh, Vietnam) has been reported to have a high incidence of RBC morphological disorders in red drum and the type of disorder that appears is believed to be related to heavy metals contained in the water even though the content is within the acceptable standards.24 Research has shown that the majority of local people raise red drums using both commercial fish feed and natural feed (fish scraps). There is a limited amount of research on the nutritional requirements of this cultured species.
We conducted this study to clarify whether the use of commercial fish feed and natural feed affects the morphological characteristics and number of RBCs of red drum. In addition, the research results provide data related to white blood cells, platelets and biochemical indicators.
Materials and Methods
Experimental design
The experiment was conducted from February 17, 2022 to April 5, 2022. Red drum Sciaenops ocellatus were ordered from fish cages in the estuary area (Cua Khau, Hatinh, Vietnam) and transferred to two experimental cages measuring 3 x 3 x 2 m nearby (18.108711 N, 106.354233 E). The cages were anchored at four corners. Each experimental cage consists of two layers of mesh. The inner mesh has a mesh size of 1 x 1 mm, and the outer mesh has a mesh size of 2 x 2 cm. The average size of each individual fish was 0.85 kg - 1.25 kg and the body length was 41.2 ± 3.4 cm. Visual inspection at the beginning of the experiment revealed that all fish were healthy, with even scales, and no scratches or peeling. No parasites were detected in the eyes, nose, or on the outside of the mouth. Each experimental cage held 50 individuals, from which 10 individuals were sampled for blood collection on days 1, 5, 10, 20, and 30 of the experiment. After the fish were put into the new cage, we did not feed the fish for the first 2 days to ensure the fish adapted to the new environment and avoided stress.
One group of fish was fed on small trash fish caught in the wild and frozen (genus Decapterus species), symbolized by NF-natural feed. Before feeding the red drum, the trash fish were cut into small pieces of 1 x 2 cm to 2 x 3 cm. A random analysis of the feed ingredients made from trash fish, the results showed: crude protein – 17.50%, crude fat – 3.92%, crude fiber – 0.33%, calcium – 1.03%, phosphorus – 0.75%.
Other group of fish were fed on commercial feed Nutrilis P3 produced by Ocialis of ADM Group. Ingredients: Crude protein (min) – 43%, Crude fat (min) – 7%, Moisture (max) – 12%, Fiber (max) – 3%, Calcium (min) – 1.5%, Phosphorus (min) – 0.5%, Lysine (min) – 2.6%, Methionine and cystine (min) – 1.4%, Crude ash (max) - 16%. This group of fish is denoted CF - commercial feed.
Fish were fed twice a day, in the morning (before 9:00 a.m.) and in the afternoon (before 6:00 p.m.). The amount of feed provided depended on their consumption ability, which was usually about 3% of the total initial fish weight.
Parameters of seawater quality
In the field, water salinity was measured using a Master S-Mill Alpha salinity refractometer (Atago, Japan). Temperature, DO, and pH were measured using a Combo Water Meter (Model AZ 86031, AZ-Instruments, Taiwan).
In addition, the corresponding water samples were also collected, preserved, transported, and analyzed for heavy metal components using Liquid chromatography-inductively coupled plasma mass spectrometry at the Laboratory of the Sub-Institute of Chemistry and Environment, Joint Russian-Vietnamese Tropical Research and Technological Center, Hanoi, Vietnam.
Fish blood collection
Samples were taken from each group of fish on days 1, 5, 10, 20, and 30 from the start of feeding, denoted as 1x, 5x, 10x, 20x, and 30x respectively. Each day takes blood from 8-10 individuals in each cage. Blood samples from the first day of both groups are denoted as F1x.
Fish blood was taken from the caudal vein25 and anticoagulated with heparin solution. Four milliliters of blood were taken from each individual fish and divided it into 2 tubes, each tube containing 1 drop of heparin with a concentration of 500 IU. One tube was used for biochemical tests and determination of hemoglobin concentration. The other tube was used to dilute and count RBC as well as to make blood smears.
Fish blood parameters
A portion of blood was diluted 250 times with physiological saline solution for Ringer marine fish26 and a Neubauer counting chamber was used to count the number of RBC. The specimen is smeared and stained with Giemsa dye according to the classic method.6 Photos of slides were taken using an Olympus CX 33 microscope (Japan) with the accompanying camera Olympus SC180 (Japan). Quantification of white blood cells and platelets based on the ratio to RBC was done on smear images at 100× magnification. Size indexes of RBCs were calculated on the software ImageJ 1.54d on Windows 10.
Biochemical parameters
The hemoglobin index in the blood was measured using a Mindray BC-2800 machine (China), while biochemical indicators such as glucose, urea, creatinine, triglyceride, aspartate aminotransferase (AST), alanine aminotransferase (ALT), and protein were established with the help of a biological testing machine, Olympus AU 400 automation (Japan). All biochemical tests were performed at Hoan Hao Laboratory, Hai Thuong Lan Ong street, Hatinh city, Hatinh province, Vietnam.
Image processing and statistical analysis
Images were processed with Photoshop CS6 software only to unify their brightness for convenience in comparing and studying morphological structures. We used two AI tools to enhance the image quality, zyro.com (available at www.hostinger.com, access at 15.07.2024) and picwish.com (access at 18.06.2024). Any intervention related to cell morphology or RBC structures was not allowed.
Statistical data were processed using IBM SPSS Statistics software version 20.0.0. Values are expressed as Mean ± SD. Evaluate statistically significant differences using ANOVA and Kruskal–Wallis with the Dunn’s test (p ≤ 0.05).
Results
Water quality criteria
Results of analysis of seawater environmental indicators in the red drum farming area show that the pH concentration is relatively stable at 8.0 – 8.1, the average temperature ranges from 27.2 – 30.2, salinity fluctuates slightly from 32‰ – 35‰ and oxygen solubility from 7.5 – 8.0 mg/l (Table 1).
Morphological characteristics of blood cells
In the group of fish using commercial feed (CF), the number of red blood cells (RBCs) and white blood cells (WBCs) was stable in the early stages of the experiment (from 1st to 5th day of experiment), then increased in the middle stages of the experiment (days 10th – 20th) and decreased at the end of the experiment on 30th day (p < 0.05). Platelets (Thr) of this group of fish decreased sharply on 5th day (from 2.4 ± 0.6 on 1st day to 0.7 ± 0.6 on 5th day), then increased in the middle period (10th, 20th days of experiment) and decreased. about 2.0 ± 1.0 on 30th day of experiment (Table 2).
For the fish group using natural feed (NF), RBCs and WBCs did not record significant differences in the first 10 days (p<0.05). However, on 20th day, the number of RBC decreased by 22.5% and the number of WBCs increased by 82.3% when compared to day 10th. At the end of the experiment, in contrast to the increasing trend of RBCs (from 2.7 ± 0.6 to 5.4 ± 0.9), the white blood cells decreased from 3.1 ± 0.6 to 2.1 ± 0.8 on day 30th. The number of platelets in this group of fish decreased on days 5th and 10th, then increased on the 20th day but decreased at the end of the experiment (p ≤ 0.05). In both groups of fish, the Hemoglobin (HgB) index was relatively stable, the difference was not statistically significant (p > 0.05), fluctuating in the range of 92.9 – 125.4 (g/L).
The measurements of RBC sizes in both fish groups yielded intriguing results. In the group of fish using commercial feed, the change in cell length (Lc) was similar to nucleus length (Ln). The cell width (Wc) and nucleus width (Wn) indices also had similar changes. Meanwhile, with the group of fish using natural feed, most of the morphological size indices (Lc, Wc, Ln, Wn, Sc, Sn) decreased on the 5th day, then increased again on the 10th day. Finally, in both groups of fish, on the 30th day, most of the RBC morphology indexes decreased compared to the first day, and these indexes were also within the value range of the 1st day and 5th day of the experiment (Table 3). The Pearson correlation test showed a positive correlation (p < 0.001) between cell length, cell width, and cell area for the groups of fish using natural and commercial feeds (Table 4, Table 5).
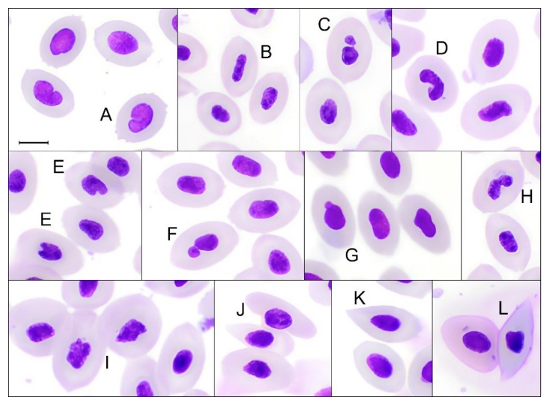
In addition to changes in the number of blood cells, the results also recorded morphological abnormalities in the RBC of the red drum. In the CF1 (or NF1) fish group, RBC abnormalities recorded include kidney-shaped nucleus or/and wrinkled membrane, rod-shaped nucleus, nucleus bud on the filament, blebbed nucleus, bi-nucleus, notched nucleus, lobed nucleus, eccentric nucleus, teardrop erythrocyte or rhombus-shaped cytoplasm (Figure 1).

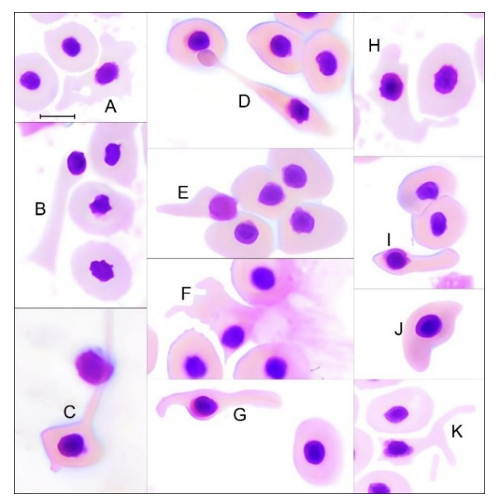
In the CF5 fish group, RBCs with many different cytoplasmic shapes were recorded. There were no significant concerns for morphological disorders related to RBC nuclei other than a few RBCs with asymmetrical nuclei (Figure 2). In CF10 fish individuals, a small number of cells with abnormal cell shapes such as teardrop-shaped cells and cells with defective nuclear membranes were noted. In the CF20 fish group, cases of RBC abnormalities mainly include teardrop-shaped cells, wrinkled cell membranes, and in particular, a small number of RBCs that had a blue-stained ring around the nucleus. In the blood of CF30 fish, there was no appearance of cells with abnormal shapes like in CF5, mainly abnormalities related to nuclear shape or wrinkles at the ends of RBCs (Figure 3).
_day_of_experim.png)
__20_th__(cf20)_and_30_.png)
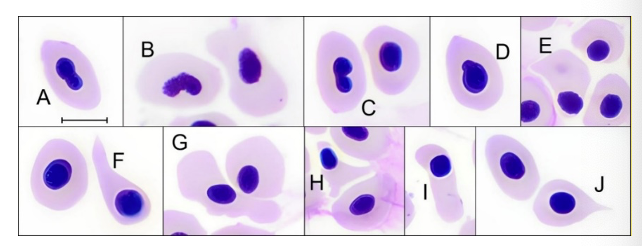
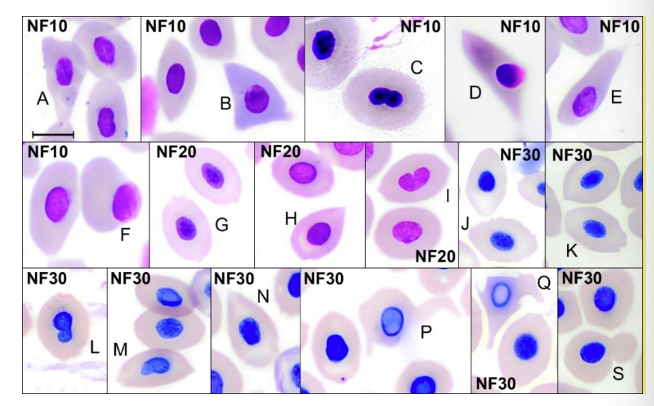
The NF5 fish group also recorded RBCs with disorders in both nuclear shape as well as cell shape with many different patterns (Figure 4). Fish erythrocytes of NF10 mainly recorded abnormalities such as eccentric nuclei or elongated cytoplasm. In the NF20 group of fish, it was recorded that the cells were drop-shaped, the nuclear membrane had wrinkles at the cell poles, or a small amount of disorder related to the shape of the nucleus. The main abnormality for the NF30 fish group was the formation of wrinkles on the cytoplasmic membrane, teardrop cells, lobulated nuclei, and bud nuclei or abnormalities related to the general shape of RBCs (Figure 5).
_day_of_experim.png)
__20_th__(nf2.png)
Biochemical parameters
Some biochemical indicators of the CF group fluctuated during the entire experiment but the differences were not statistically significant (p > 0.05). This included urea: 0.7 – 1.8 (mmol/L), AST: 4.7 – 41.6 (U/L), ALT: 0.7 – 6.1 (U/L), and protein: 20.9 – 49.2 (g/L). The creatine index gradually decreased from the beginning to the end of the experiment from 38.2 ± 5.0 to 13.6 ± 1.5 (µmol/L), triglycerides increased significantly on day 20th by 50% compared to the 1st day, but after that decreased sharply to 63% on day 30 (p ≤ 0.05). Glucose concentration decreased sharply from 5.4 ± 1.7 mmol/L on the 1st day to 2.4 ± 0.6 mmol/L on day 5 (p ≤ 0.05), but gradually increased again. The highest value at the end of the experiment, day 30, reached 10.5 ± 3.4 mmol/L (Table 6).
In the group of fish using natural feed, some indicators were similar to those in the group of fish using commercial feed. No differences were noted for HgB, urea, and ALT (p > 0.05). Total protein concentration in the blood of this group of fish decreased on day 10, from 40.8 ± 3.2 to 33.8 ± 1.0 g/L, but then increased again on 20th day (p ≤ 0.05), up to 40.2 ± 4.5 g/L. Creatine and triglyceride indexes show a decreasing trend over time, with creatine decreasing from 38.2 ± 5.0 to 14.8 ± 2.5 (µmol/L) and triglyceride from 5.9 ± 0.7 to 3.3 ± 0.6 mmol/L on day 30 of the experiment (p ≤ 0.05). Meanwhile, the blood glucose of this group of fish increased significantly on day 20 (p ≤ 0.05), from 5.4 ± 1.7 mmol/L on the first day to 16.2 ± 6.2 mmol/L, then decreased on 30th day (p ≤ 0.05). The liver enzyme index AST increased on 10th day and then gradually decreased after that (p ≤ 0.05).
Discussion
The research area is located about 4 km from Vung Ang thermal power plant, about 15 km from Son Duong seaport, and 20 km from Formosa Iron and Steel Factory. After an environmental disaster in the central coastal region of Vietnam in April 2016, a large number of fish and other marine life vanished,27 the quality of wastewater from factories and industrial parks here has been regularly evaluated and monitored by state agencies as well as independent organizations.28 In this study, the heavy metal content in seawater at the research site in Ky Ninh (Hatinh) was very low, completely within the allowable limit according to national standards for coastal seawater quality.29 Many parameters were not detected in the collected water samples such as Cr, As, Mn, Hg, Ni, Cd, Cu, and Pb. The Mg content was recorded in the range of 187 – 263 mg/l, which is low compared to the usual levels of this metal in seawater, usually around 1300 mg/l.30 Our previous research also provided similar results about the seawater parameters in the above-mentioned area.24 This shows that the implementation of waste and wastewater treatment at factories and industrial parks before discharging into the sea has been effective. Water quality at the research site meets the requirements for aquaculture.
In 2019, the number of RBCs in red drums in some coastal areas of Vietnam was recorded to be between 1.5 – 3.4 (× 106/µL), and at the above research location, it was 1.8 ± 0.3 (× 106/µL).24 In this study, the number of RBCs in the red drum was significantly higher, ranging from 2.1 – 6.3 (× 106/µL), and the erythrocytes of the fish group using commercial feed were much higher than those of the fish group using natural feed on days 10th and 20th. An increase in the number of RBCs leads to a higher ability to supply oxygen to the tissues.31 In farming methods supplemented with additives and biological products, many cases recorded an increase in growth rate accompanied by an increase in the number of RBCs, which proves that fish benefit from oxygen supply optimized and the possibility that a direct relationship exists between growth rate and RBC count.6 In this study, commercial feed exhibited significantly higher protein content compared to natural feed (43.0% vs. 17.5%). For red drum, the optimal dietary protein level for growth and development is within the range of 40-45%.32 Thus, the use of commercial feed led to increased RBC count, and this may lead to better growth for the red drum, thereby bringing economic efficiency to investors. Our findings are consistent with a study on Oncorhynchus mykiss by Ahmed & Ahmad,33 which showed a positive correlation between dietary protein levels (30-45%) and red blood cell count over a 10-week experimental.
WBC and platelet counts are often used as indicators of fish health status.6 Leukocytes are known for their immune system-related functions in fish as well as in other vertebrates. Platelets often receive less attention than the other two types of cells,6 especially in studies related to fish nutrition and diet. Often while using an optical microscope, platelets are easily confused with lymphocytes.6 The results of this study show that platelets mainly consist of two groups, one group is elongated platelet cells (group of spindle-shaped cells), and the other group is round cells with light pink cytoplasm. The second group of platelets that are easily confused with small lymphocytes but with a thin layer of cytoplasm that stains blue with Giemsa dye which helps to distinguish the two.34 In this study, although the living environment of red drum is the same, differences in diet may be a factor that affects the number of the blood cells mentioned above.35 Different living environments provide feed sources with different quality and nutritional composition, along with pathogens directly in the environment or indirectly in the feed, thereby affecting disease, and the number of white blood cells and platelets. The increase or decrease in cellular components in the fish’s blood helps the fish adapt to environmental changes and achieve balance with those factors.
Hemoglobin plays a particularly important role in the adaptation of fish to environmental factors related to oxygen and the release of carbon dioxide.36 Our research shows that the hemoglobin content in red drum blood is stable across fish groups as well as over the entire experiment period, ranging from 91.1 to 125.4 g/L. The differences between fish groups or stages were not statistically significant (p < 0.05), which is believed to be related to the oxygen concentration in seawater in the study area. The experimental location is located in the estuary area but in a small, relatively closed bay, with moderate flow speed, and no surrounding algae, moss, algae, seagrass, or other agents that can cause large changes in oxygen concentration, which ensures the stability of the fish’s metabolic process.
Regarding the morphological indexes of erythrocytes of the red drum, there seems to be no close relationship between cell length and width, as well as RBC length and nucleus width (r < 0.4). However, there is a moderate positive correlation between cell length and width and its area (0.5 < r < 0.8). At the same time, our results recorded RBCs with shape disorders in both the nucleus as well as the cytoplasm. Previous research in this area24 has also reported high levels of RBC disorders in red drum fish but mainly disorders related to cell nuclei such as nuclear distribution and nuclear shape. Meanwhile, images of fish blood samples from this experiment show a large number of cells with disorders related to cell shape - determined by membrane structure and cytoskeleton. In addition to the main function of transporting oxygen, fish RBCs also participate in the body’s immunity.37 To ensure the performance of these functions, fish RBCs, like other lower animals, have the ability to change morphology to form pseudopods38 and even participate in phagocytosis.39 Fish RBCs are similar to nucleated RBCs of other non-mammal species, the cell shaping is done by membrane structure and cytoskeleton.40 The membrane structure is mainly a lipid bilayer and a hexagonal network with a series of associated proteins such as spectrin, actin, 4.1R protein, ankyrin, actin, and band 3-containing multiprotein complexes.41 Research by Revskij et al.42 indicates ingredients in animal diets that affect the activity and function of erythrocyte membranes. In our opinion, the use of feeds with different nutritional compositions can change the ratio of proteins and/or lipid components (phospholipids and cholesterol) of the RBC membrane, thereby causing the cells to become more flexible and easily change form or less flexible and stable. On the other hand, fish erythrocytes are considered more responsive to environmental stress and often differ in morphology and oxygen transport efficiency,43 which also means that fish blood cells, in general, are highly sensitive to exogenous factors. On day 5 of the experiment, a variety of membrane-related disorders were observed in both groups of fish, while from day 10 to the end of the experiment, the diversity of RBC membrane structural disorders decreased. This may happen because the red drum achieved a new, stable state of balance in metabolic activity and tolerance of ingredients in feed. It should also be noted that commercial feed for marine fish with a protein content of 43% in this experiment is considered necessary and appropriate for ensuring the highest growth value as well as feed efficiency for red drum.32
Fish blood biochemical data play a fundamental role in monitoring changes in fish health status in livestock production. Serum glucose is an indicator of rapid response to various stressors.44 For red drum in the wild, blood glucose levels have been reported to be 0.94 – 3.83 mmol/L,45 while in experimental farming conditions, it ranges from 5.14 – 15.01 mmol/L.46 In this study, glucose values fluctuated quite widely, from 1.9 - 13.9 mmol/L for the fish group using commercial feed and from 3.7 - 22.3 mmol/L for the fish group using natural feed. At the same location above, field survey results in 2019 recorded glucose content in red drum blood from 11.6 - 18.0 mmol/L.24 The glucose content in the blood of bonefish varies greatly between species, and in many species, this index is quite sensitive to feed and nutrition.44 Factors that can increase the amount of glucose in fish blood are environmental pollution,47 ingredients added to feed48 or in some cases stress.49 It can be seen that red drum in captivity have significantly higher blood glucose levels than in the wild, clearly since commercially raised fish are provided with adequate and stable carbohydrates. This brings positive effects on the fish’s metabolic activity as well as the accumulation of glycogen in the fish’s muscles and liver, helping them achieve effective growth in size and weight. The results of this study are similar to those of Fazio’s study50 on the positive correlation between glucose concentration and weight and length of rainbow trout under commercial farming conditions.
As we know, creatinine is a waste product of creatine from muscle activity after filtering through the kidneys. The concentration of creatinine will, therefore, depend on the level of muscle activity as well as the filtering ability of the kidneys. The creatinine index in the fish blood of this study on the 10th day decreased sharply both in the group of fish using commercial feed as well as in the group of fish using natural feed and was also significantly lower than the results of the study. In 2019, at the same location, the creatinine index of the red drum was reported to be 50.3 ± 8.9 µmol/l.24 Creatinine index in the blood of Sciaenops ocellatus in experimental saltwater conditions have been recorded at 17.7 – 23.9 µmol/l,46 corresponding to the range of values we received from this study. High creatinine concentrations on the first day of sampling may be a residual stress effect due to transporting fish or changing their habitat,46 and over time, thanks to a stable living environment and feed, balanced metabolic activity, and the filtering ability of the kidneys, the amount of creatinine in the blood decreased.
Urea, like creatinine, is a product of nitrogen metabolism but differs as it is converted by the liver from NH3 into the blood for excretion in the kidneys. Two important nonspecific enzymes AST and ALT are often reported to be increased in cases of liver damage51 or in pathological conditions and they are simultaneously present in other organs such as the gills, liver, kidneys, and heart of fish.52 The concentrations of protein, urea, and enzymes such as AST and ALT were largely stable during the entire experiment, which showed that there was no damage to the fish’s internal organs.
Triglyceride is the main form of lipid in adipose tissue and is also the body’s essential fat storage form.53 Triglycerides reflect the amount of fat absorbed into the body and should be assessed whenever there is a change in diet.54 Fluctuations of triglycerides in fish blood have been recorded in nutrition-related cases,55 health condition,56 development stages, or environmental pollution.57 In this study, the triglyceride content of the fish group using NF gradually decreased over time towards the end of the experimental period, while the fish group using CF increased on 20th day and then decreased again on the last day of the experiment. The nutritional regimen was maintained evenly, and the water quality was considered unpolluted for red drum at the time of the experiment, thus, large fluctuations in triglyceride content of the fish group using CF could be associated with increased lipid storage and/or decreased lipid catabolism.
Crude protein and lipid contents were among the most significant quantitative differences between the two diets used in the aforementioned experiment. Additionally, the commercial diet was supplemented with various amino acids, including lysine (2.6%), methionine, and cystine (1.4%). Although we did not conduct a detailed analysis of the amino acid composition in the natural diet, reference values for a representative species of Decapterus (D. maruadsi) for the three aforementioned amino acids were reported as 13.9%, 4.51%, and 0.69%, respectively.58 Moreover, the structure of amino acids remains relatively stable under cold storage conditions, such as -10°C to -20°C in this experiment. This implies that the natural diet provided certain essential amino acids to the experimental fish. In general, the biochemical indices of red drum blood in this experiment both had corresponding values and fluctuations compared to previous research results,24 which proves that fish are sensitive to and affected by many different factors, including endogenous and exogenous factors.
Conclusion
Although both groups of fish were reared under identical environmental conditions, the distinct dietary regimes resulted in differential alterations in blood cell composition and biochemical parameters. The observed variations in hematological and biochemical indices were primarily evident at specific time points during the experiment. Notably, the group fed commercial diets exhibited a higher degree of erythrocyte membrane and cytoplasmic abnormalities compared to those fed natural diets. These findings suggest that the varying dietary compositions may have influenced the structure and integrity of the erythrocyte membrane and cytoplasm, potentially compromising their functional capabilities. Consequently, further investigations are warranted to elucidate the specific effects of nutrition on the structure, morphology, and function of erythrocytes in red drum as well as on biochemical indices.
Acknowledgments
We express our gratitude to the families of Mr. Nguyen Van Ly and Mrs. Nguyen Thi Thuan for their dedicated help during the implementation of the experiment in the locality. This research was funded by the Vietnam-Russia Tropical Center.
Authors’ Contribution
Conceptualization: Do Huu Quyet (Lead). Formal Analysis: Do Huu Quyet (Lead). Software: Do Huu Quyet (Lead), Nguyen Thi Mai Huong (Equal), Tuong Phi Vuong (Equal). Visualization: Do Huu Quyet (Lead), Nguyen Thi Mai Huong (Equal), Tuong Phi Vuong (Equal). Writing – original draft: Do Huu Quyet (Lead). Data curation: Pham Tan Dung (Equal), Mai Bich Dung (Equal). Methodology: Pham Tan Dung (Equal), Nguyen Thi Le Na (Equal), Mai Bich Dung (Equal), Nguyen Thi Mai Huong (Equal), Tuong Phi Vuong (Equal). Writing – review & editing: Nguyen Thi Le Na (Equal).
Competing of Interest – COPE
No competing interests were disclosed.
Ethical Conduct Approval – IACUC
Red drum (Sciaenops ocellatus) is not considered endangered or protected, so experiments with this species in Vietnam do not require special permissions. The animal experiment received approval from the Scientific Council of the Joint Vietnam-Russia Tropical Science and Technology Research Center (Decision № 3745 from 10/02/2022).
Informed Consent Statement
All authors and institutions have confirmed this manuscript for publication.
Data Availability Statement
All are available upon reasonable request.