


Introduction
Amphiprion ocellaris, also called ocellaris clownfish belongs to the family, Pomacentridae, subfamily Amphiprioninae.1 It is widely distributed throughout the Indo-West Pacific region, extending from the eastern Indian Ocean to the Indonesian and Philippine archipelagos, and from the coast of northwestern Australia to the Ryukyu Islands of Japan.2 A. ocellaris has been cultured successfully and raised commercially since 1950.3 In recent years, with the success of the movie “Finding Nemo” where the principal character is an Amphiprion sp., and the popularity of marine aquariums, this fish has become one of the principal marine ornamental fish commercialized in the world with an increased financial value.4
The coloration and patterns of fish play crucial roles in various aspects such as mating selection, signaling spawning times, camouflage, sun protection, and thermoregulation, and they are also key determinants of fish quality. These color traits are governed by pigment cells in the skin, which can adjust color by moving pigment granules within the cell in response to environmental factors such as temperature, light exposure, and diet.5
Recent advances in high-throughput sequencing technologies have enabled a deeper understanding of the molecular mechanisms underlying these color changes. Transcriptome analysis, in particular, has emerged as a powerful tool for linking gene expression with body color.6 By analyzing the transcriptomes of fish with different colorations, researchers can identify the genes and molecular pathways involved in pigment formation and regulation, revealing how genetic and environmental factors influence these processes.7 Notably, there has been a surge in research focusing on the genetic and epigenetic dimensions, specifically investigating the expression of genes responsible for pigment cell differentiation and function across diverse environmental and developmental contexts. A notable study by Zhu et al.8 revealed that red-colored Plectropomus leopardus exhibits enhanced potential for carotenoid uptake, transport, and accumulation compared to its black-colored counterparts, possibly utilizing more arachidonic acid for body color formation, while the latter demonstrates increased melanin synthesis activity.8 Furthermore, variations in body color, governed not only by genetic factors but also by environmental influences, have significant implications. For instance, variations in the body color of zebrafish can substantially affect their camouflage from predators, directly impacting survival rates.9 Environmental parameters, such as light intensity and background coloration, can indirectly modulate fish body color by altering gene expression.10 The influence of environmental factors on gene expression typically operates through epigenetic mechanisms like DNA methylation and histone modifications, which can induce both long-term and short-term alterations in expression patterns.11
This study aims to investigate the genetic mechanisms underlying body color variation in A. ocellaris. By using high-throughput sequencing to analyze skin tissues from four A. ocellaris strains with distinct color differences, we seek to identify key genes and metabolic pathways that determine body color. The research methodology involves the analysis of unique and shared transcripts among different color groups, and the identification of differentially expressed genes. Functional annotation using GO and KEGG pathways will help in elucidating the biological processes and pathways involved in color formation. The results of this study will contribute to a theoretical foundation for understanding the mechanisms of fish color formation and offer guidance for breeding selection strategies.
Materials and Methods
Experimental design and sampling
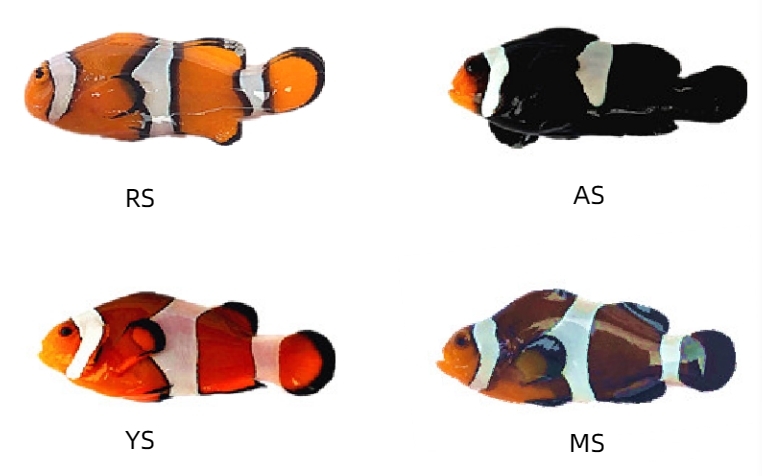
Individuals of A. ocellaris (body weight: 1.59±0.33g, Fish age: 6 months.) for experimental purposes were obtained from the Tropical Aquaculture Research and Development Center, South China Sea Fisheries Research Institute, Hainan, China. This study utilized four different color varieties of A. ocellaris, which were divided into four experimental groups: Captive Breeding of A. ocellaris (RS), Australian Geographic Variation of A. ocellaris (AS), Wild-Caught A. ocellaris (YS), and Carnelian A. ocellaris (MS) (Figure 1). The RS group served as the control. Each variety was represented by three replicates for transcriptome analysis experiments. Key gene expression levels were compared in skin tissue samples from the four different sources of A. ocellaris.
All animal treatment met the standards of the Institutional Animal Care and Use Committee guidelines.
Library preparation and Sequencing
Total RNA was extracted using TRIzol® Reagent (Invitrogen) following the manufacturer’s instructions. The integrity, concentration, and purity of RNA were assessed by agarose gel electrophoresis, Nanodrop2000 (NanoDrop Technologies), and 2100 Bioanalyzer (Agilent). Only high-quality RNA (OD260/280 = 1.8 ~ 2.2, OD260/230 ≥ 2.0, 28S:18S ≥ 1.0, Total RNA > 10 μg) was used for subsequent experiments.
For the RNA-seq transcriptome library construction, 5 μg of total RNA was processed using the TruSeq™ RNA Sample Preparation Kit from Illumina (San Diego, CA). Double-stranded cDNA was synthesized using the SuperScript Double-Stranded cDNA Synthesis Kit (Invitrogen, CA) and random hexamer primers (Illumina). Following synthesis, the cDNA underwent end-repair, phosphorylation, and adenylation of ‘A’ bases according to the Illumina library construction protocol. The library was quantified with a TBS380 and sequenced on the Illumina HiSeq X Ten platform using a paired-end 2 × 150 bp configuration.
KEGG enrichment and clustering heat map analysis
Metabolic pathways were predicted through KEGG mapping (http://kobas.cbi.pku.edu.cn/home.do).12 Compared with the whole transcriptome background, functional enrichment analysis was conducted at a Bonferroni-corrected P-adjust ≤0.05 to identify which differentially expressed genes (DEGs) were significantly enriched in KEGG pathways. Additionally, the hclust function in R was used for hierarchical clustering analysis to generate a heatmap of gene expression patterns. Correlation coefficients among genes were obtained using the Spearman correlation algorithm and presented in a correlation network within the R statistical environment.
Quality control and Read mapping
The raw paired-end reads were trimmed and quality controlled by fastp with default parameters. Then clean reads were separately aligned to the reference genome with orientation mode using HISAT2 software. The mapped reads of each sample were assembled by StringTie in a reference-based approach.
Differential expression analysis and Functional enrichment
To identify DEGs (differential expression genes) between two different samples, the expression level of each transcript was calculated according to the transcripts per million reads (TPM) method. RSEM was used to quantify gene abundances. Essentially, differential expression analysis was performed using the DESeq2 or DEGseq. DEGs with |log2FC|≧1 and FDR<0.05(DESeq2) or FDR<0.001(DEGseq) were considered to be significantly different expressed genes. In addition, functional-enrichment analysis, including GO and KEGG, was performed to identify which DEGs were significantly enriched in GO terms and metabolic pathways at Bonferroni-corrected P-value <0.05 compared with the whole-transcriptome background. GO functional enrichment and KEGG pathway analysis were carried out by Goatools and Python scipy software, respectively.
Results
DEGs in Four Different Colored A. ocellaris
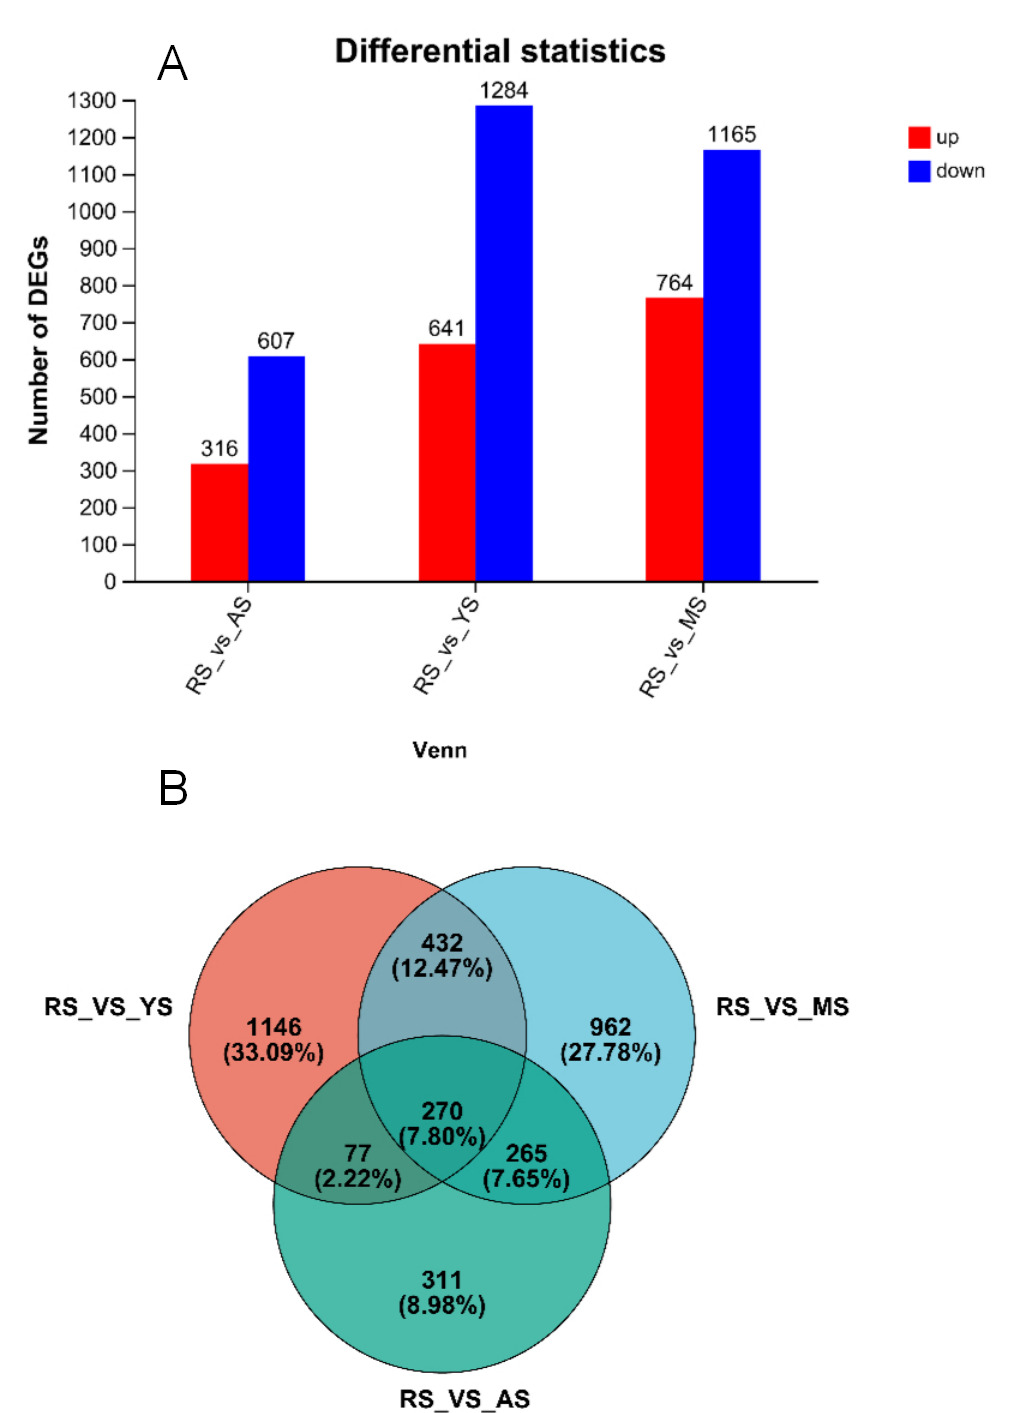
In the analysis of differentially expressed genes (DEGs) in the skin of four distinct strains of A. ocellaris (Figure 2A and Figure 2B), a total of 270 DEGs were found to be common across the strains. In the comparison between RS and AS, there were 932 DEGs identified, with 316 DEGs upregulated and 607 downregulated, and they had 1146 unique DEGs. In the comparison between RS and YS, a total of 1925 DEGs were observed, with 641 upregulated and 1284 downregulated, and the unique DEGs numbered 331. Finally, in the comparison between RS and MS, there were a total of 1929 DEGs, with 764 upregulated and 1165 downregulated, and the unique DEGs amounted to 962.

Gene Ontology (GO) Functional Annotation Analysis of DEGs from Four Different Sources of A. ocellaris
Based on biological processes, cellular components, and molecular functions, Gene Ontology (GO) classifications were assigned to predict functional categories for gene fragments of Geckloni (Figure 3). In the DEGs from the RS vs. AS comparison, a majority of DEGs were involved in cellular processes (152), binding (140), single-organism processes (127), metabolic processes (120), and catalytic activity (111), with the fewest DEGs participating in macromolecular complex formation (21). In the DEGs from the RS vs. YS comparison, 302 DEGs were involved in cellular processes, 290 in single-organism processes, and another 290 in binding, with the least number of DEGs participating in cellular component organization or biogenesis (42). Finally, in the RS vs. MS comparison, 328 DEGs were involved in cellular processes, and 315 in binding, with the fewest participating in macromolecular complex formation (51).

KEGG functional enrichment
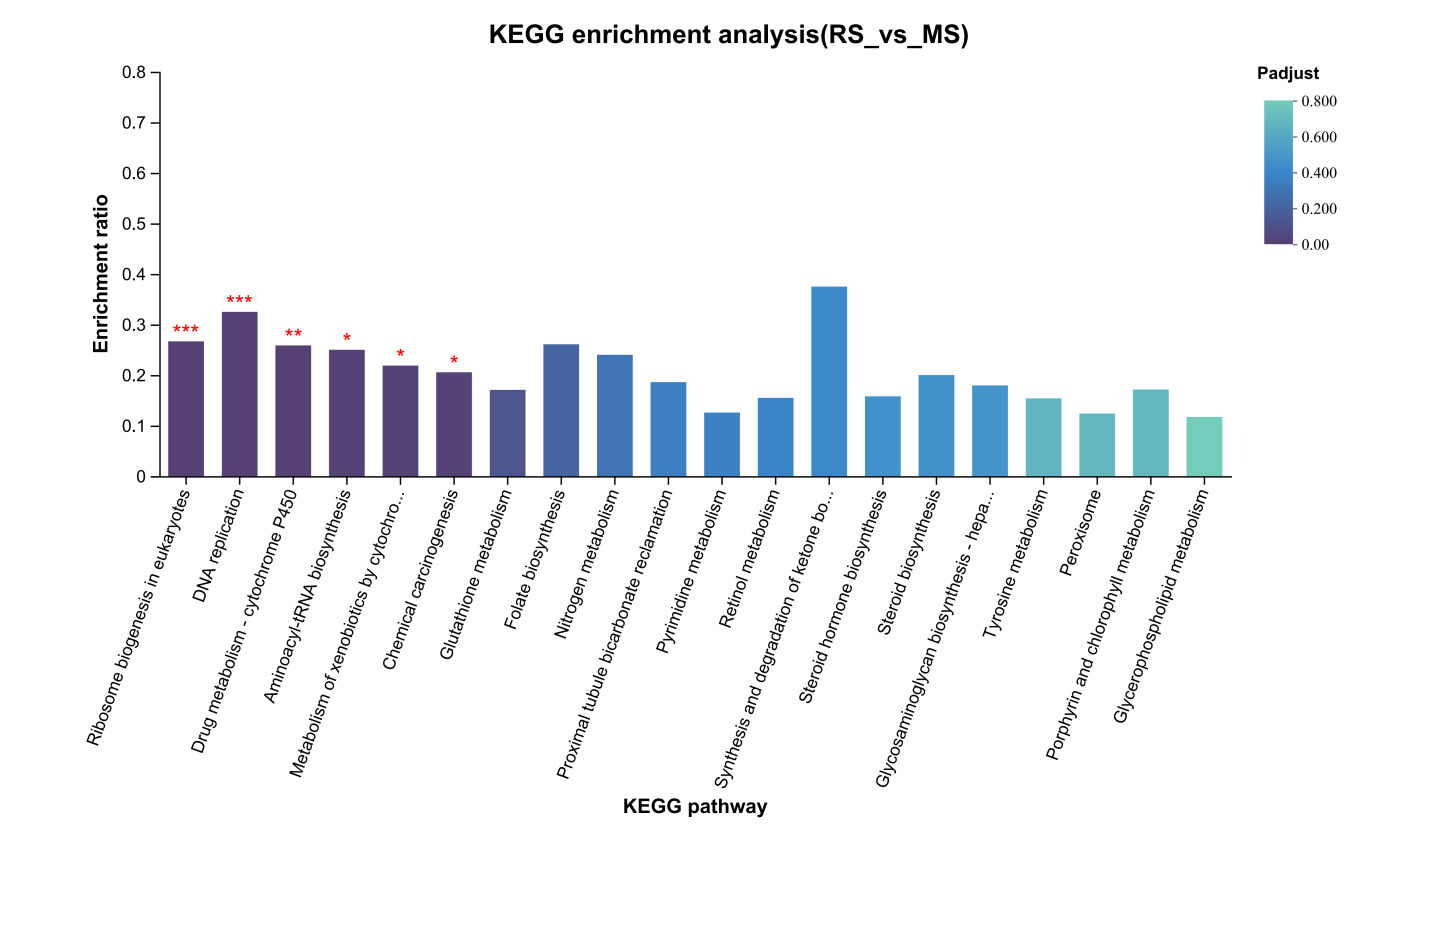
KEGG pathway enrichment analysis of unique DEGs from the RS vs. AS comparison (Figure 4) revealed significant enrichment (p < 0.05) in several pathways, including “DNA Replication,” “Drug Metabolism - Cytochrome P450,” “Metabolism of Xenobiotics by Cytochrome P450,” “Cell Cycle,” “Tyrosine Metabolism,” “Chemical Carcinogenesis,” “Steroid Biosynthesis,” “Pyrimidine Metabolism,” “Retinol Metabolism,” “Base Excision Repair,” and “Complement and Coagulation Cascades.” For the RS vs. YS comparison, the KEGG pathway enrichment analysis (Figure 5) demonstrated significant enrichment (p < 0.05) in 10 pathways, including “Protein Digestion and Absorption,” “Amoebiasis,” “Chemical Carcinogenesis,” “Metabolism of Xenobiotics by Cytochrome P450,” “Fat Digestion and Absorption,” “ECM-Receptor Interaction,” “Drug Metabolism - Cytochrome P450,” “Tyrosine Metabolism,” “Cytokine-Cytokine Receptor Interaction,” and “Retinol Metabolism.” Lastly, in the RS vs. MS comparison (Figure 6), only six KEGG pathways showed significant enrichment (p < 0.05), namely “Ribosome Biogenesis in Eukaryotes,” “DNA Replication,” “Drug Metabolism - Cytochrome P450,” “Aminoacyl-tRNA Biosynthesis,” “Metabolism of Xenobiotics by Cytochrome P450,” and “Chemical Carcinogenesis.”


Discussion
The variations in body color among fish species may be attributed to unique geographical environments, artificial breeding conditions, and selective breeding processes. This diversity not only reflects the fish’s adaptation to their habitat but also demonstrates the impact of human selection on fish phenotypic traits.13 Moreover, differential gene expression related to body color formation, particularly genes involved in the DNA replication pathway, highlights the significant role of the cell cycle and cellular proliferation in color variation.14 In organisms exhibiting significant color changes, the proliferation and maintenance of pigment cells require fine-tuned regulation to ensure proper distribution and renewal of pigments.15 Thus, the differential expression of DEGs in the DNA replication pathway may reflect changes in the cellular biological characteristics during the generation of pigment cells. Additionally, the involvement of the drug metabolism-cytochrome P450 pathway provides further insight into the complexities of color regulation.16 Cytochrome P450 enzymes participate in the metabolism of a variety of exogenous and endogenous compounds, including pigment precursors and hormones, and changes in their activity can directly affect pigment synthesis and degradation, thus influencing body color. Enzymes in the cytochrome P450 family are typically associated with the metabolic activities of various endogenous and exogenous compounds, including the transformation of carotenoid precursors such as β-carotene in organisms. Studies have found that the red color of tuna muscle is derived from carotenoids stored in the muscle, particularly astaxanthin.17 In tuna, cytochrome P450 enzymes are involved in the metabolism of astaxanthin, converting it into forms with higher biological activity for the fish, thereby maintaining the specific red hue of the muscle.18 In this study, transcriptome analysis revealed that a large number of differentially expressed genes (DEGs) are significantly involved in key biological pathways such as DNA replication, drug metabolism-cytochrome P450, and pigment biosynthesis.
Specifically, there were 932 DEGs identified between RS and AS, 1925 DEGs between RS and YS, and 1929 DEGs between RS and MS. This significant gene expression difference suggests the presence of a broad regulatory network at the molecular level in clownfish of different body colors, which may involve the formation and function of pigment cells. This finding reveals that the regulation of these biological pathways in clownfish with different body colors may be closely associated with the formation of color differences.
Most current research on fish body color focuses on aspects such as pigment cell metabolism, pigment deposition, and formation. Six types of pigment cells have been identified in fish, including melanocytes, xanthophores, erythrophores, iridophores, leucophores, and cyanophores.19,20 Studies often report that the early fading of body color in fish primarily involves the pathways of melanin formation and apoptosis. In the early developmental color changes of the bicolor damselfish,21 these changes are mainly caused by pigment transitions in the skin and scales, the recession of melanocytes, and the increase of red and yellow pigment cells. Melanocytes play a central role in the regulation of fish body color, as these cells are responsible for the production, storage, and transport of melanin, which determines the black or brown pigmentation of fish skin, scales, and eyes.22 According to studies, melanocytes control melanin production through complex biochemical pathways, regulated by specific hormones (such as α-MSH) and various enzymes (such as tyrosinase).23 This precise regulatory mechanism ensures effective pigment synthesis when needed. Research has shown that in zebrafish, α-MSH activates the cAMP-PKA signaling pathway by binding to receptors on the surface of melanocytes, thereby promoting melanin synthesis.24 Additionally, the dynamic distribution of melanosomes within cells provides fish with the ability to rapidly respond to environmental changes, such as adjusting body color according to the background to enhance or reduce concealment.25 Studies have found that zebrafish display different body colors against different backgrounds, related to the movement and distribution of melanosomes within melanocytes. In this study, from the comparison between the RS group and other groups, we noted that many DEGs in YS and MS groups are concentrated in pathways involving pigment deposition, pigment granule transport, and interactions between the extracellular matrix and receptors. The activation of these pathways may promote the functional expression of specific pigment cell types, such as an increase in the number or activity of melanocytes, thereby affecting the skin tone to be darker compared to the RS group.
Through high-throughput transcriptome analysis combined with Gene Ontology (GO) and KEGG pathway enrichment analyses, this study has revealed key biological processes and metabolic pathways influencing color differences in clownfish. In the comparison between RS and AS, pathways such as DNA replication and drug metabolism - cytochrome P450 were significantly enriched, suggesting a direct link with pigment production and regulation. Similarly, the comparisons between RS and YS, as well as RS and MS, also showed significant enrichment in several metabolic pathways related to body color. This may indicate that these pathways play a key role in regulating specific color phenotypes, possibly involving various aspects of pigment synthesis, transport, and degradation. For example, some pathways may involve intracellular signal transduction, regulating pigment cells’ response to environmental changes, thereby modulating color changes to adapt to different environmental conditions.26 These findings not only provide important insights into the molecular mechanisms behind color variation in A. ocellaris but also have significant implications for breed improvement and selection in aquaculture. As body color is a key quality attribute in the ornamental fish market, a deeper understanding of its molecular basis can help guide aquaculture practices, thereby optimizing breeding varieties.
This investigation leveraged high-throughput transcriptome sequencing to comprehensively analyze the molecular determinants of color variation across four A. ocellaris variants, designated as RS, AS, YS, and MS. Through this approach, we identified a multitude of differentially expressed genes (DEGs) significantly linked to color variation. Subsequent Gene Ontology (GO) and Kyoto Encyclopedia of Genes and Genomes (KEGG) pathway enrichment analyses were performed to delineate the roles of these genes in biological processes and their participation in crucial metabolic pathways. Our findings disclosed 270 common DEGs across the variants, with notable discrepancies in gene expression; specifically, 932, 1925, and 1929 DEGs were upregulated and downregulated in AS, YS, and MS, respectively, compared to RS. The GO analysis indicated a predominance of DEGs associated with cellular processes. Moreover, KEGG analysis suggested that the observed color variations might be linked to pathways such as DNA replication, cytochrome P450-mediated drug metabolism, and pigment biosynthesis, thereby influencing pigmentation. These insights not only enrich our understanding of the molecular basis of color variation in A. ocellaris but also provide theoretical guidance for breeding improvements in aquaculture. In future experiments, we will explore how these genes are regulated in response to different environmental conditions, providing insights into both genetic and epigenetic factors influencing pigment cell differentiation and function.
Acknowledgments
This project was supported by grants from the Hainan Provincial Natural Science Foundation of China (320QN360) and the Central Public-Interest Scientific Institution Basal Research Fund, CAFS (2025XT03).
Authors’ Contribution
Conceptualization: Jing Hu (Equal), Zhenhua Ma (Equal). Data curation: Jing Hu (Equal), Junhua Huang (Equal). Investigation: Jing Hu (Lead). Methodology: Jing Hu (Equal), Zhenhua Ma (Equal). Project administration: Jing Hu (Lead). Resources: Jing Hu (Lead). Software: Jing Hu (Equal), Junhua Huang (Equal). Validation: Jing Hu (Equal), Junhua Huang (Equal). Writing – original draft: Jing Hu (Equal), Junhua Huang (Equal). Writing – review & editing: Jing Hu (Lead). Supervision: Zhenhua Ma (Lead).
Competing of Interest – COPE
The authors declare that they have no known competing financial interests or personal relationships that could have appeared to influence the work reported in this paper.
Ethical Conduct Approval – IACUC
All procedures were conducted in accordance with the “Guiding Principles in the Care and Use of Animals” (China).
Informed Consent Statement
All authors and institutions have confirmed this manuscript for publication.
Data Availability Statement
All are available upon reasonable request.