
Introduction
Aquaculture is a rapidly growing sector contributing significantly to global food security. Cemented ponds are increasingly used in aquaculture due to their durability and ease of maintenance. However, these systems often suffer from poor water quality and low natural productivity, which can limit fish growth and health. In cemented ponds, the absence of soil means that natural processes, such as the mineralization of organic matter and the release of essential nutrients (like nitrogen and phosphorus), are limited. This results in fewer nutrients available for plankton growth, which is a primary food source for many aquatic species. Additionally, the water retention capacity of cemented ponds is less efficient, often leading to temperature fluctuations, oxygen depletion, and increased accumulation of waste products like ammonia and nitrite. These factors can stress the aquatic organisms, reduce growth rates, and increase susceptibility to diseases, ultimately impacting the overall productivity of the pond.1
Vermicompost, a product of organic waste decomposition by earthworms, is rich in nutrients and beneficial microorganisms. This study explores the potential of vermicompost to optimize water quality and enhance plankton production, providing a sustainable alternative to chemical fertilizers.1
Vermicompost is known for its high content of essential nutrients, including nitrogen, phosphorus, and potassium, as well as trace elements and beneficial microbes.2 These properties make it an excellent organic fertilizer for enhancing soil and water quality. Maintaining optimal water quality is crucial for successful aquaculture. Key parameters include pH, DO, and concentrations of nitrogenous compounds. Poor water quality can lead to fish stress and disease outbreaks.3 Several studies also reveal that vermicompost application increases the survival rate of different fish species while utilizing fewer economic inputs.4–6 This is due to its potential to optimize water quality and promote pond primary productivity.
Since plankton serves as a primary food source for many fish species, especially in the early stages of development, enhancing plankton biomass can improve fish growth rates and overall pond productivity. However, the impact of vermicompost in providing conducive water quality and plankton production is not explored clearly. This is because many of the experiments4–6 were carried out in the presence of fish, which have their own impact on water quality and pond primary productivity. Therefore, this study aims to investigate the effect of vermicompost on water quality and plankton production, minimizing the effects of fish on the result.
Materials and Methods
The experimental study was conducted from April 2024 - May 2024 for 4 weeks, in Sidama Agricultural Research Institute (SARI) fisheries research center. Four cemented tanks (size 12.5 m3 each, 5 m x 2.5 m x 1 m) were used as a control tank (without fertilizer), Treatment 1 (5,000kg/ha/yr vermicompost), treatment 2 (10,000kg/ha/yr vermicompost) and treatment 3 (15,000kg/ha/yr vermicompost). The vermicompost application rate of 10,000kg/ha/yr was reported to be most productive in plankton abundance and species diversity, hence graded levels of vermicompost levels 5,000kg/ha/yr, 10,000kg/ha/yr and 15,000kg/ha/yr was used. Each pond was first cleaned and left to dry with sunlight as a means to reduce microorganisms. A volume of 12.5m3 water was added to the ponds that were obtained from deep wells, and was periodically added to these ponds, i.e. every 2 to 3 days, to compensate for the loss from evaporation and seepage. The water depth of the pond varies between 0.9 and 1 m. Periodic application of vermicompost provides an energy base for bacterial activities and replenishment of nutrients in the media. First, 25% of the vermicompost was applied 15 days before the onset of the experiment; the rest of the compost was applied equally in one-week intervals.
Water quality parameters (Dissolved oxygen ‘DO’, pH, Water temperature, ammonia concentration) were measured weekly from each pond. Plankton abundance and taxa composition were determined bi-weekly. Plankton samples were collected using a plankton net. Plankton were counted using a Sedgewick Rafter cell counter under a binocular microscope.
Preparation of vermicompost
Spent Mushroom Substrate (SMS) was pre-composted (by sprinkling with water and stirring for 2 weeks) and then inoculated with earthworm, Eisenia fetida. The pre-composting is necessary to reduce anaerobic conditions and increase substrate palatability to the earthworms. Vermicomposting was done in a pit. The size of each pit was 0.25 m3 (2m x 0.5 m x0.5m) on a rectangular plot with an erected shed.
Water quality, plankton abundance and their nutrient content
Water quality samples were collected at seven days intervals. Dissolved oxygen (mg L−1), pH and water temperature (0C) were measured each week from three different spots in each treatment using a portable DO meter (DO-5509, AF-11581, Taiwan), a digital pH meter, and a thermometer, respectively. Water samples were also collected from each spot in a 200 ml plastic bottle to determine ammonia level (mg L−1) in the laboratory. Ammonia was determined using a spectrophotometer; total alkalinity and hardness were measured by the titrimetric method using a 0.2 N H2SO4, titrant ethylene diamine tetra-acetic acid (EDTA), respectively.7 Stirling8 protocol was used for plankton abundance estimation by using a Sedgewick Rafter cell (S-R cell) and a compound microscope with 10x, 40x and 100x magnification. Plankton biomass of the pond water was also analyzed at fortnight intervals by filtering 3 liters of water from five spots through a bolting silk cloth of 20 µm and 50 µm mesh size for phytoplankton and zooplankton. The concentrated samples were transferred to a measuring cylinder and carefully made up to a standard volume of 50 ml with distilled water. The collected plankton samples were then preserved in 10% buffered formalin in small plastic bottles each for subsequent studies.
The determination of the percentage species abundance of plankton was done following the method of Bagenal.9 The quantitative estimation of plankton was done by using the following formula: N = (A × 1000 × C) / (V × F × L)10; Where, N = Number of plankton cells or units per liter of the original water, A = Total number of plankton counted, C = Volume of final concentrate of the sample in ml, V = Volume of a field in cubic mm, F = Number of fields counted and L = Volume of original water in liter.
Results
Vermicompost composition
The chemical composition of the vermicompost used in the study is summarized in Table 1. The vermicompost exhibited a near-neutral pH, moderate electrical conductivity (EC), and a balanced carbon to nitrogen (C/N) ratio.
Water Quality Improvement
As depicted in table 2 the application of vermicompost improved some water quality parameters in the cemented aquaculture ponds; however, significant changes were seen in turbidity and electrical conductivity parameters (P=0.05). Vermicompost application enhanced DO levels in all treatments compared to the control. Treatment 3 (15,000kg/ha/yr vermicompost) showed the highest increase in DO levels by Day 15. The pH levels were stabilized and slightly increased in all treatment ponds, maintaining an optimal range for aquaculture. Water temperature showed minor variations among treatments, with a slight decrease over time. Ammonia levels were reduced in all vermicompost treatments, with the lowest levels observed in Treatment 3. EC values increased slightly in all treatments, indicating an increase in ion concentration in the water.
Plankton Production
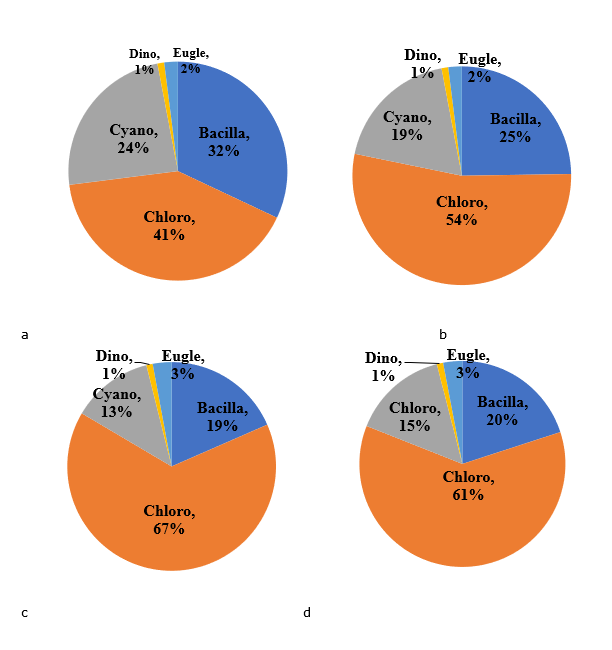
Higher vermicompost application rates resulted in a significant increase in plankton diversity and abundance, with a notable rise in both phytoplankton and zooplankton populations. The results demonstrated a significant increase in both phytoplankton and zooplankton diversity and abundance in response to the application of vermicompost. Overall, plankton taxa found in ponds are depicted in Table 3, while Table 4 shows their volumetric percentage composition based on taxa. Volumetric taxa percentage composition is also shown as a pie chart in Figures 1 and 2.


The analysis of variance among the treatments revealed significant differences in the abundance of phytoplankton, zooplankton, and total plankton counts across the treatment groups (T1, T2, T3, and T4) (p < 0.001). The R-squared values indicate that the models accounted for a substantial proportion of the variance in plankton abundance, with values of 0.800, 0.874, and 0.886 for phytoplankton, zooplankton, and total plankton, respectively. Additionally, the strong correlation coefficients (0.894 for phytoplankton, 0.935 for zooplankton, and 0.941 for total plankton) suggest a robust positive relationship between the application of vermicompost and plankton abundance (Table 5).
Phytoplankton abundance showed a significant increase from T1 (45.63*103) to T4 (66.17*103). The mean values significantly differ, with T4 exhibiting the highest abundance, followed by T3, T2, and T1, which were statistically similar to each other. This trend indicated that higher application rates of vermicompost positively influenced phytoplankton growth, likely due to enhanced nutrient availability and improved water quality in the aquaculture ponds. The R-squared value of 0.800 suggests that the treatment explains 80% of the variability in phytoplankton abundance, which is substantial.
Similarly, zooplankton abundance increased significantly across treatments, with values ranging from 3.7 thousand in T1 to 9.93 thousand in T4. The differences in means are statistically significant, indicating that the application of vermicompost directly impacted zooplankton populations. The positive correlation (0.935) highlights a strong relationship between treatment applications and zooplankton abundance. The R-squared value of 0.874 indicated that 87.4% of the variability in zooplankton abundance can be attributed to the treatment effects.
The total plankton count also showed significant variation across treatments, with T4 having the highest abundance at 76.1 thousand, compared to T1 at 49.33 thousand. The data suggest that increasing the application rate of vermicompost not only boosts phytoplankton and zooplankton individually but also enhances overall plankton abundance, contributing to a healthier aquaculture ecosystem. The strong correlation coefficient (0.941) reinforces the idea that higher nutrient levels foster greater plankton productivity, crucial for the growth of the Nile tilapia in these systems.
Discussion
Water quality
The increase in DO levels in the first 15 days can be attributed to enhanced photosynthesis by phytoplanktons where their numeric increment is facilitated by the nutrients and organic matter in vermicompost. After 15 days, excess organic matter is assumed to be collected on the pond bottom which increases aerobic decomposition by bacteria, hence it decreases the DO levels. The stabilization of pH levels within the optimal range is essential for the physiological processes of fish and other aquatic organisms. The reduction in ammonia and nitrate concentrations is particularly noteworthy, as these compounds are toxic to fish at high levels.11
The decline in DO by Day 30 raises concerns about the potential for oxygen depletion due to organic matter breakdown, which can lead to increased biochemical oxygen demand (BOD). This aligns with findings from previous studies that highlight the importance of balancing nutrient input with microbial respiration rates to maintain optimal oxygen levels in aquatic systems.12
The increase in pH levels across treatments may be indicative of higher carbon dioxide uptake by primary producers, as well as potential ammonia volatilization. Alkaline conditions can affect nutrient availability, particularly for phosphorus and nitrogen species, which are crucial for algal growth.13 While higher pH levels can promote algal blooms, they may also pose risks for certain aquatic organisms that are sensitive to such changes. The results suggest that careful management of vermicompost application rates is necessary to prevent adverse effects on aquatic life.
The marked increase in turbidity, especially in T4, indicates a rise in suspended particles likely due to organic matter from the vermicompost. Elevated turbidity can hinder light penetration, adversely affecting photosynthetic organisms and potentially leading to shifts in community structure14The significant turbidity observed in high-application treatments suggests that monitoring and managing sediment resuspension is crucial, particularly in aquaculture systems where light availability is critical for the growth of phytoplankton.
The reduction in ammonia levels across treatments highlights the potential of vermicompost to enhance nutrient cycling within the system. As vermicompost improves microbial populations, it can facilitate the conversion of ammonia to less toxic forms through nitrification processes. This is particularly relevant in aquaculture, where ammonia accumulation can be detrimental to fish health15The observed trends suggest that vermicompost can be an effective strategy for mitigating ammonia toxicity in aquaculture environments.
Plankton Diversity and Abundance
The dominance of Chlorophyta and a stable presence of zooplankton across treatments suggest a productive and balanced aquatic ecosystem essential for enhancing fish growth and overall pond productivity. These findings underscore the effectiveness of vermicompost in promoting healthy aquatic environments conducive to sustainable aquaculture practices. The increase in plankton diversity and abundance with higher vermicompost application rates emphasizes the role of nutrient enrichment in supporting aquatic food webs. The substantial increase in Chlorophyta, especially in T2 and T3, indicates a favorable response to the nutrient influx, which is consistent with literature suggesting that nutrient-rich environments can enhance primary productivity.16 Furthermore, the stable populations of zooplankton across treatments reflect a healthy food web, where increased phytoplankton biomass supports higher trophic levels. The results of this study have significant implications for aquaculture management practices. Applying vermicompost at moderate rates (e.g., T2 or T3) appears to enhance water quality and promote plankton production without causing detrimental effects such as excessive turbidity or reduced oxygen levels. This balanced approach could lead to more sustainable aquaculture systems, improving not only production but also the overall health of aquatic ecosystems.
Phytoplankton Diversity and Abundance
The results indicate that Chlorophyta exhibited the highest percentage abundance, particularly in treatments T2 (54%) and T3 (67%). This increase can be attributed to the nutrient enrichment provided by vermicompost, which supplies essential macro- and micronutrients that facilitate phytoplankton growth. Chlorophytes are often dominant in nutrient-rich environments, as they can rapidly utilize available nutrients for growth.17 This observation aligns with previous studies indicating that organic amendments, such as vermicompost, significantly enhance phytoplankton biomass and diversity in aquatic ecosystems.18
In contrast, the abundance of Bacillariophyta (diatoms) was highest in T1 (32%) but decreased in the higher treatments. This shift may suggest a competitive advantage for Chlorophyta in nutrient-rich conditions, where faster growth rates can outcompete diatoms for light and nutrients. This finding is important because it indicates potential changes in the primary producer community structure, which can influence overall productivity and energy transfer within the food web.
Zooplankton Composition
The composition of zooplankton, particularly Crustacea (61% in T1 and 68% in T2), illustrates a strong relationship between phytoplankton abundance and zooplankton populations. The stable presence of zooplankton across all treatments indicates a well-functioning food web where increased phytoplankton biomass supports higher trophic levels. This correlation highlights the role of primary producers in providing a food source for zooplankton, which are essential for the transfer of energy to higher trophic levels, including fish.19
Interestingly, the relatively consistent presence of Rotifera (29% in T1 and increasing to 38% in T3) suggests that this group of organisms may also benefit from the nutrient-rich conditions created by vermicompost application. Rotifers play a crucial role in nutrient cycling and can act as indicators of water quality. Their increased abundance in treatments with higher vermicompost applications indicates that the overall ecosystem health may be improving, promoting a diverse and stable zooplankton community.
Implications for Aquaculture Management
The observed shifts in plankton community structure emphasize the importance of managing nutrient inputs in aquaculture systems. The enhancement of chlorophyte populations can lead to increased primary productivity, which may improve fish growth rates and overall yields. However, it is crucial to monitor the balance of nutrient inputs to avoid potential negative impacts, such as algal blooms or decreased water quality due to high turbidity. The enhanced total plankton abundance across treatments suggests a thriving aquatic ecosystem, highlighting the efficacy of vermicompost in promoting productivity within the aquaculture ponds. These findings provide valuable insights into the role of organic amendments in supporting sustainable aquaculture practices.
Moreover, the presence of diverse zooplankton populations indicates a healthy ecosystem capable of supporting fish and other higher trophic levels. This relationship underscores the need for sustainable practices in aquaculture, such as the strategic use of organic amendments like vermicompost, to enhance nutrient availability while maintaining water quality and biodiversity.
Acknowledgments
This publication was funded by SAABRON PRESS (TX, USA) and the nonprofit AqaucltureHub (TX, USA) for the graduate student Mr. Wondwosen Dejene Kebede of Werabe University, Worabe, Ethiopia.
Authors’ Contribution
Conceptualization: Wondwosen D. Kebede (Equal), Pavanasam Natarajan (Equal). Methodology: Wondwosen D. Kebede (Equal), Shiferaw Worku (Equal). Formal Analysis: Wondwosen D. Kebede (Lead). Investigation: Wondwosen D. Kebede (Lead). Writing – original draft: Wondwosen D. Kebede (Lead). Writing – review & editing: Wondwosen D. Kebede (Equal), Shiferaw Worku (Equal). Resources: Wondwosen D. Kebede (Lead). Supervision: Pavanasam Natarajan (Equal), Shiferaw Worku.
Competing of Interest – COPE
No competing interests were disclosed.
Ethical Conduct Approval – IACUC
Ethical approval was given to the researchers by Hawassa University for conducting this research.
Informed Consent Statement
All authors and institutions have confirmed this manuscript for publication.
Data Availability Statement
All are available upon reasonable request.