


Introduction
Striped catfish (Pangasianodon hypophthalmus) farming has experienced rapid development in the Mekong Delta since 1996, following the successful introduction of artificial breeding techniques. Today, the species is intensively cultivated in earthen ponds throughout the region. This species is well accepted in commercial aquaculture systems due to high-stress tolerance, disease resistance, and consumer demand.1 Striped catfish is farmed in earthen ponds in nine provinces in the Mekong Delta in South Vietnam. Over the years, the striped catfish farming and processing industry in Vietnam has been constantly developed and become a spearhead economic sector of Vietnam, which has become a leading part of international economic integration.2 The striped catfish is the main farming species of Can Tho City, with a farming area of 10 hectares, a harvesting area of 17 hectares, and an estimated output of 5,914 tons.3 However, large-scale pangasius farming also poses a risk of polluting the water environment because farmers must provide large amounts of food for the fish. Typically, fish only use a portion of the food provided in the pond; the rest is discharged into the water environment, thereby increasing the nutrient content in the water. In addition, waste products from fish also contribute to increasing the source of nutrients in the water, creating conditions for harmful algae to grow and dominate. Toxins from the decomposition of waste in ponds degrade water quality and cause more diseases. To control diseases, farmers use large amounts of chemicals for prevention and treatment. These chemicals accumulate in the fish’s body and the water, which eventually affects the survival rate and growth of fish.4
Effective water quality management is essential for optimizing the growth and health of pangasius in aquaculture ponds. A nutrient-rich aquatic environment can significantly stimulate the proliferation of blue-green algae (cyanobacteria). Elevated concentrations of nutrients, particularly phosphates, have been shown to promote the intensity and frequency of cyanobacterial blooms.5 Blooms of Microcystis aeruginosa can lead to significant fluctuations in pond water quality, potentially impairing the growth of aquatic organisms and, in severe cases, resulting in their mortality.6,7 In particular, Microcystis microalgae can secrete toxins that are harmful to aquatic animals.8 The toxins produced by blue-green algae bloom are called microcystins, which can damage and disrupt the structure of liver cells, cause hemorrhage, and impede blood circulation.9 In addition, poor water quality can hinder fish growth and create favorable conditions for the proliferation of pathogens. Cyanobacterial blooms frequently occur in catfish ponds, but the potential effects of their secondary metabolites on cultured animals in ponds and human beings remain largely unknown.10 Varying concentrations of blue-green algae can have differential effects on the growth performance of pangasius. This study was conducted to assess the impact of blue-green algae on water quality and the growth of striped catfish in an indoor tank culture system. The results will serve as a valuable reference for future research on the relationship between algal presence and the quality of Pangasius meat. Ultimately, the findings aim to support farmers in implementing effective water quality and algae management strategies, thereby enhancing the overall productivity and sustainability of Pangasius aquaculture operations.
Materials and Methods
Study location and time
The study was conducted from January 2024 to August 2024 at Hydrobiology Laboratory, College of Aquaculture and Fisheries, Can Tho University.
Experimental design
The study was randomly arranged in 12 composite tanks with a volume of 0.5 m3, divided into 4 treatments, each treatment was repeated 3 times. The experiment was arranged with 20 fish in a tank with a weight of about 0.12-0.13 kg fish-1 and a length of 21-23 cm. The fish were fed with industrial feed (con co C5006) with a protein content of 26%, particle size of 2-3 mm/pellet. The feeding dose ranged from 0.8-2% of the fish weight. Feeding was done twice a day (morning from 7-8 am and afternoon from 3-4 pm).
Blue-green algae (Microcystis aeruginosa) was isolated from pangasius ponds in O Mon and Thot Not districts, Can Tho City, Vietnam. After isolation, the blue-green algae were stored and mass cultured in the Live Food laboratory to provide an amount of algae for the experiments. Algae density was added once on the first day of the experiment. Cyanobacterial algae were counted by the Bucker chamber according to Coutteau.11 During the first month stage, the water was not changed; only the lost water was added. Water changes were made from the second month till the trial ended. The water change cycle occurred every two weeks, at a rate of approximately 20-30%. The experiment duration was about 5.5 months.
Treatment 1 (Control): no cyanobacteria (M. aeruginosa) added
Treatment 2 (T10): M. aeruginosa added at a density of 10 million cells L-1
Treatment 3 (T30): M. aeruginosa added at a density of 30 million cells L-1
Treatment 4 (T50): M. aeruginosa added at a density of 50 million cells L-1
_experimental_system_and_(1b)_cyanobacteria_*(m._aeruginosa)*.png)
Sample collection and analysis methods
Water quality metrics were measured once a week. The methods for collecting and evaluating water environment parameters such as temperature, pH, dissolved oxygen (DO), alkalinity, total suspended solids (TSS), total ammonium nitrogen (TAN), orthophosphate (PO43-), chlorophyll-a, and nitrate (NO3-) is presented in detail in Table 1.
Growth performance of striped catfish
Growth performance indices determined in the experiment included survival rate (SR), weight, length, Specific growth rate (SGR), and feed conversion ratio (FCR). The formulas are as follows:
FCR = Total feed consumed/Total weight gain
SR (%) = (total number of shrimp at the end of experiment/ total number of initial shrimp) x 100
SGR-weight (%/day) = 100 x (LnWt – LnWo)/t
SGR-length (%/day) = 100 x (LnLt – LnLo)/t
Where: Wo: initial body weight (g)
Wt: final body weight (g)
Lo: initial body length (g)
Lt: final body length (g)
T: maintenance time (days)
Data analysis
The data after analysis was compiled by tank and collection times, and figures were generated using Microsoft Excel software. Data are presented as mean ± standard deviation. Correlation between water quality parameters and chlorophyll-a, as well as variations in growth elements of striped catfish among treatments were analyzed using One-way ANOVA by SPSS 22.0 software.
Results
Water quality parameters in the striped catfish tanks
Temperature and pH
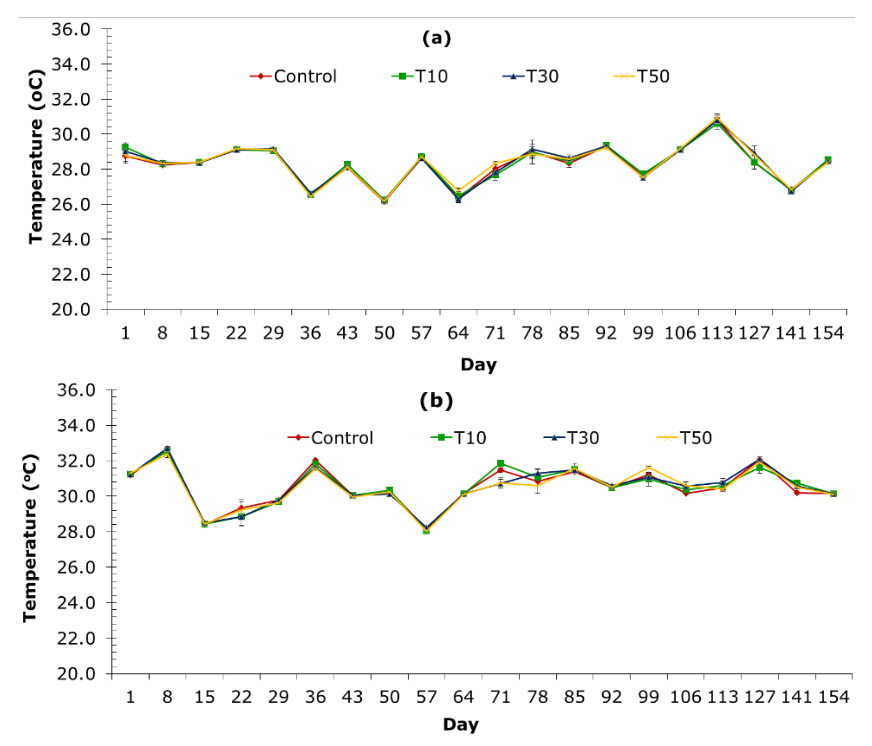
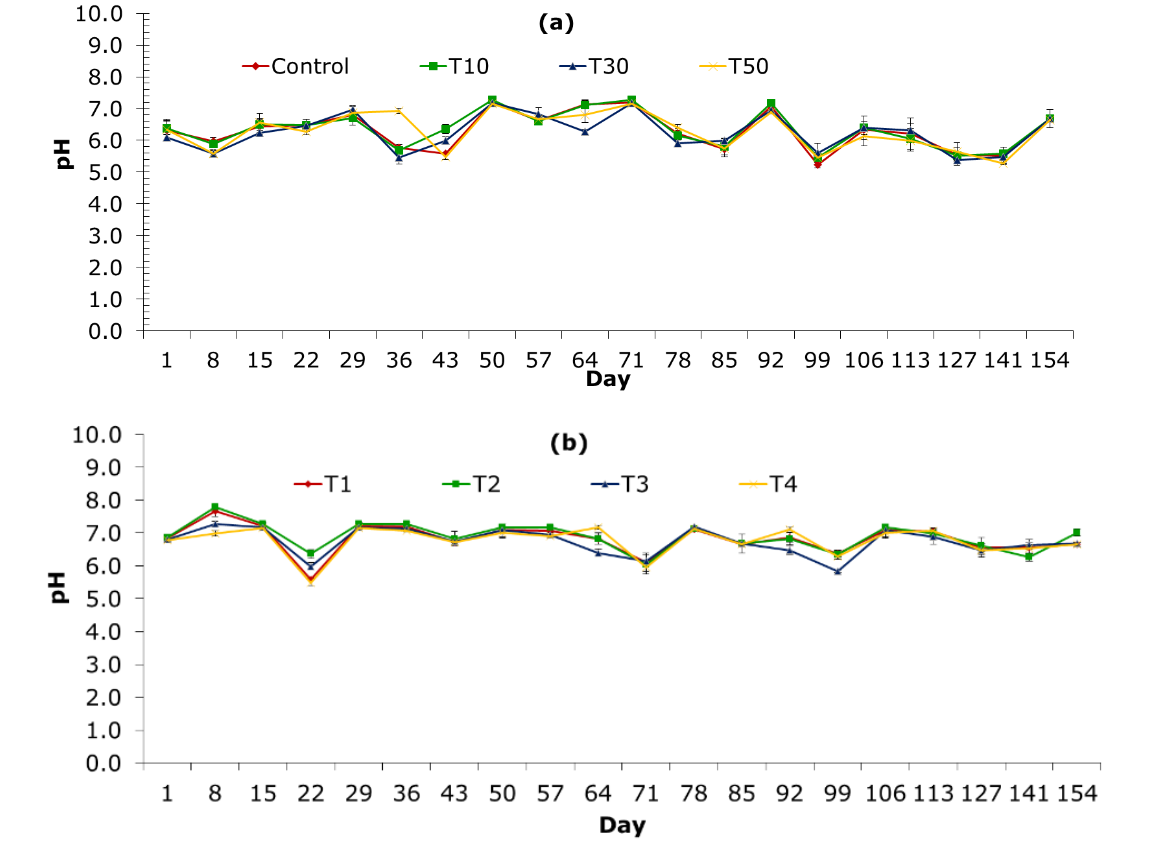
The temperature in the catfish tanks changed significantly during sample intervals, ranging from 26.1±0.12 to 32.7±0.1oC (Figure 2). Temperatures measured in the morning and afternoon varied from 26.1±0.12 to 30.9±0.15oC (Figure 2a) and 28.0±0.06 to 32.7±0.44oC, respectively (Figure 2b). The temperature value was discovered in the experiment to be the lowest in treatment control at the 50-day period in the morning and the highest in treatment T30 in the afternoon at the 8-day period. The temperature did not differ significantly between treatments during the sampling periods. Similarly, pH values measured during sampling periods ranged from 5.58±0.2 to 7.78±0.11 (Figure 3). The morning pH in the pangasius tanks ranged from 5.58±0.2 to 7.27±0.09 (Figure 3a), whereas the afternoon pH ranged from 5.84±0.08 to 7.78±0.11 (Figure 3b).
_and_afternoon_(b).png)
_and_afternoon_(b).png)
Dissolved oxygen
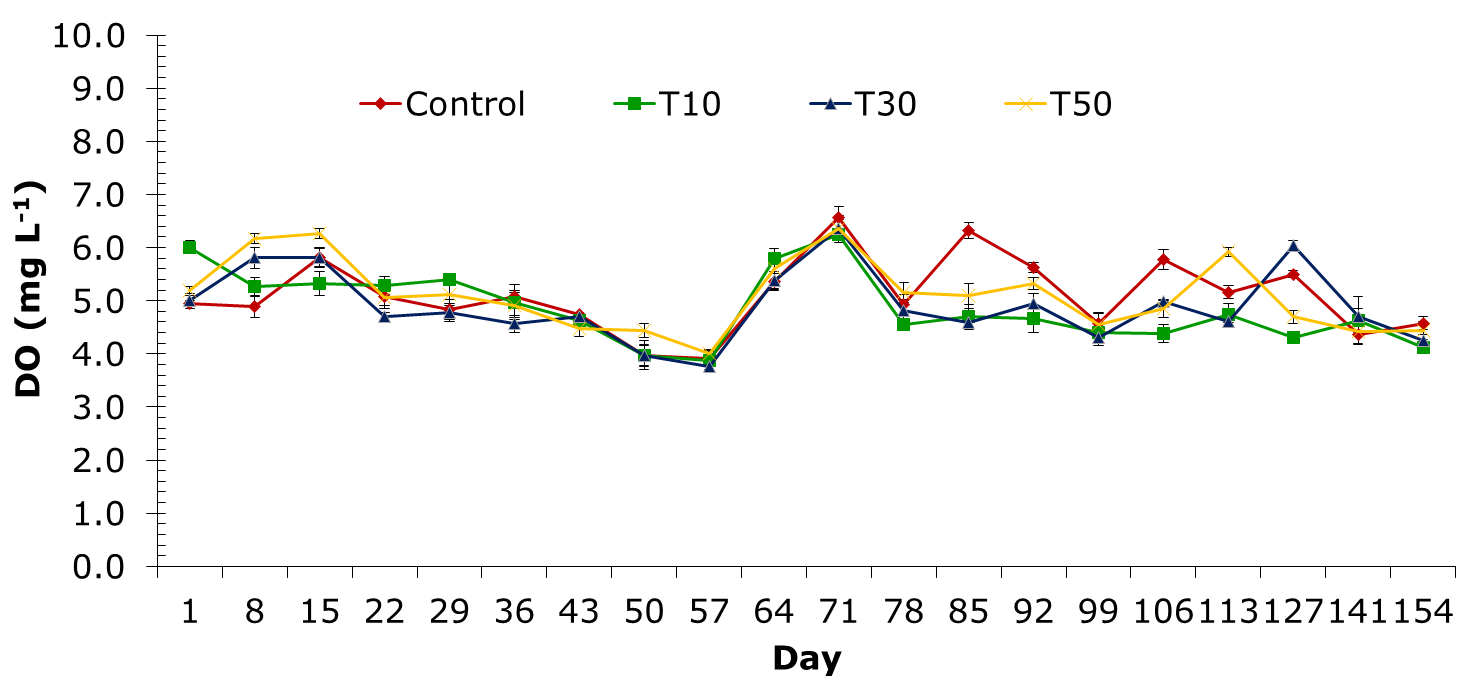
The average DO content of the treatments ranged from 4.13±0.14 to 6.56±0.38 mg L-1 (Figure 4). The DO content was lowest at 57 days and highest at 71 days. In the control treatment, the recorded DO content ranged from 4.30±0.3 to 6.56±0.38 mg L-1. The treatments supplemented with blue-green algae had a tendency to decrease the DO content lower than the control treatment from 85 to 106 days. The DO content varied from 4.13±0.14 to 6.24±0.06 mg L-1; 3.25±0.18 to 6.35±0.44 mg L-1, and 4.34±0.45 to 6.35±0.29 mg L-1 for treatments T10, T30, and T50, respectively (Figure 4).

Alkalinity
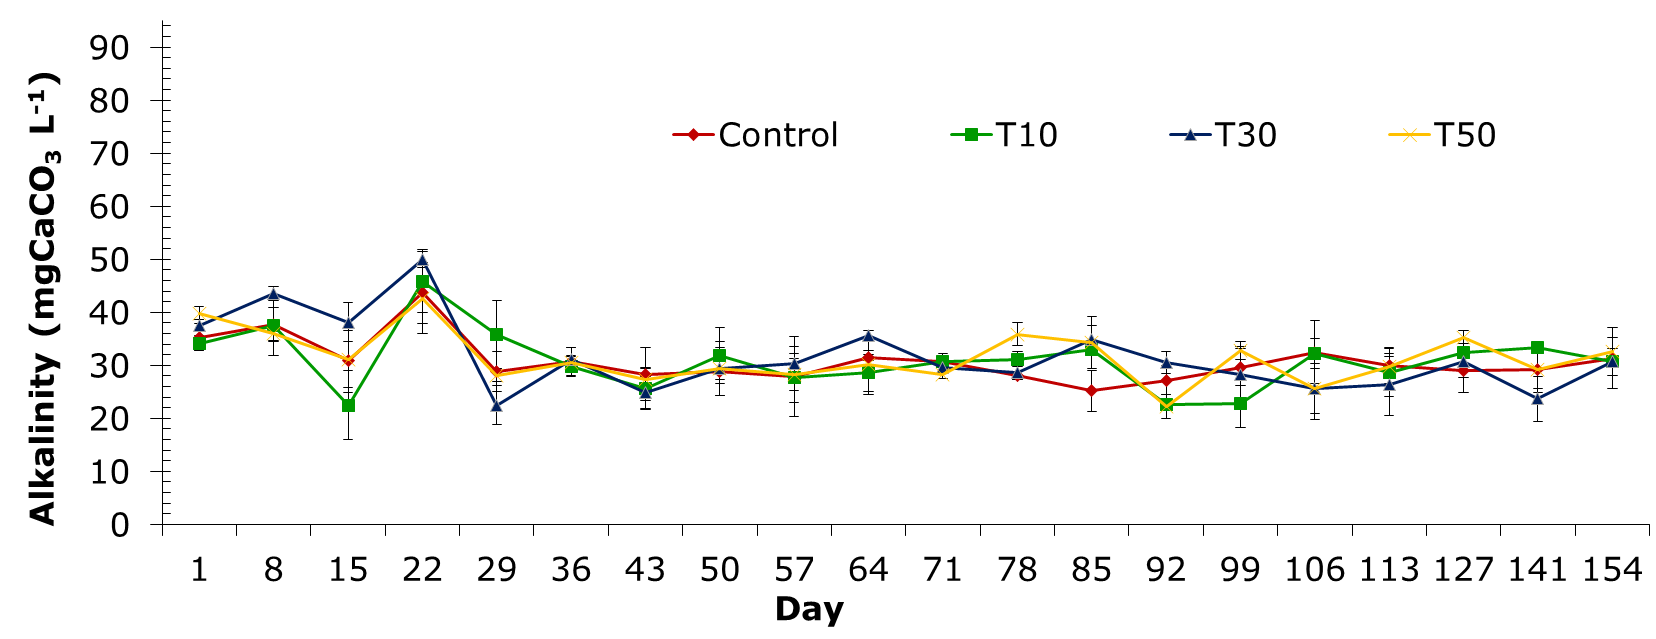
The alkalinity of the treatments was maximum at 22 day period and varied insignificantly from 36-day stage to the end of the experiment. Alkalinity recorded through sampling periods of the treatments ranged from 22.2±2.3 to 50.0±2.6 mgCaCO3 L-1 (Figure 5). Alkalinity in the control treatment (T1), and treatments supplemented with blue-green algae at different densities varied from 25.2±3.4 to 43.7±5.7 mgCaCO3 L-1; 22.5±11.1 to 45.8±4.5 mgCaCO3 L-1; 22.5±10.9 to 50.0±2.6 mgCaCO3 L-1 and 22.7±2.3 to 42.6±2.1 mgCaCO3 L-1 for treatments T10, T30 and T50, respectively.

Total Suspended Solid
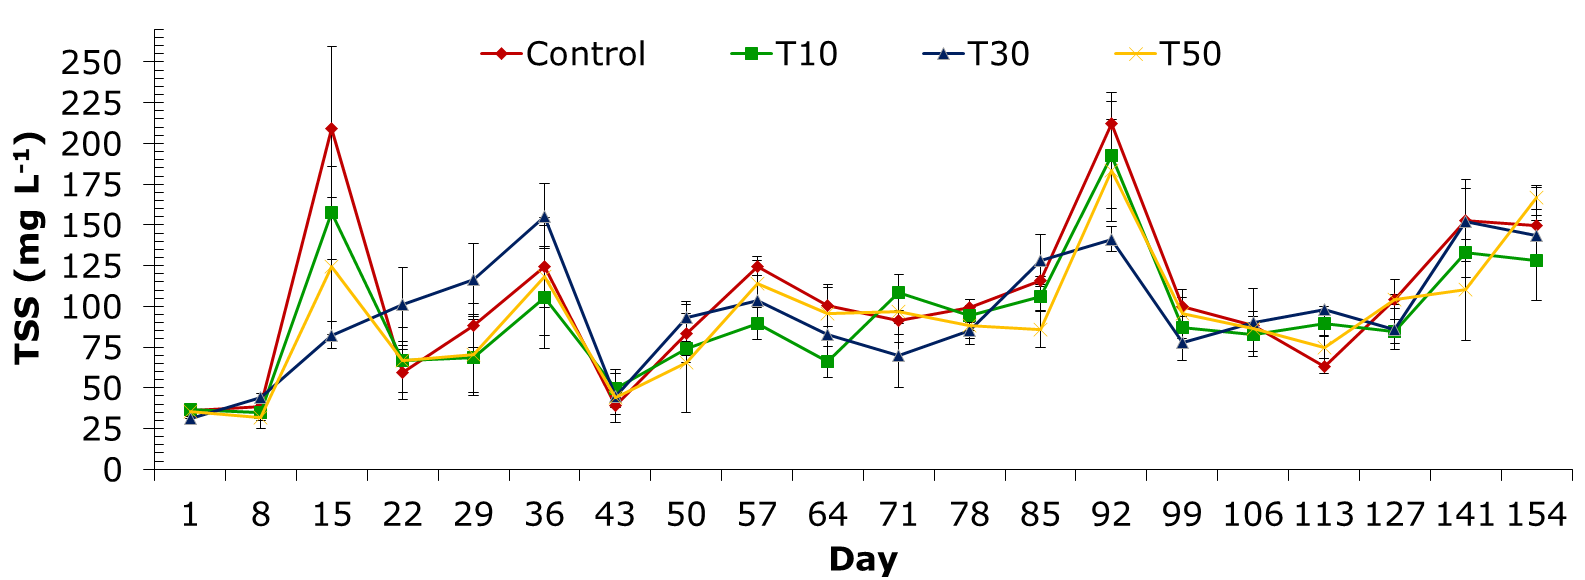
The TSS concentration of the treatments ranged from 31±5.5 to 212±47.3 mg L-1. TSS values in treatment T1 varied from 36±7.2 to 212±47.3 mg L-1. Treatments with blue-green algae showed TSS content ranging from 35±8.9 to 193±81.4 mg L-1; 31±5.5 to 155±55.9 mg L-1; and 32±8.5 to 183±56.6 mg L-1 for treatments T10, T30, and T50, respectively. TSS level was low in the 8-day period but rose in the 15-day and 92-day phases of the culture cycle (Figure 6).

Total ammonia nitrogen
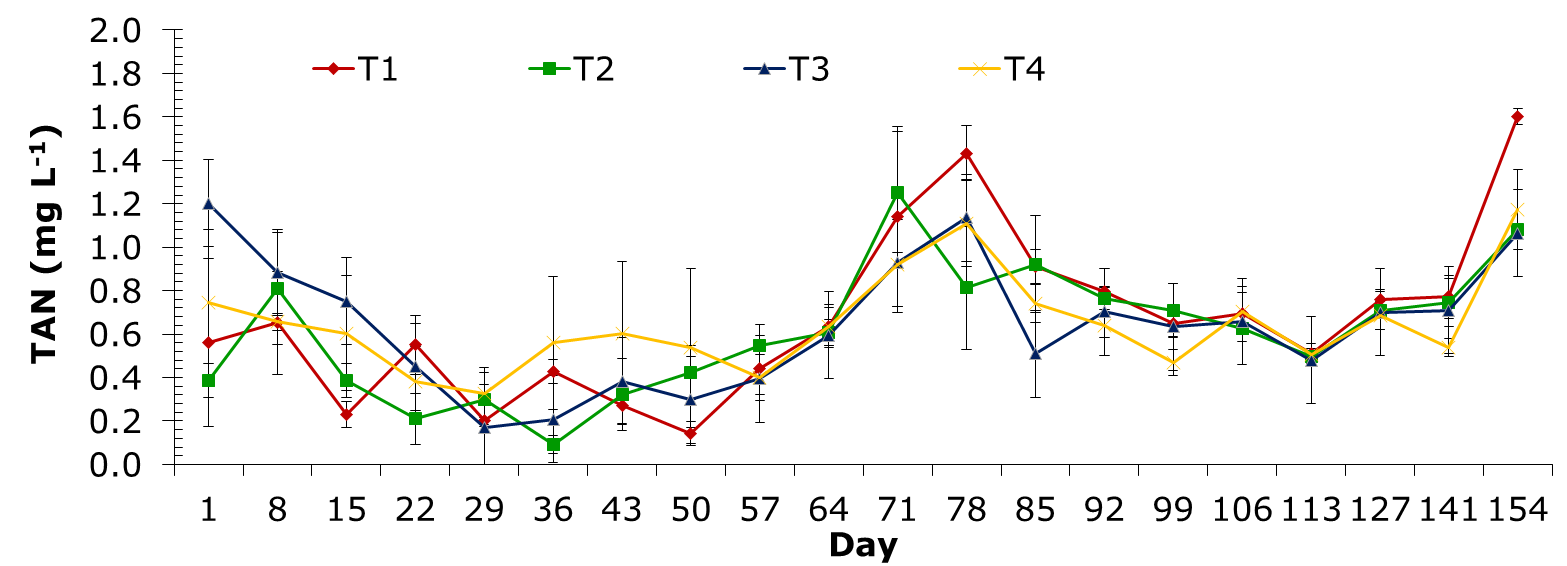
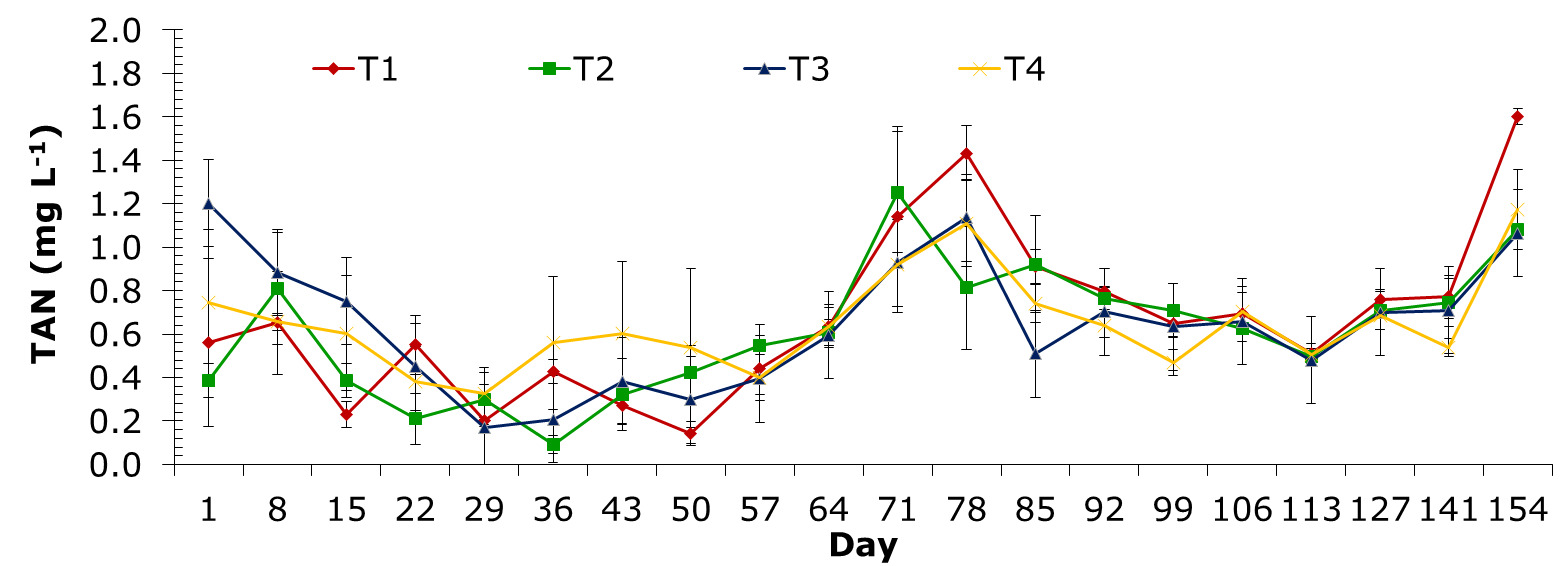
The TAN values determined through sampling periods ranged from 0.093±0.07 to 1.681±0.54 mg L-1. Elements of TAN for treatments of T1, T2, T3 and T4 were from 0.143±0.09 to 1.435±0.31 mg L-1; 0.093±0.07 to 1.681±0.54 mg L-1; 0.169±0.03 to 1.202±0.52 mg L-1 and 0.326±0.21 to 1.172±0.32 mg L-1, respectively. The highest value of TAN level was recorded in treatment control on day 78 and at the end of the experiment (Figure 7).
Nitrate
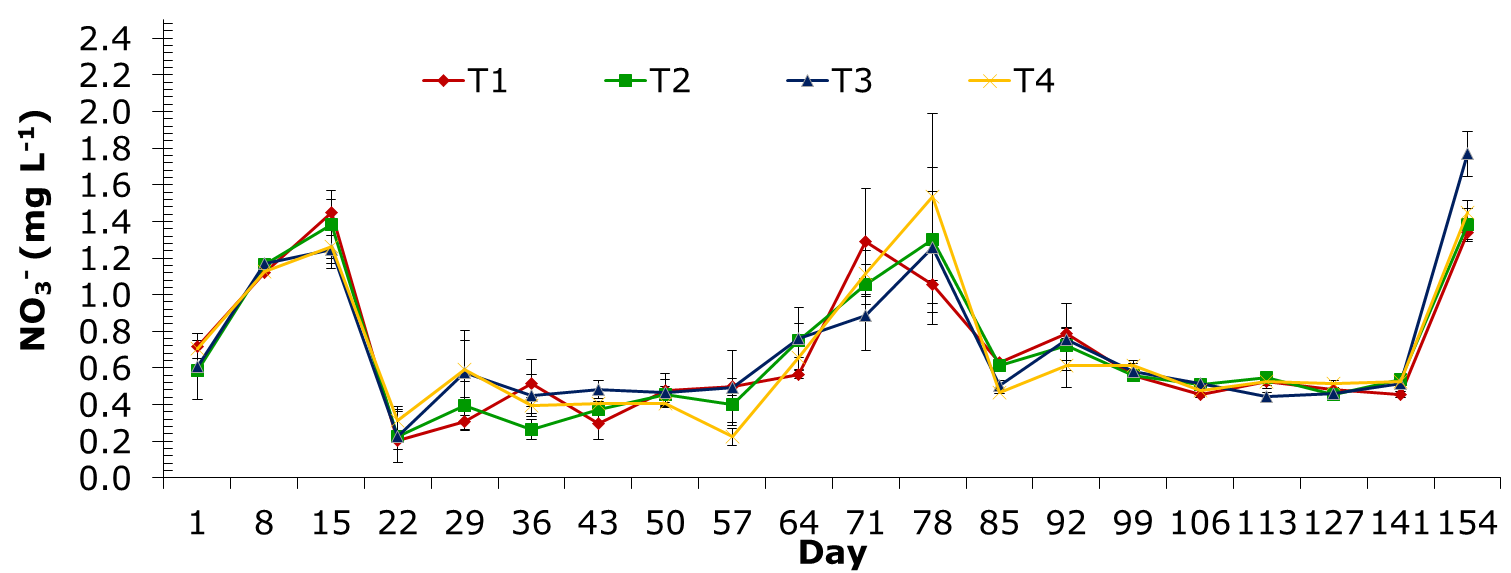
The NO3- concentration measured during sampling ranged from 0.202±0.08 to 1.769±0.21 mg L-1. In treatment T1, NO3- levels fluctuated from 0.202±0.08 to 1.450±0.12 mg L-1. Treatments added with blue-green algae resulted in values ranging from 0.223±0.24 to 1.384±0.32 mg L-1, 0.228±0.25 to 1.769±0.21 mgL-1, and 0.226±0.08 to 1.536±0.79 mg L-1. The NO3- level was high across all treatments on days 15, 78, and at the end of the trial (Figure 8).

Phosphate
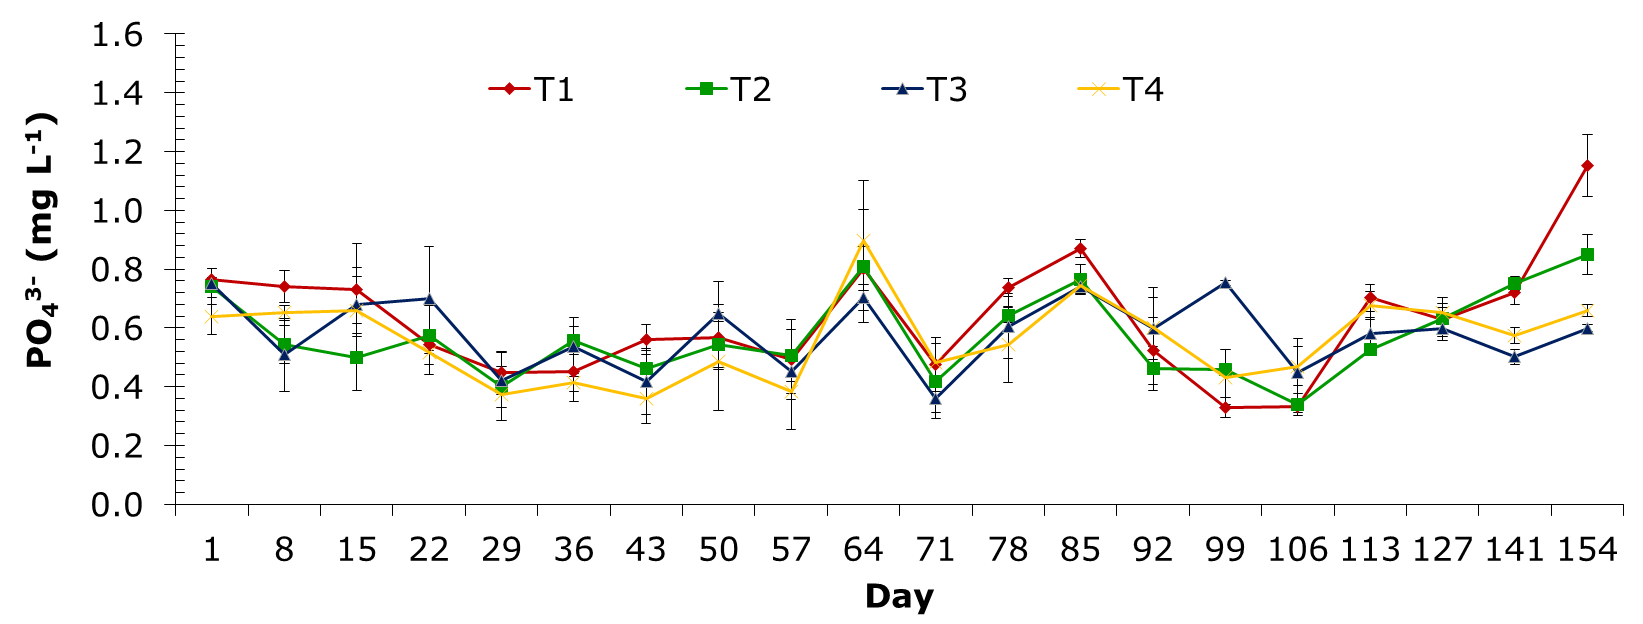
The PO43- concentration in samples ranged from 0.329±0.29 to 1.152±0.18 mg L-1. The PO43- levels in treatment T1 changed from 0.329±0.29 to 1.152±0.18 mg/L. Treatments of T10, T30, and T50 with blue-green algae revealed PO43- elements that ranged from 0.339±0.07 to 0.849±0.12 mg L-1, 0.360±0.08 to 0.754±0.02 mg L-1, and 0.359±0.15 to 0.897±0.36 mg L-1, respectively. Treatment control had the highest PO43- level at the end of the experiment (Figure 9).

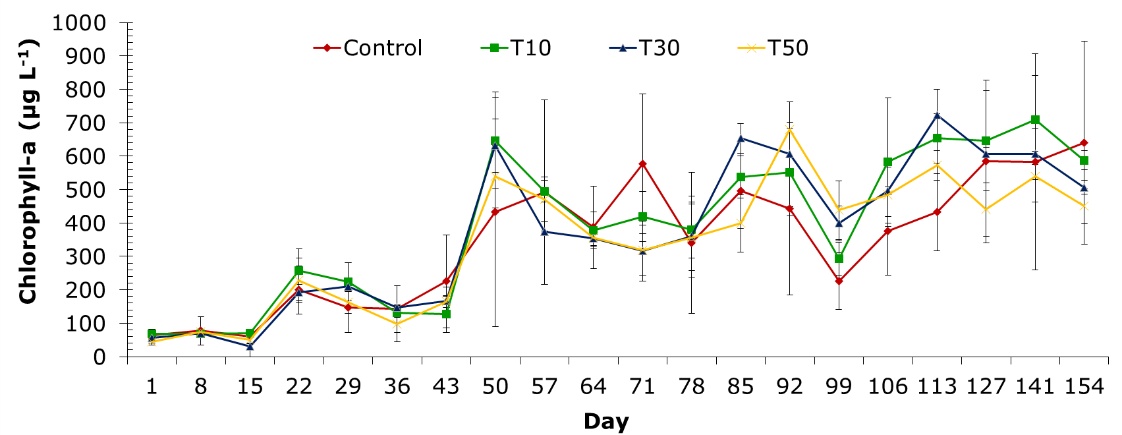
Chlorophyll-a
The experiment’s chlorophyll-a level fluctuated between 30.37±16.13 and 722.6±137.76 µg L-1 during the sampling stages. The chlorophyll-a concentration increased dramatically from the 50-day period until the end of the experiment. Treatments of control, T10, T30, and T50 had chlorophyll-a contents ranging from 59.52±7.46 to 639.86±109.51 µg L-1, 67.26±25.21 to 708.71±163.72 µg L-1, 30.37±16.13 to 722.6±137.76 µg L-1, and 43.98±16.74 to 679.48±86.38 µg L-1, respectively. Treatment T3 exhibited the highest chlorophyll-a level of 722.6±137.76 µg L-1 on day 113 and the lowest at 30.37±16.13 µg L-1 on day 15 among the treatments in the experiment (Figure 10).
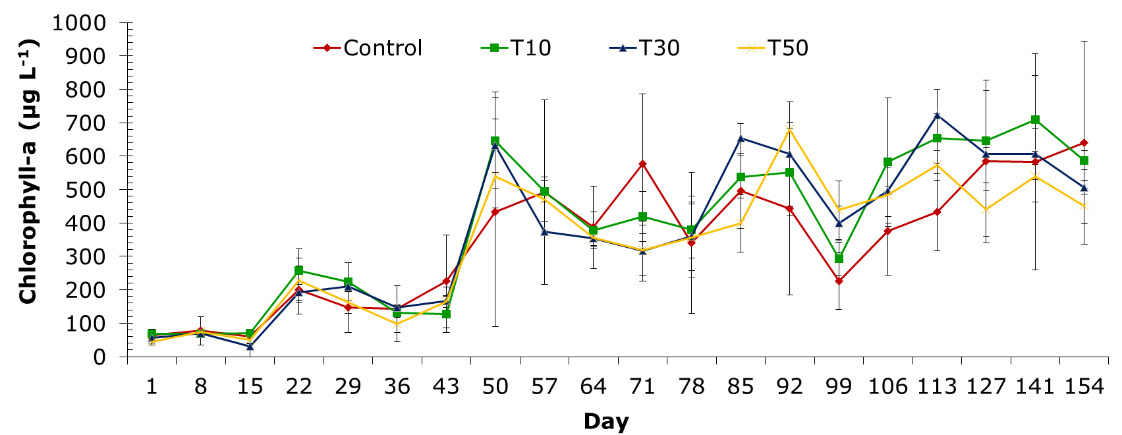
The amount of algae correlated with the water quality metrics. In this study, temperature, pH, and NO3- content were not significantly linked with chlorophyll-a concentration (p>0.05). In addition, the experiment revealed a strong positive correlation between TSS (p<0.01), TAN (p<0.05), PO43- (p<0.05), and chlorophyll-a concentration. In contrast, DO and alkalinity indicated a statistically significant negative connection (p<0.01) with chlorophyll-a content (Table 2).
Growth performance of striped catfish
The FCR indicated a significant difference (p<0.05) between treatments, ranging from 1.37±0.02 to 1.84±0.03 (Figure 11). The FCR was highest in treatment T50 and lowest in control. The survival rate of pangasius was reduced in treatments with higher densities of blue-green algae. However, the study found no statistically significant difference (p>0.05) in survival rates between treatments. The survival rate of striped catfish changed from 58.33±10.41 to 71.67±2.89%. The survival rate in treatments T30 and T50 was lower than those in control and T10, but a significant difference was not found between experimental groups (p>0.05) (Figure 12).


The trial obtained an average fish weight and length of 0.47±0.2 kg and 42±0.95 cm for control; 0.35±0.05 kg and 40±4.66 cm for treatment T10; 0.38±0.14 kg and 38±3.72 cm for treatment T30; and 0.45±0.14 kg and 35±0.99 cm for treatment T50. In addition, fish biomass of control, T10, T30, and T50 in the experimental end were 6.7±0.8 kg m-3; 4.1±0.9 kg m-3; 4.2±1.3 kg m-3; and 4.2±0.3 kg m-3, respectively. Control group had the highest SGR in weight and was significantly different from the other treatments (p<0.05). The SGR in weight ranged between 0.22±0.07 and 0.61±0.04%/day (Figure 13a). Treatment T50 had the lowest specific growth rate in weight (Figure 13a). The SGR in length ranged from 0.32±0.05 to 0.39±0.02%/day and did not differ significantly (p>0.05) among treatments in the experiment (Figure 13b). The control group had the highest specific growth rate in length, while treatment group T50 had the lowest.
_weight_and_(b)_length_of_striped_catfish_in_the_experiment.png)
Discussion
Aquaculture is extremely dependent on water quality. Pangasius species culture in aquaculture ponds is significantly impacted by poor water quality. The bloom of toxic cyanobacteria in freshwater bodies is linked to high amounts of nutrients, light intensity, temperature, and pH.13 The temperature range in pangasius ponds is 25-32℃ (MARD, 2014). Tropical fish require a temperature range of 28-32℃ for growth.14 Striped catfish can tolerate temperatures ranging from 16.7-40.8℃,15 with an ideal range 25-30ºC.16 The water temperature levels in this study were desirable for growing striped catfish. Through the sampling process at pangasius tanks, the pH value in this study recorded in the afternoon was higher than in the morning. Fluctuations in pH can affect physiological and biochemical processes of pangasius. Pangasius can live at a pH of about 4.15 In addition, the optimal pH range is 6.5-8.5, with 7.5- 8.0 considered appropriate for most aquatic species.17 Furthermore, the pH of pond water is generally maintained between 7.0 and 9.0 (MARD, 2014). Additionally, research on pH in striped catfish ponds in Vietnam ranged from 6.8-8.5,18 but pH in intensive pangasius ponds in Tan Loc commune, Thot Not district, Can Tho City, Vietnam ranged from 8.06-8.12.19 The DO content fluctuated considerably across the sampling periods. DO levels were lowest between 50-57 days of the experiment, ranging from 3.76±0.06 to 4.44±0.13 mg L-1. This was due to the rapid growth of algae; Breakdown of algal cells requires a lot of oxygen; therefore, the DO level dropped greatly during these periods. The decomposition of organic particles, photosynthesis, aquatic plant respiration, and water exchange rate, all have an impact on the DO concentration. Raising pangasius at a high dissolved oxygen level (100% saturation) leads to optimum growth while avoiding stress.20 The limit value for DO content in pangasius ponds is ≥ 2.0 mg L-1 (SCEM, 2024). Furthermore, the dissolved oxygen concentration should be kept around 60% saturation (about 5 mg L⁻¹) to enable the survival and growth of cultivated species. The best conditions for striped catfish growth were 28-32°C, pH 6.0-9.0, and DO levels of 5-10 mg L-1.14
The results of the experiment indicated that alkalinity changed significantly during the farming cycle. The limit of alkalinity in pangasius ponds generally range from 60-180 mgCaCO3 L-1 (MARD, 2014). However, the limit value of alkalinity for freshwater commercial aquaculture is from 30-200 mgCaCO3 L-1 (SCEM, 2024). Alkalinity in ponds greater than 20 mg CaCO3 L-1 is considered suitable for fish farming.14 Therefore, the alkalinity of this study is appropriate for the growth and development of striped catfish. The acceptable TSS content in freshwater aquaculture ponds is <100 mg L-1 (SCEM, 2024). In the current study, TSS content was very high at some sampling times, exceeding the allowable threshold for TSS levels in pangasius ponds. The fluctuation of TSS content in catfish tanks depends largely on the water change cycle during the farming process and the amount of excess food and waste from fish. Furthermore, TSS levels increased at particular times, correlating with a rise in algal density. On the other hand, striped catfish is an extremely active species whose feces dissolve quickly in water. As a result, the TSS level rose due to the accumulation of suspended materials, fish waste, and extra food in the tank. Research on the assessment of water quality in catfish production systems in the Mekong Delta revealed that TSS concentration in catfish ponds had an average value of 43.3 to 63.9 mg L-1,21 lower than the TSS content in this study.
The TAN content was high from 71 days to the end of the farming cycle. The reason was that during this period, the fish had a larger size, more food was provided, and the amount of waste also increased, leading to a high TAN content. The striped catfish absorbed only about 43.6% N and 30.1% P; the remaining N and P were released to the environment.22 The TAN content at the end of the trial was also very high, ranging from 6.68 to 6.83 mg L-1.23 Additionally, TAN content in striped catfish ponds can reach 4 mg L-1.24 High TAN content in ponds is toxic to organisms and should be maintained within the range of 0.2-2 mg L-1, which is ideal for aquaculture ponds.14 TAN content is the total value of NH3 and NH4+, in which NH3 is a very toxic gas for fish. In the pond, the presence of NH₄⁺ will not affect fish, but at high concentrations, it can cause an algae bloom and poison fish.18 The NO₃⁻ concentrations increased at 15 days, 78 days, and 154 days. The regular water change process and algal absorption could be one of the factors contributing to changes in water environment parameters during sample periods. Excess food accumulated at the final stage of the culture cycle, resulting in the greatest NO₃⁻ concentration across all treatments. The optimal NO₃⁻ concentration for aquaculture ponds is between 0.2-10 mg/L.14 The NO₃⁻ content in the ponds was not harmful, but can be toxic at high concentrations (> 10 mg L-1).25 The NO3- concentrations of this study were within the optimum levels for raising striped catfish.
The PO43- levels found in pangasius ponds at Trishal Upazila, Mymensingh, Bangladesh, varied from 0.1 to 2 mg L⁻¹.17 In a study of environmental factors variation in intensive pangasius ponds in An Giang province, Vietnam, PO43- content varied from 0.003-2.28 mg L-1.24 In addition, PO₄³⁻ content determined in pangasius ponds fluctuated from 0.045 to 3.16 mg/L.18 The PO₄³⁻ content recorded in pangasius tanks in this study was lower than in the above studies. A high PO₄³⁻ content is not toxic to fish; however, when the content is too high, it will promote the growth of harmful algae, especially blue-green algae. High phosphorus levels in water can lead to high biomass of phytoplankton communities, mainly blue-green algae,7 which affects fish growth.
The high chlorophyll-a content at the end of the culture cycle is due to the fact that at this time the nutrient concentrations, including TAN, NO3-, and PO43-, all increased very high, providing nutrients for algae to grow strongly. Good aquaculture ponds often have a chlorophyll-a content of about 50-200 μg L-1.14 Chlorophyll-a in particular and plant pigments in general are used not only as parameters to evaluate the biological productivity of water bodies but also act as a biological indicator to evaluate the quality of the water environment. The results revealed that the chlorophyll-a content in this study was quite low in the early stages of the experiment and increased towards the end of the culture cycle. The chlorophyll-a content reflects the density of algae in the culture tank; when the density of algae increases, the chlorophyll-a content also increases. Algal growth depletes oxygen in water, showing a statistically significant negative correlation between DO and chlorophyll-a. Blue-green algae blooms are inevitable, thereby reducing dissolved oxygen.26 Algal photosynthesis produces oxygen in water. However, during the algae death stage, the decomposition process of phytoplankton consumes considerable amounts of oxygen in the water, causing the DO concentration to drop. In addition, strong algal growth increases TSS levels. A study has shown that microcystin production by cyanobacteria increased proportionally to the amount of nutrients.13 The adaptability of algae to salinity and alkalinity is different because of the physiological differences in some species.27 In this study, a statistically significant negative correlation was found between chlorophyll-a and alkalinity. Phytoplankton communities of the lakes in the Songnen Plain responded to an increases in salinity and alkalinity with a reduction in cell density, genera richness, and taxonomic diversity and an increase in the proportion of dominant species.28 Significant correlations between chlorophyll-a and suspended solids, phosphate, nitrate, and ammonia were observed, suggesting that nitrogen and phosphorus are the two major nutrients governing the growth of algae.13
The present study’s FCR was lower than that of the previous research on commercial pangasius farming in earthen ponds in the Mekong Delta, Vietnam, which measured values ranging from 1.39 to 3.18.29 In addition, FCR in commercial pangasius farming ranged from 1.44 to 1.68.30 According to the findings of the present study, the treatment containing 50 million cells L-1 of blue-green algae resulted in the highest FCR. Higher densities of blue-green algae added to the fish tanks release more cyanotoxins. Furthermore, water environments with high organic matter content are reflected in high TSS levels in the experiment. As a result, fish need to spend more energy on living activities, leading to higher FCR.
The fish survival rate in the current study was lower than that of fish in the study on the effects of Bacillus CM3.1 and Lactobacillus TV3.2 bacteria on water quality and growth of pangasius, with survival rates ranging from 83.8±1.9 to 93.3±2.1%.31 Similarly, the survival rate in pangasius farming models ranged from 89-95% (Long, 2004). The present results indicated that the toxin-secreting cyanobacteria affected the survival rate of striped catfish. The treatments supplemented with cyanobacteria at a density of 50 million cells L-1 had the lowest survival rate. In addition, the growth rate of striped catfish was also quite low in the present experiment. The SGR index of striped catfish weight and length in another study ranged from 7.09±0.12 to 7.62±0.08 % day-1 and from 2.49±0.08 to 2.75±0.07 % day-1, respectively,31 which were much higher than the results of this experiment. Besides, the specific growth rate of pangasius weight ranged from 0.63±0.06 to 1.23±0.11 % day-1.32 The reason for this difference was that the treatments in the current study added harmful blue-green algae, which secrete toxins that affect water quality, making pangasius susceptible to disease. Therefore, striped catfish exposed to blue-green algae at a density of 10-50 million cells L-1 had significantly lower weight and growth rate than the control. The release of cyanotoxins into the environment can have significant effects on aquatic species, including decreased survival rates, altered development, larval mortality, reduced feeding, and death.33,34 Additionally, the process of Microcystis death (especially under a massive bloom scenario) can also have a significantly negative impact on the aquatic life (Hu & Rzymski, 2019). Some cyanobacterial species produce odorous metabolites that impart undesirable flavors to the cultured animals and they also may produce compounds that are toxic to aquatic animals.35 Microcystins is produced by Microcystis, the most common bloom-forming genus.36 Microcystin exposure causes cellular damage in fish, notably liver damage.37 Increased microcystin intake may have led to liver necrosis. Other pathological symptoms associated with toxic blooms include liver, heart, kidney, skin, gills, and spleen damage.38 To summarize, toxic blue-green algae had a significant impact on pangasius survival and growth. As a result, blue-green algae development in pangasius ponds needs to be controlled. Fish growth was significantly impacted by blue-green algae densities of 10–50 million cells L-1 or above.
Conclusion
Temperature, pH, DO, alkalinity, TAN, and NO3- parameters changed considerably during the sampling periods but remained within acceptable levels for pangasius growth. Some other values, such as TSS and PO43-, varied significantly and exceeded the required threshold at the end of the experiment. Chlorophyll-a content had a high value and tended to increase gradually towards the end of the experiment. Survival rate and growth rate in fish length tended to decrease in the treatment with the highest density of blue-green algae (50 million cells L-1). However, growth rates in fish weight were impacted significantly by harmful cyanobacteria abundance of 10-50 million cells L-1. The higher the density of blue-green algae added to the pangasius tanks, the higher the FCR determined. In summary, the high density of M. aeruginosa algae in striped catfish tanks had a considerable effect on fish growth and feed conversion ratio. Evaluation of the impact of blue-green algae on the meat quality of striped catfish needs to be carried out in further studies.
Acknowledgments
The authors are thankful to the colleagues and students of the College of Aquaculture and Fisheries, Can Tho University, for their great support in completing the study. This study was funded by the Ministry of Education of Vietnam under a project of “Research on the species composition of harmful algae and its potential to cause aquatic organisms in freshwater and brackish-marine water environments”, Project code: B2023-TCT-12 (Project coordinator: Nguyen Thị Kim Lien).
Authors’ Contribution
Methodology: Nguyen Thi Kim Lien (Lead). Formal Analysis: Phan Thi Cam Tu (Equal), Vo Thanh Toan (Equal), Huynh Truong Giang (Equal). Investigation: Phan Thi Cam Tu (Equal), Vo Thanh Toan (Equal), Huynh Truong Giang (Equal). Writing – original draft: Nguyen Thi Kim Lien (Lead). Resources: Phan Thi Cam Tu (Equal), Vo Thanh Toan (Equal), Huynh Truong Giang (Equal). Writing – review & editing: Nguyen Thi Kim Lien (Lead). Conceptualization: Nguyen Thi Kim Lien (Lead). Funding acquisition: Nguyen Thi Kim Lien (Lead). Supervision: Nguyen Thi Kim Lien (Lead).
Competing Interest – COPE
No competing interests were disclosed
Ethical Conduct Approval – IACUC
The experiment was carried out in accordance with national guidelines on the protection of animals and experimental animal welfare in Vietnam (Law on Animal Health, 2015).
(Reference: Law on Animal Health, 2015. Vietnam National Assembly, No. 79/2015/QH13).
Informed Consent Statement
All authors and institutions have confirmed this manuscript for publication.
Data Availability Statement
The data that has been used is confidential.