
Introduction
Nitrite is a common pollutant in aquatic environments and is toxic to a wide range of aquatic organisms, even at low concentrations naturally present in water bodies. However, high-density farming and overfeeding in intense aquaculture lead to the accumulation of nitrogen-containing organic compounds such as leftover feed and excrement in water, which causes an imbalance between nitrification and denitrification and the accumulation of nitrite.1 Nitrite exposure has been shown to adversely affect various physiological processes in aquatic animals, including blood parameters, metabolic function, antioxidant defense mechanisms, and immune responses. Studies on aquatic animals such as grass carp (Ctenopharyngodon idellus ) and Labeo rohita juveniles have shown that nutrients such as selenium and vitamin C can improve nitrite-induced oxidative stress and increase antioxidant capacity, thereby alleviating its toxicity.2,3
Iron is one of the essential trace mineral elements for fish. Serving as the active center or cofactor for most proteins, enzymes, and hormones in the body, iron plays an important role in various physiological and biochemical processes, such as material transport, energy metabolism, and immune response.4 Studies have found that iron supplementation in the diet of rainbow trout (Oncorhynchus mykiss) can improve its growth performance and intestinal tissue morphology.5 When nitrite accumulates excessively in the blood, the Fe2+ in hemoglobin is easily oxidized by nitrite ions (NO2-) into methemoglobin (MetHb), which has poor oxygen-carrying capacity, leading to tissue hypoxia.6
The entire life cycle of fish occurs within the aquatic environment, and temperature fluctuations constantly impact the growth and development process of fish.7 Studies on pikeperch (Sander lucioperca) and African catfish (Clarias gariepinus) have found that heat stress decreased fish growth performance and caused immune dysfunction and tissue damage.8,9 In natural water bodies, there are three main forms of nitrogen: ammonia nitrogen, nitrite nitrogen, and nitrate nitrogen, all of which are in a dynamic equilibrium state. Once the water temperature rises, the dynamic balance of nitrification is disrupted, and the concentration of nitrite nitrogen increases accordingly, causing serious negative effects on aquatic animals and plants.10 The suitable temperature range for the growth of spotted seabass (Lateolabrax japonicus) is 16-27 °C, while in the main aquaculture areas in the south, the water temperature often exceeds 30 °C in summer, which is detrimental to the growth and health of spotted seabass.11 The ability of spotted seabass to withstand nitrite stress when fed diets containing different levels of iron at various temperatures is worth exploring, and the interaction between temperature and iron on the resistance of spotted seabass to nitrite stress is still unknown. Therefore, the current study was aimed to investigate the effects of temperature and dietary iron level on spotted seabass under nitrite stress.
Materials and Methods
Nitrite concentration design
Before the stress test, five nitrite nitrogen concentration groups were set up (30, 60, 90, 120, and 150 mg/L), with four replicate tanks per group (two replicates at 27 °C and two at 33 °C). After being moved from holding tanks to experimental tanks (10 fish per tank), spotted seabass individuals that were comparable in size to those on day 56 of the culture experiment were counted within 24 hours. Feeding was stopped during the experiment, and an LED-lit continuous aeration system (12L:12D) was employed. Two air stones were installed in each tank to keep the recirculating water’s dissolved oxygen content at > 7 mg/L and its pH between 7.0 and 7.5. The 24-hour 40 % LC50 values for spotted seabass at 27 °C and 33 °C were determined by linear interpolation to be 29.2 and 22.8 mg/L, respectively.
Nitrite stress experiment design
After the 56-day culture experiment and a 2-day acclimation period, spotted seabass with similar sizes were selected from the 63 mg/kg, 188 mg/kg, and 554 mg/kg iron groups (10 fish per tank) for a 24-h stress test. Feeding was withheld during the test. Sodium nitrite (NaNO2) is added with water to prepare 10 g/L NaNO2 mother liquor for regulating water quality. The nitrite concentration in water is measured by the national standard method, and the nitrite nitrogen concentration is maintained at 29.2 mg/L (27 °C group) and 22.8 mg/L (33 °C group).
Sample collection
After 24 h of stress, caudal venipuncture was performed on two fish per tank, and whole blood was immediately transferred into 2 mL EDTA-containing tubes for hematological analysis. Serum was obtained from remaining blood samples after overnight standing at 4 °C, followed by centrifugation. Liver tissues were collected and stored at -80 °C for subsequent RNA extraction. Blood samples from the caudal vein were collected in sterile 1.5mL centrifuge tubes. The collected blood was left overnight at 4 °C, after which serum was separated by centrifugation (4000 ×g, 10 min) and stored at -80 °C for later use. Viscera, liver, and abdominal fat weight was measured to compute body parameters. Additionally, liver and midgut tissues were placed in 5mL cryovials and stored at -80 °C for further analysis.
Determination methods of blood routine parameters
Red blood cell (RBC) count, hematocrit (Hct), and white blood cell (WBC) count were measured using a Mindray BC 5000vet hematology analyzer. Hemoglobin (Hb) and (MetHb) content in the blood were determined using standard assay kits (Jiancheng Bioengineering Institute, Nanjing, China), following the manufacturer’s instructions.
Determination methods of serum antioxidant parameters
Serum antioxidant biomarkers, including total antioxidant capacity (T-AOC), superoxide dismutase (SOD), catalase (CAT) enzymatic activities, and malondialdehyde (MDA) concentrations, were quantified through colorimetric assays with commercial kits (Jiancheng Bioengineering Institute, Nanjing, China), strictly adhering to standardized protocols.
Determination methods of liver hif gene sequence and expression levels
Total RNA was extracted from intestinal and liver tissues using the FastPure Tissue Total RNA Isolation Kit (Vazyme, China), following the manufacturer’s instructions. RNA quality was assessed using a NanoDrop 2000 spectrophotometer (Thermo Fisher, Wilmington, USA).RNA integrity was verified via agarose gel electrophoresis. cDNA was synthesized using the All-in-One First-Strand cDNA Synthesis Kit (TransGen Biotech, China). RT-qPCR was performed on the ABI StepOne Plus system (Thermal Cycler, USA) using the ChamQ Universal SYBR qPCR Master Mix (Vazyme, China).he reaction system was 20 μL, with the following conditions: Stage 1: 95 °C for 30 s; Stage 2: 95 °C for 10 s, followed by 40 cycles at 60 °C for 30 s; Stage 3: 95 °C for 15 s. Primers for target genes were designed based on spotted seabass transcriptome data, and their sequences are listed in Table1.Relative gene expression levels were calculated using the 2-ΔΔCt method (Table 1).
Data analysis
SPSS 22.0 was employed for conducting statistical analysis of the experimental data. After confirming normality with the Shapiro-Wilk test and homogeneity of variances with Levene’s test, differences were examined using two-way ANOVA followed by Tukey’s post-hoc test, with significance set at P< 0.05. Different lowercase letters indicate significant differences before nitrite stress (P< 0.05). Different capital letters showed significant differences after nitrite stress (P< 0.05). “*” indicates that there was a significant difference before and after nitrite stress at the same temperature and iron level (P< 0.05). “#” indicated that there was a significant difference between the two water temperatures at the same iron level after nitrite stress (P< 0.05).
Results
Routine parameters in the spotted seabass blood
The content of RBC, Hb, WBC, and HCT in the blood of spotted seabass showed significant variation with dietary iron levels (P< 0.05), whereas water temperature and the interaction between water temperature and iron levels exhibited no significant effects (P> 0.05). As dietary iron levels increased from 63 mg/kg to 554 mg/kg, the contents of the RBC, Hb, WBC, and HCT in the blood increased significantly (P< 0.05) (Table 2).
Nitrite stress caused a decrease in the content of the HCT, RBC, and Hb in the blood of spotted seabass across all treatment groups.The average reduction in the 33 °C group was greater than in the 27 °C group, and among different iron levels, the 63 mg/kg iron group showed the largest average decline. Compared to before stress, the content of the Hb in the blood of the 63 mg/kg iron group decreased significantly after the stress at 27 °C (P< 0.05), while this reduction was alleviated in the 188 mg/kg and 554 mg/kg iron groups (P> 0.05) (Table 3) (Figure 1).

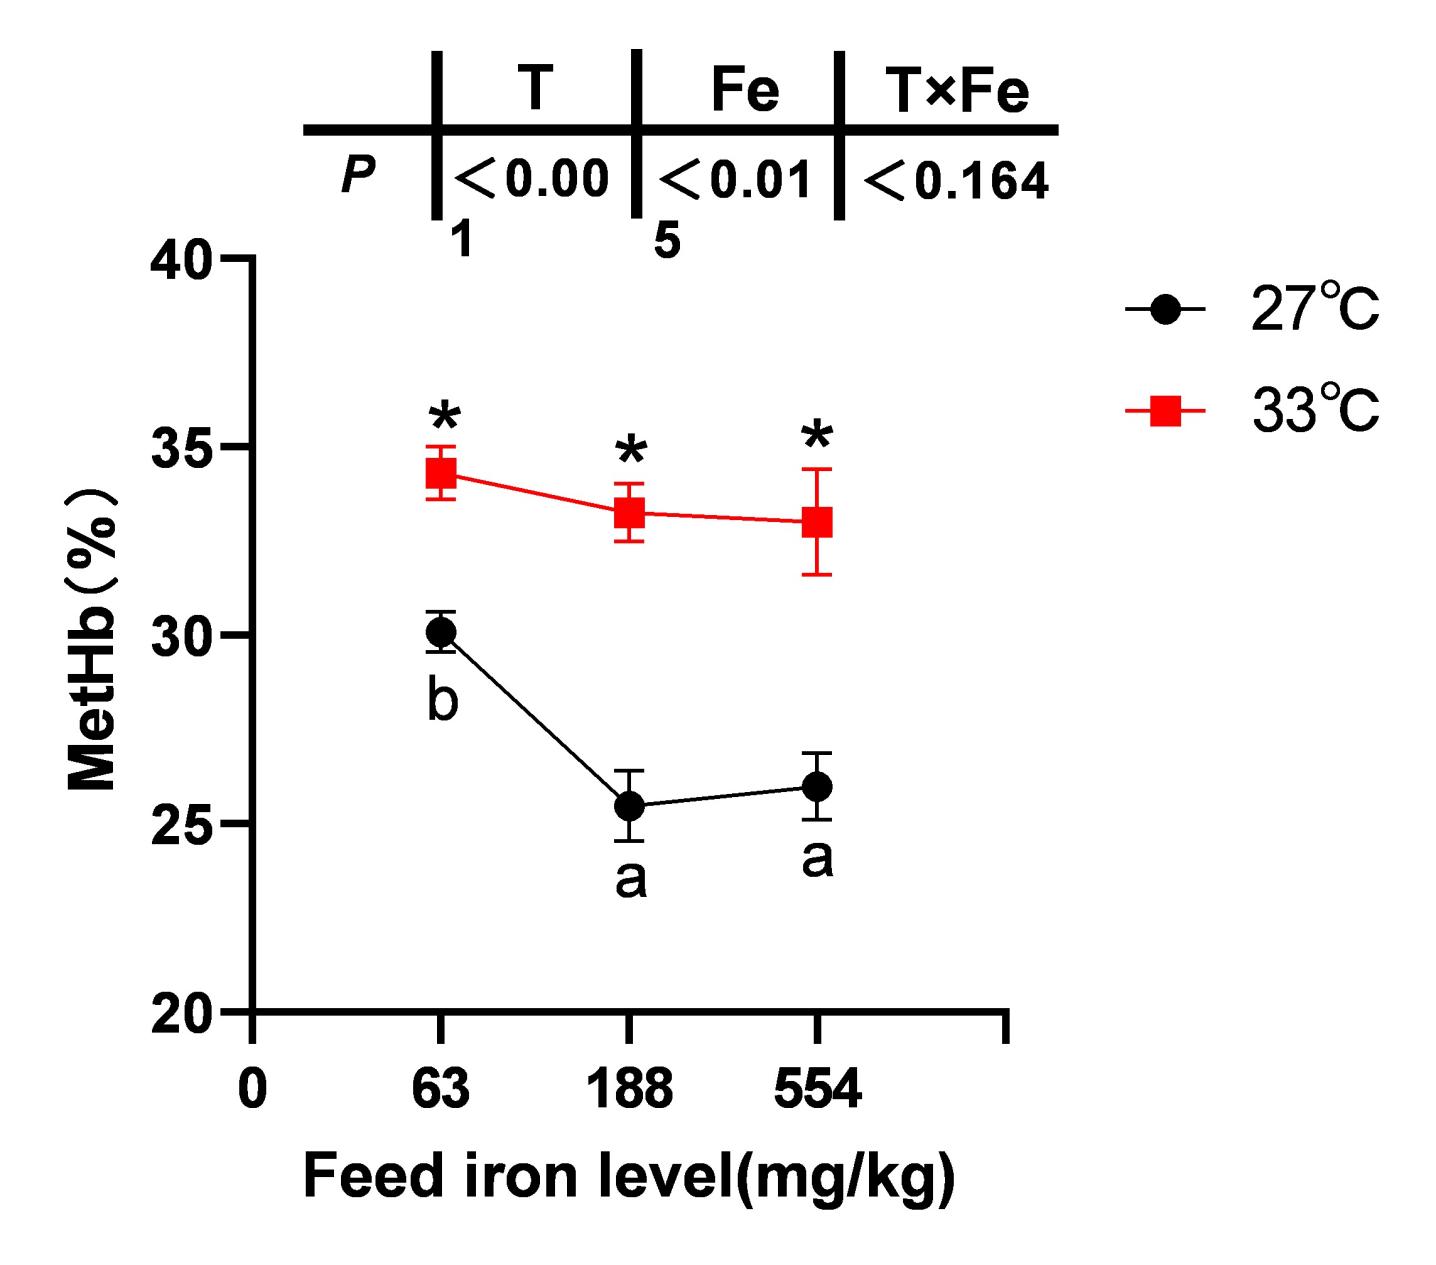
The blood MetHb content of spotted seabass in the 63 mg/kg iron group was significantly higher than in the 188 and 554 mg/kg high-iron groups at 27 °C following nitrite stress (P< 0.05). However, no significant differences in the blood MetHb content were observed among the iron groups at 33 °C (P> 0.05). Moreover, compared to both 27 °C and 33 °C conditions, the blood MetHb content of each iron group increased significantly (P< 0.05) (Figure 2).

Expression of Hif gene in liver of spotted seabass
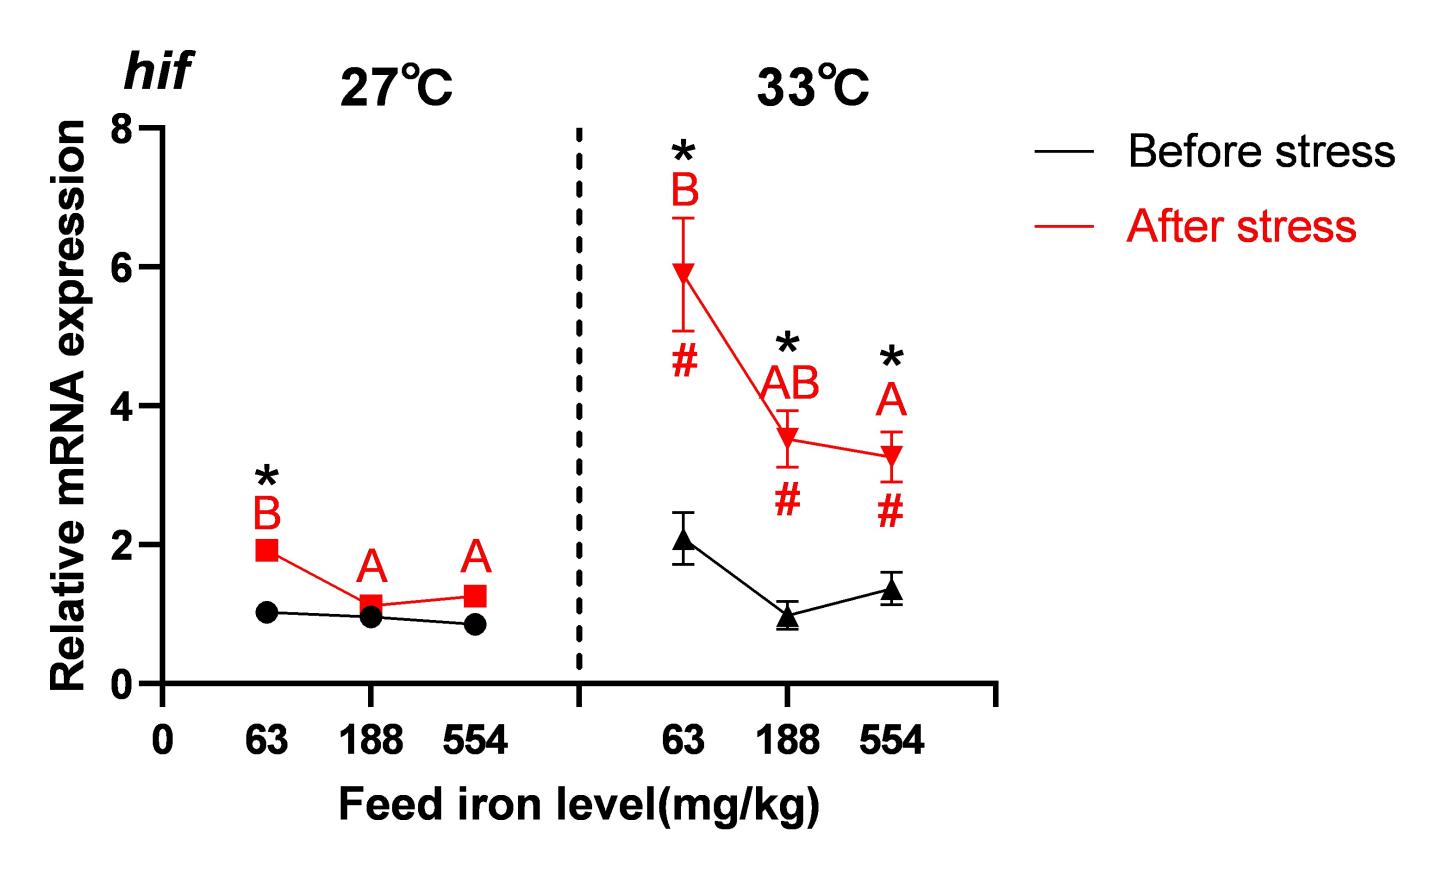
The content of hepatic hypoxia-inducible factor (hif) gene expression in spotted seabass from the 63 mg/kg group was significantly higher than in the 554 mg/kg group at the same temperature (P< 0.05). At the same iron level, the content of hif gene expression was significantly higher in the 33 °C group than in the 27 °C group (P< 0.05).Compared to before stress, the content of hif gene expression in the liver of the 63 mg/kg iron group increased significantly after stress at 27 °C (P< 0.05), while this increase was mitigated in the 188 mg/kg and 554 mg/kg iron groups (P> 0.05).Under 33 °C conditions, the content of hif gene expression in all iron groups were significantly higher after stress than before (P< 0.05) (Figure 3).

Serum antioxidant parameters of spotted seabass
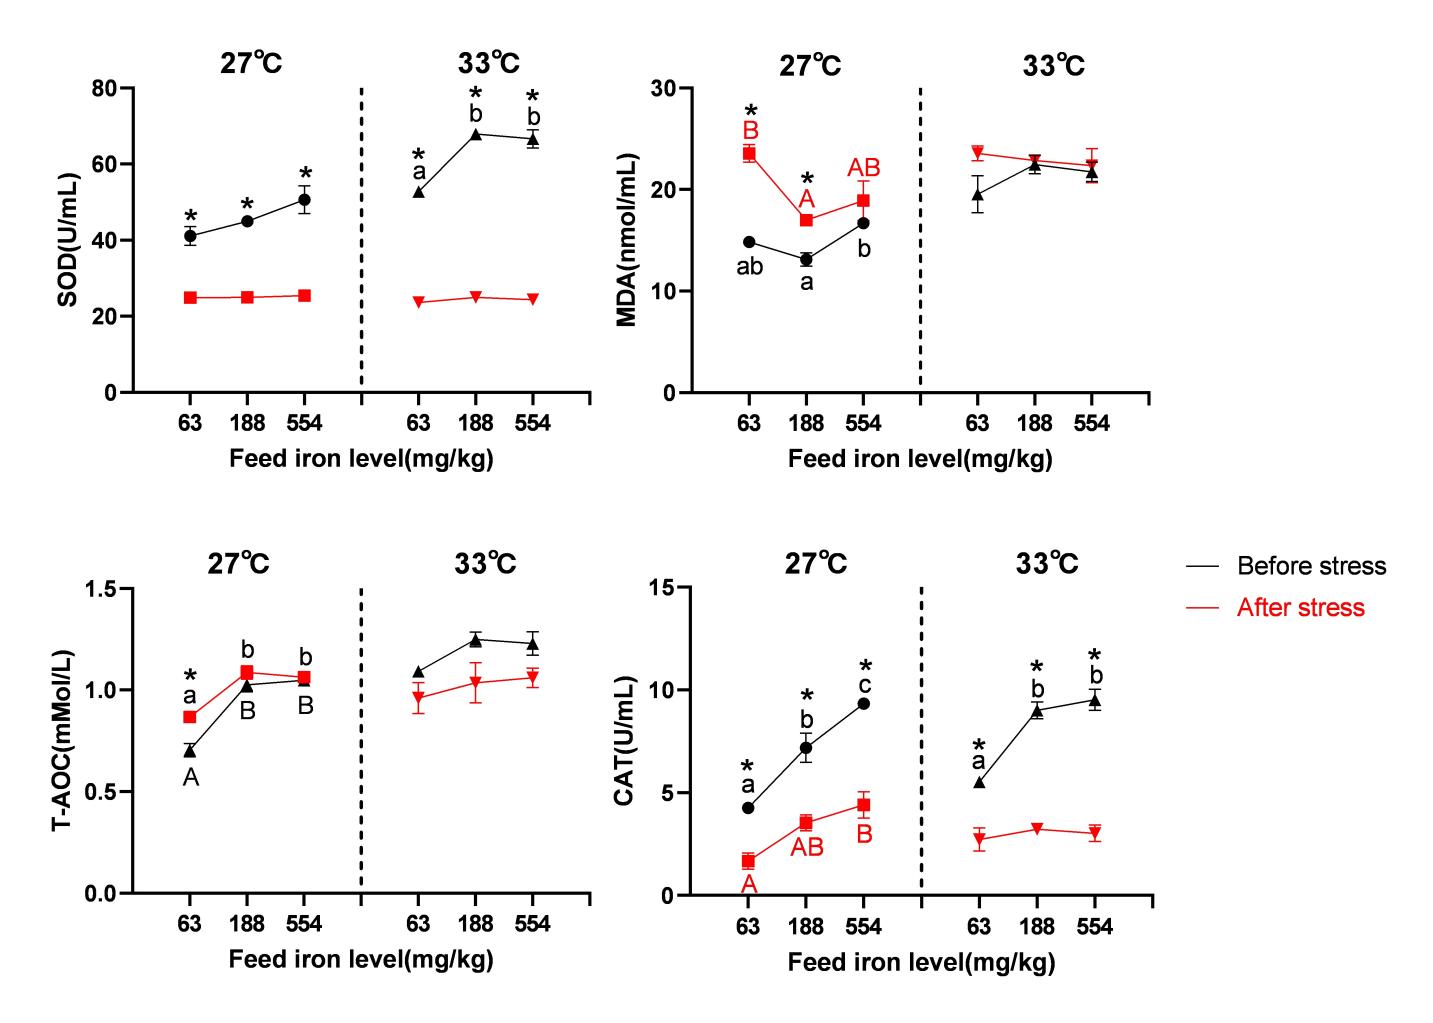
The content of serum MDA in the 33 °C group was significantly higher than in the 27 °C group (P< 0.05), with water temperature as the primary determinant, but serum T-AOC, SOD, and CAT activity were not significantly impacted by water temperature (P> 0.05). Iron level was the main driver, and spotted seabass showed significant increases in serum T-AOC concentration and CAT activity when dietary iron levels increased from 63 mg/kg to 554 mg/kg (P< 0.05). Additionally, the 63 mg/kg group’s serum MDA concentration was considerably higher than that of the 188 mg/kg group (P< 0.05), but it did not change significantly from the 554 mg/kg group (P> 0.05). Dietary iron consumption had no discernible effect on serum SOD activity (P> 0.05). The interaction between water temperature and iron content did not substantially affect the previously described antioxidant measurements (P> 0.05) (Table 4).
Nitrite stress caused decreases in the serum SOD and CAT activity and T-AOC across all treatment groups, with the 33 °C group seeing a larger average decline than the 27 °C group. After stress at 27 °C, the 63 mg/kg group’s serum T-AOC concentration dramatically dropped (P< 0.05) in comparison to before stress, although this decline was mitigated in the 188 mg/kg and 554 mg/kg groups (P> 0.05). Furthermore, all iron groups saw an increase in serum MDA level as a result of nitrite stress, with the average rise being higher in the 27 °C group than in the 33 °C group. Serum MDA levels in the 63 mg/kg and 188 mg/kg groups increased considerably after stress at 27 °C (P<0.05) compared to before stress, although this rise was mitigated in the high-iron group (554 mg/kg) (P>0.05). Nitrite stress had no discernible impact on the levels of the serum T-AOC and MDA in any of the iron groups at 33 °C (P>0.05) (Table 5) (Figure 4).

Discussion
Nitrite in water exists in two ways: external point source pollution and internal nitrogen cycle disorder.12 Under normal conditions, the nitrogen cycle maintains a stable dynamic cycle, but high temperature will lead to the disorder of nitrogen cycle of nitrite, thus increasing the concentration of nitrite. Nitrite ions (NO2-) in water can enter fish via chloride cell absorption sites on gill plates, accumulate in the blood, and cause a series of physiological process disorders and even death.13 Following the method of Lin et al.,14 an acute nitrite stress test was conducted on spotted seabass after 8 weeks of culture, using 40% LC50 nitrite concentrations for 24 h at two different temperatures, to assess the effect of dietary iron levels on the resistance of spotted seabass to nitrite stress. In this study, compared to before nitrite stress, the values of RBC, Hb, and HCT in the blood of spotted seabass decreased after nitrite stress, indicating the damaging effect of nitrite exposure on blood cells, which is similar to the findings in studies on common carp (Cyprinus carpio)15 and yellow catfish (Pelteobagrus fulvidraco).16 After nitrite stress, the values of RBC, Hb, HCT, and WBC in the blood of spotted seabass increased with increasing dietary iron levels. Additionally, the decline in Hb and HCT in the blood after stress was significantly attenuated in the 188 mg/kg group compared to the 63 mg/kg group. These results suggest that supplementing the diet with an appropriate amount of iron can mitigate the toxic effects of nitrite on blood cells, which may be attributed to the favorable effect of adequate iron intake on red blood cell production in fish under external stress.
Nitrite ions entering the bloodstream oxidize Fe²+ in hemoglobin to Fe³+, forming MetHb with poor oxygen-carrying capacity, ultimately causing cellular hypoxia.17 The hif is the most critical signaling molecule in the cellular hypoxia response,18 and increased blood MetHb levels and upregulated tissue hif expression have been confirmed in fish under nitrite exposure.19 In this study, nitrite stress at 27 °C caused a significant decrease in blood Hb content and hepatic hif expression in the 63 mg/kg iron group, but this reduction was alleviated in the 188 mg/kg and 554 mg/kg iron groups. Additionally, blood MetHb content in the 188 mg/kg and 554 mg/kg iron groups was significantly lower than in the 63 mg/kg iron group. These findings demonstrate that dietary iron supplementation alleviates nitrite-induced hypoxia, potentially attributable to the heightened susceptibility of iron-deficient fish with low Hb levels to MetHb formation upon nitrite exposure. Temperature is a key environmental factor that influences nitrite toxicity. Kroupová et al.20 exposed two groups of common carp to water with high nitrite concentrations at 14 °C and 20 °C for 48 h, and found that the plasma nitrite concentrations of common carp were significantly higher at higher temperatures (20 °C). In present study, the decrease in blood RBC, Hb, and WBC after stress was greater in the 33 °C group than in the 27 °C group. Additionally, in the same iron level group, blood MetHb content after stress was significantly higher in the 33 °C group than in the 27 °C group. These results suggest that nitrite has a greater negative impact on spotted seabass at high temperatures, which may be due to increased energy and oxygen consumption in fish at elevated temperatures, as well as an increased rate of ion exchange, leading to greater nitrite uptake.21
One of the toxicological effects of nitrite is its disruption on the red blood cell membrane redox system, induction of reactive oxygen species production, weakening of the antioxidant capacity of whole blood, and induction of oxidative damage to proteins, lipids, and cell membranes.22 In this study, serum SOD and CAT activities and total T-AOC decreased, and MDA content increased in each iron level group after nitrite stress, indicating impaired antioxidant status. Similar results have been reported in studies on grass carp23 and spotted seabass.24 In this study, compared to the 63 mg/kg iron group, serum T-AOC and MDA content in the 188 mg/kg iron group increased significantly after nitrite stress, indicating that iron supplementation can help alleviate oxidative damage caused by nitrite stress. This may be attributed to the weakening of antioxidant status and negative impact of oxidative stress in long-term iron deficiency. In summary, supplementing feed with the appropriate amount of iron can enhance the tolerance of spotted seabass to nitrite.
Acknowledgments
This study was supported by the Natural Science Foundation of Fujian Province of China (grant number: 2023J01761), the Fujian Engineering Research Center of Aquatic Breeding and Healthy Aquaculture (grant number: 2022ESHML18) and the China Agriculture Research System (grant number: CARS47–14).
Authors’ Contribution
Conceptualization: Haoyu Sun (Lead), Zhe Wang (Equal), Kai Song (Equal); Methodology: Haoyu Sun (Equal), Zhe Wang (Equal) Kai Song (Equal); Formal Analysis: Haoyu Sun (Equal), Ling Wang (Equal), Kangle Lu (Equal); Investigation: Haoyu Sun (Equal), Chunxiao Zhang (Equal), Xueshan Li (Equal), Ruijuan Ma (Equal); Writing – original draft: Haoyu Sun (Equal), Zhe Wang (Equal), Kai Song (Equal); Funding acquisition: Chunxiao Zhang (Equal), Kai Song (Equal). Resources: Chunxiao Zhang (Equal), Kai Song (Equal); Supervision: Kai Song (Equal), Chunxiao Zhang, Ling Wang (Equal), Kangle Lu (Equal), Xueshan Li (Equal) Ruijuan Ma (Equal); Writing – review & editing: Kai Song (Lead), Haoyu Sun (Equal).
Competing Interest – COPE
No competing interests were disclosed.
Ethical Conduct Approval – IACUC
The experimental protocols adhered to the ethical guidelines set forth by the Committee on the Ethics of Animal Experiments of Jimei University, China.
Informed Consent Statement
All authors and institutions have confirmed this manuscript for publication.
Data Availability Statement
The data that has been used is confidential.