Introduction
Fish consumption is increasing at a rate that is unsustainable if solely reliant upon capture-based fisheries. Consequently, the demand for aquaculture species for food consumption has grown sharply, reaching 82.1 million tons and an estimated total value of 164.1 billion USD globally.1 In 2014, a milestone was reached with the supply of aquaculture fish for human consumption surpassing that of wild-caught fish.1 Intensive aquaculture requires the optimization of production and the reduction of cost, risk, and environmental impact. To mitigate this impact, land-based recirculating aquaculture systems (RAS) have been widely developed as a means to both intensify production and reduce environmental footprints through the reutilization of water resources and increased control of effluent composition.2,3 As a rapidly increasing component of food production, aquaculture requires seamless transfer of scientific knowledge and resources to inform decision-making across sectors. One of the major challenges for enhancing aquaculture production is integrating this knowledge transfer between scientists and practitioners. Successful research, extension, and education programs in aquaculture, therefore, center around well-conceived and constructed facilities, which serve as venues and models for the dissemination of concepts and best practices.
For aquaculture in Hawaiʻi, there exists a clear demand to address the need for opportunities for experiential learning, increased capacity to provide aquaculture husbandry training, and an expanded enterprise focused on research to improve aquaculture production. Hawaiʻi hosts a diverse environment for aquaculture development, stemming from the legacy of Hawaiian loko iʻa (fishponds), which historically gave rise to efforts in rearing multiple finfish species in different settings, including awa or milkfish (Chanos chanos), ʻamaʻama or striped mullet (Mugil cephalus), common carp (Cyprinus carpio), Chinese catfish (Clarias fuscus), tilapia (Oreochromis spp.), and moi or Pacific threadfin (Polydactylus sexfilis) among others.4 Recently, through a partnership between the College of Tropical Agriculture and Human Resilience and the University of Hawaiʻi Sea Grant College Program, a land-based aquaculture research facility was developed at the University of Hawaiʻi at Mānoa (UHM). Encompassing 73 rearing tanks with two main RAS, the Tuahine Aquaculture Research and Education Center (TAREC) facility was developed to also serve as a demonstration center for education and extension activities. Through a versatile and integrated system design, including RAS, the facility is capable of rearing aquatic animals and plants in a range of experimental conditions. The facility also serves as a platform to enhance technology transfer to both industry and non-profit organization end users in addition to professional training and workforce development.
TAREC represents a critical advancement to address the evolving needs of sustainable aquaculture in the Pacific region. As outlined in a recently developed aquaculture plan for Hawaiʻi5 and the Hawaiʻi 2050 Sustainability Plan,6 TAREC’s compact and adaptable dual RAS infrastructure specifically aligns with the state’s strategic priorities for sustainable aquaculture development by supporting: (1) diversity of aquaculture in Hawaiʻi through the culture of both freshwater and marine species, thereby enabling efforts in restorative aquaculture and stock enhancement programs; (2) established species, such as tilapia, which are vital for local food security given Hawaiʻi’s reliance on imported seafood; (3) native marine species under development, including salinity acclimation responses of the catadromous ʻamaʻama, and feeding and stress response trials in support of early domestication efforts for nenue or brassy chub, Kyphosus vaigiensis7; (4) integrated multitrophic aquaculture (IMTA), where co-cultivation of species across trophic levels (including fish, invertebrates and limu or algae) can be tested to model nutrient recycling, waste reduction, and ecosystem services; (5) decoupled and RAS aquaponics, where hybrid systems that combine fish farming with hydroponic plant production can be developed to maximize resource efficiency, especially in space-constrained island environments; (6) extension efforts through workshops and the GoFish beginning farmer training program, which addresses aquaculture development workforce gaps and provides hands-on training in RAS maintenance, water quality monitoring, and business development, and thereby fostering entrepreneurship in a sector dominated by small-scale producers; (7) undergraduate student training and experiential learning, through classes in aquaculture production that bridge theoretical knowledge and practical skills, such as system design and data-driven decision-making; (8) graduate student mentorship, through directed research in multiple graduate programs at UHM, including animal sciences and nutritional sciences; and (9) community engagement, which is facilitated by the proximity to the UHM campus and access to extension programs.
Generally, the RAS at TAREC was designed to minimize water use, which is critical in freshwater-limited island ecosystems, while enabling studies on feed efficiency and welfare optimization in aquatic organisms, which are key challenges for inland aquaculture. The system’s modular design supports the diversity of Hawaiʻi’s unique aquacultural context by enabling research in recirculating water of different salinities and conditions while informing scalable models for urban aquaponics and repurposing nutrient-rich effluents through water filtration and carbon sequestration. The gamut of potential applications for TAREC not only aligns with the priorities in the State’s sustainability agenda to bolster the role of aquaculture in lowering the reliance on imported food but also reflect and support the principles of traditional loko iʻa systems, which are undergoing revitalization.8 Moreover, the facility enables users to conduct a range of fundamental and applied studies on various physiological aspects of the aquatic species it hosts, including reproduction, growth, nutrition, stress responses, and acclimation to extreme environments. The proximity of TAREC to UHM and Honolulu facilitates access for students, researchers, and community stakeholders and enhances public awareness of aquaculture’s role in food sovereignty.
Here, we provide the detailed specifications of the facility along with an initial grow-out trial to evaluate the facility, using euryhaline Mozambique tilapia, Oreochromis mossambicus, reared in both fresh water (FW) and artificial seawater (ASW) RAS.
The capacity for dual-salinity RAS at TAREC is well suited for the housing requirements of several tropical aquatic species and allows for the study of salinity tolerance in finfish.9 Tilapia are versatile experimental fish with high market desirability and relative ease of aquaculture farming.10,11 Mozambique tilapia are widely used to characterize the physiological effects of environmental acclimation, including salinity challenges,12–14 temperature shifts,15,16 and stress responses.17,18 For example, several studies in flow-through systems showed that Mozambique tilapia grew faster in seawater (SW) when compared with fish in FW.19–21 Despite the recent rise in the development of RAS in both production and academic facilities,22 fewer studies have focused on characterizing the effects of water salinity on growth or other physiological parameters when fish are reared under RAS. While we hypothesized that Mozambique tilapia grown in ASW would outgrow those in FW, as shown in previous studies with this species employing flow-through systems, the results gathered from this trial provide critical information on data variability and changes in water quality that are specific to this facility.
Specifically, this study describes and evaluates TAREC’s RAS arrays by comparing growth rates and feed conversion ratios (FCR) between Mozambique tilapia stocked in recirculating FW and ASW systems for three months. We then characterized and discussed the variation in morphometric parameters to inform future growth studies at TAREC.
Materials and Methods
Facility design and specifications
The design of the facility integrated several aspects to offer the versatility required for addressing research, education, and extension projects. The option to change water parameters and species and customize components of the system, along with cost, played a major role in designing the tank arrays and space between systems. For this reason, two RAS arrays were built, allowing not only for the housing of species of variable salinity requirements but also for installing experimental tanks with optional access to both sources of recirculating water.
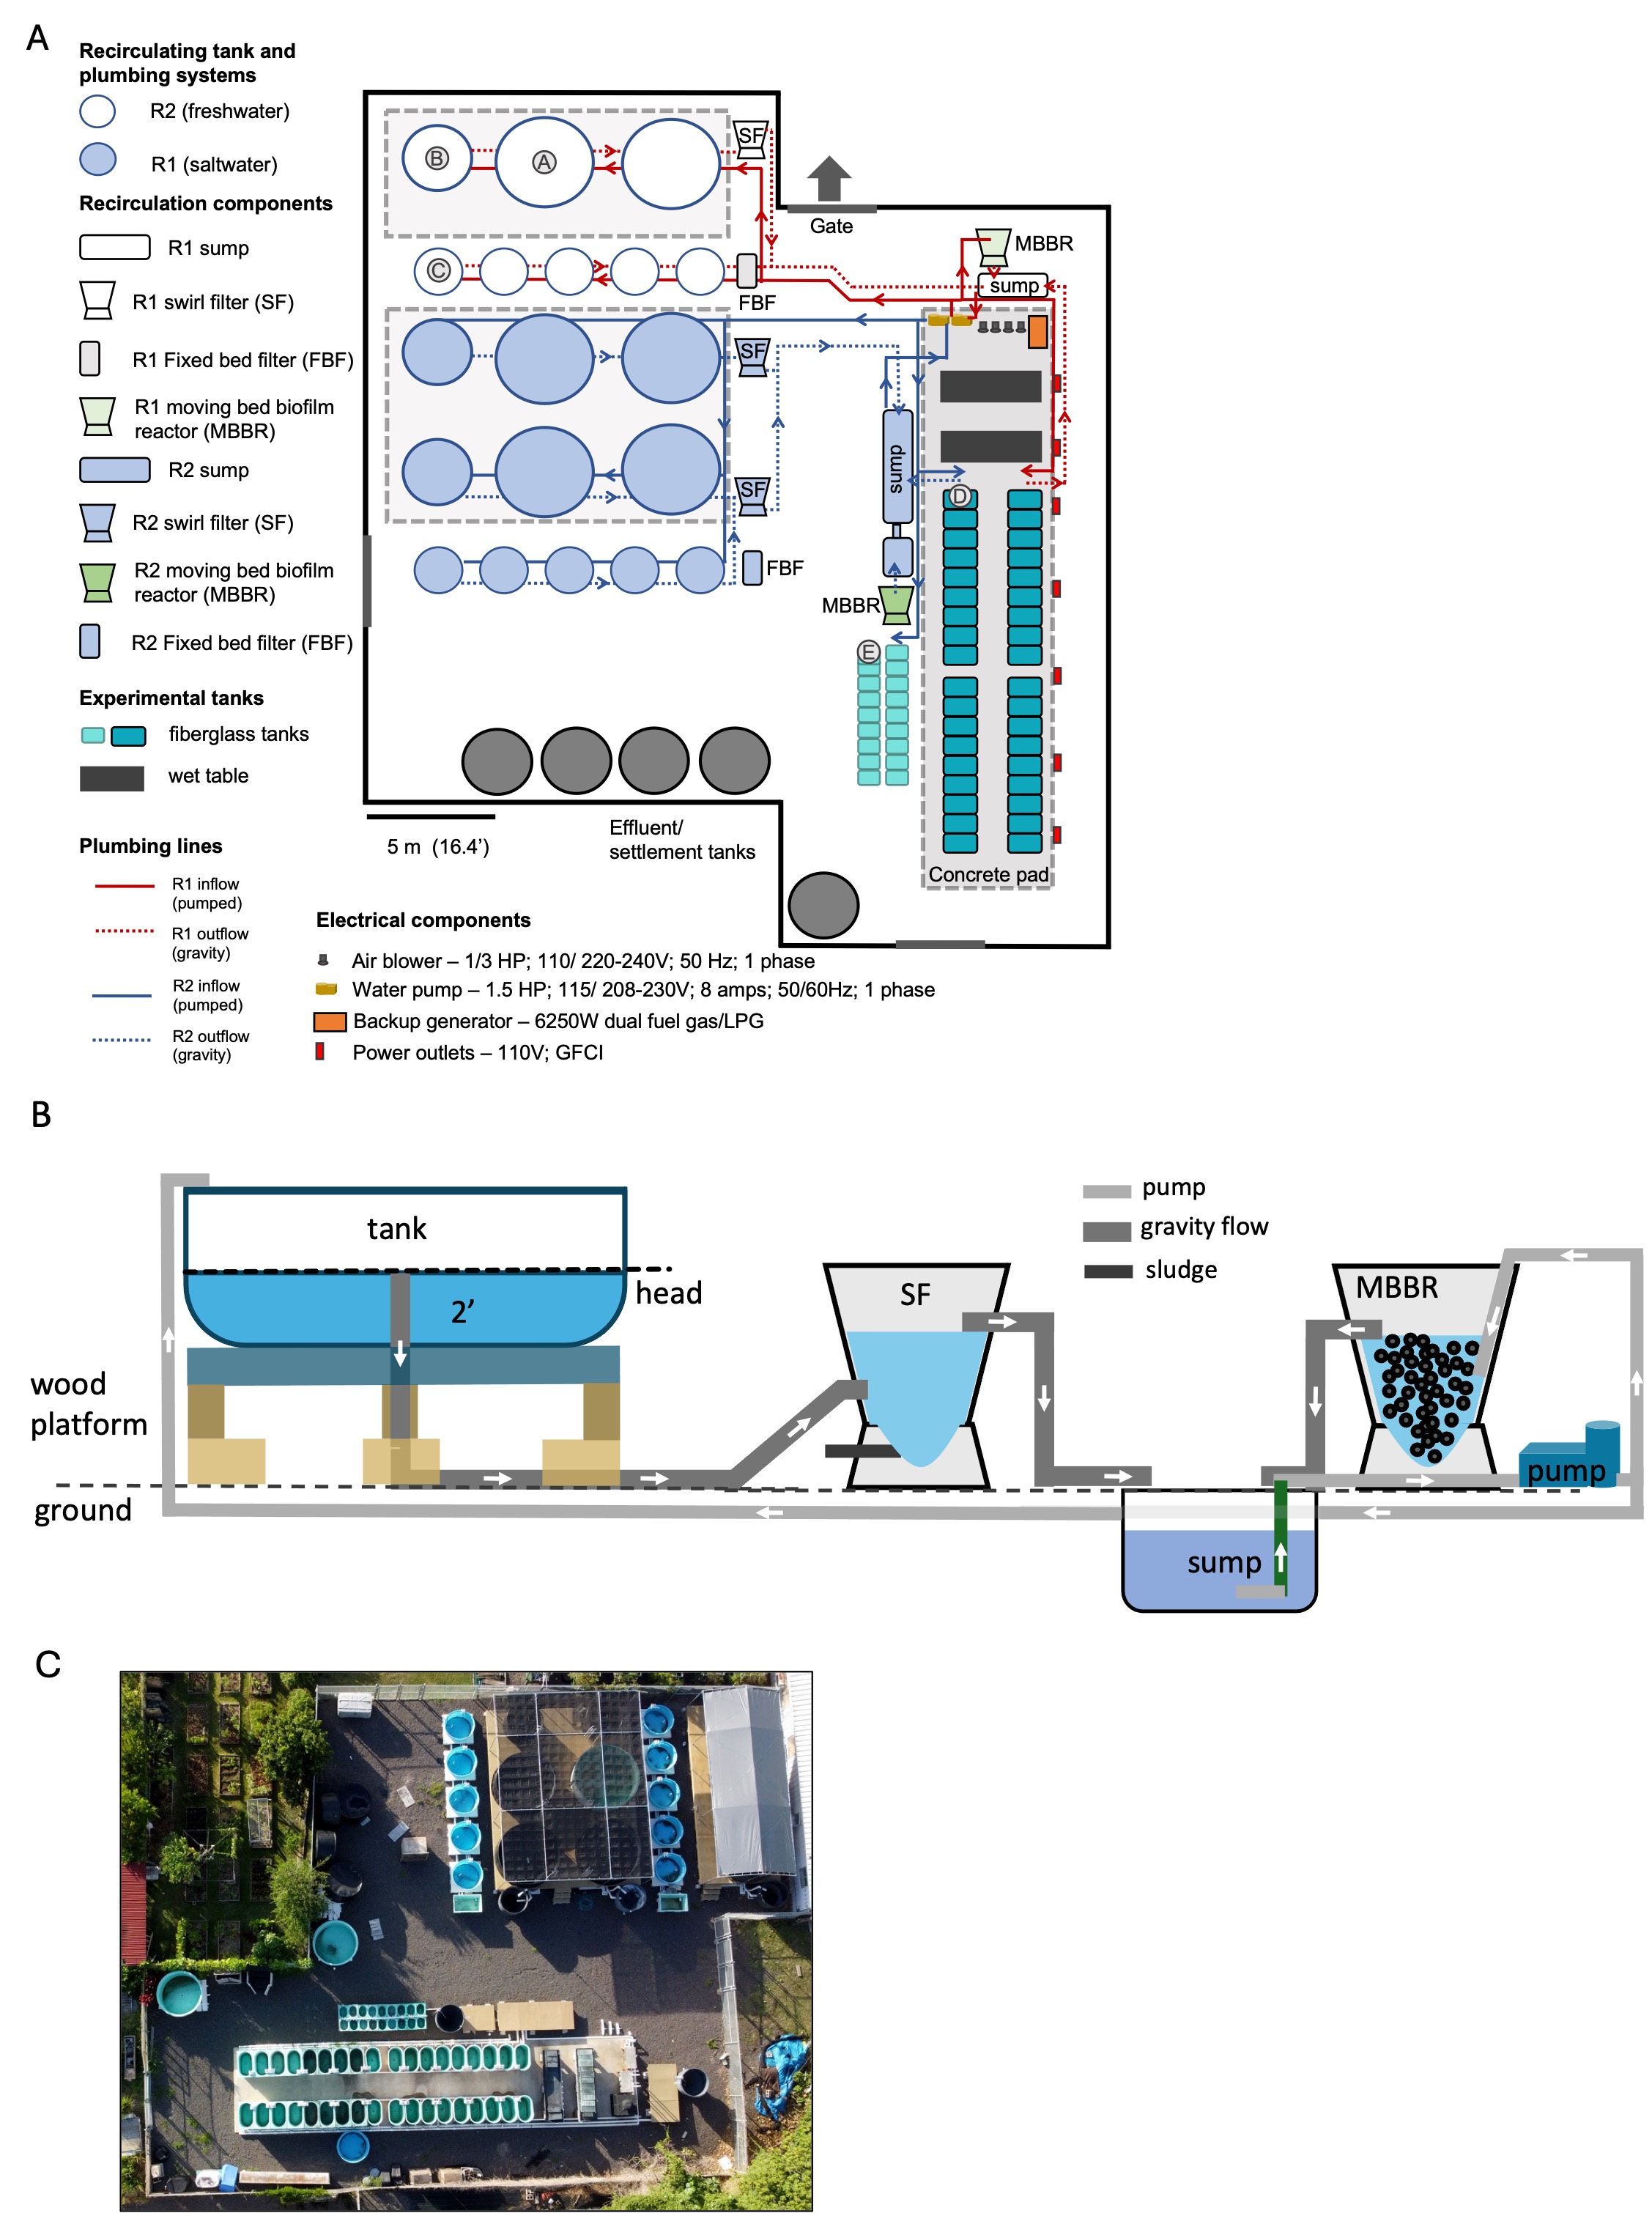
Encompassing approximately 800 m2, TAREC houses two outdoor RAS arrays of variable salinities (designated as R1 and R2), which were designed to recirculate and distribute biofiltered and clarified water to experimental and holding tanks. The facility is housed within a fenced perimeter with three locked gates, with immediate access to backup power, and was established in compliance with the Institutional Animal Care and Use Committee (IACUC) requirements of the University of Hawaiʻi. Figure 1 details the complete layout of the facility with tank size specifications and separation of RAS components. The R1 RAS, designed to recirculate saltwater (SW), serves eight circular tanks of variable diameters (A, B, and C) plumbed with recirculating water or municipal FW. The R2 RAS, designed to recirculate FW, serves 11 circular tanks of variable diameters (A, B, and C). Water flowing through R1 and R2 is gravity fed from tanks A and B to conical swirl filters (SF), and from tanks C to fixed bed filters (FBF). For each RAS, surface water is separated from settled solids in the SF or FBF, then drained into the sump. Water is then integrated into a moving bed biofilm reactor (MBBR) and pumped back to the tanks.

There are two separate 1.5 horsepower (HP) variable speed water pumps (Pentair Superflo VS; SF N1 1-1/2FET) working in tandem to power water flow in the R1 and R2 systems with the capacity to pump 9–25 m3/h. The output is divided between the MBBR and fish tanks. An additional experimental tank array, built over a concrete pad, 36 fiberglass tanks (D) are plumbed with three inlets: FW municipal water, recirculated water from R1, and recirculated water from R2. The layout of drainage pipes from the D tanks allows each tank’s effluent to flow into the R1 or R2 systems. Alternatively, according to experimental needs, D tanks may be fitted with individual solid filtration devices and hold water independently from R1 and R2 systems. A smaller array of 18 fiberglass tanks (E) is connected to R2 and municipal FW and can operate as an independent RAS. Continuous aeration to all tanks is provided by two air blowers (Pentair Sweetwater Regenerative Blower; S31-B). In case of a power outage, two identical air blowers can be connected to an emergency power generator (Champion Power Equipment 100592V 6250-Watt Dual Fuel Portable Generator). A Sensaphone (Sentinel Pro 4G) monitoring system is installed to monitor air blower pressure, water temperature, tank water level, and power failure, which provides email notifications at customizable threshold levels.
Solids removal, biofiltration, and grade
Rectangular tanks with fixed bed filters (FBF) consisting of fixed Matala® filter mats serve as solids removal device for the rows of five C tanks (Figure 1A). For the A and B tanks, effluent is diverted to SF before discharging into the sump. The MBBRs of the R1 and R2 RAS comprise a conical tank (2.22 m3, Figure 1A) with biofilter media (Kaldness K1). The K1 occupies ~50% of the total MBBR capacity and has a specific surface area (SSA) of 500 m2/m3. Thus, the available area for total ammonia-nitrogen (TAN) conversion of each MBBR is 555 m2 (2.22 m3 * 0.5 * 500 m2/m3). The agitation of K1 is provided by a disc air diffuser placed at the bottom of the MMBR tank.
At TAREC, water flow occurs at three main grade levels: tanks, solids separation systems (SF and FBF), and sumps, from highest to lowest grade (Figure 1B). At the highest elevation, tanks A and B are installed on a wooden deck 76.2 cm above ground level. Standpipes further elevate the grade to 106.7 cm. The SF tanks, installed on ground level, have a drain 80 cm above ground to avoid complete tank drainage on the wooden deck in case of a standpipe failure. The SF also has a bottom drain at ground level for cleaning. Pipes that connect tanks A and B to the SF and the SF to the sump are 10.2 cm in diameter and run at ground level and underground, respectively. The C and FBF tanks are at a lower grade at 25.4 cm and 22.9 cm above ground, respectively, but also drain through 10.2 cm pipes towards the sump. Experimental tanks D and E rest on wooden supports and are 33 cm and 45.7 cm above ground, respectively. In the case of the D tanks, the 10.2 cm drainage pipe is plumbed with a valve that controls effluent water flow to either the R1 or the R2 sump, depending on the water salinity of the tank. The E tanks can drain directly to the R2 sump or an independent sump through a 5 cm drain. Water returning to tanks is pumped through 3.8 cm pipes for tanks A, B, and C, and 1.9 cm pipes for tanks D and E. An aerial photo of the facility is provided in Figure 1C.
Experimental trial
A growth trial of Mozambique tilapia reared in five C tanks containing ASW (R1) and five C tanks containing FW (R2) under natural photoperiod was conducted between July and October, 2024. The water pumps were operated at 11 m3/h to facilitate four turnovers/hour in both systems. The initial water volumes were 7,790 L and 9,300 L for ASW and FW RAS, respectively (difference in system volumes attributed to different sump volumes). Within each system, 10% of the total water volume was replaced weekly for 13 weeks, leading to a total water exchange of 10,130 L and 12,090 L and a total usage of 17,920 L and 21,390 L for ASW and FW, respectively. A total of 25 fish per tank (0.55 m3) at an average weight of 13.17 ± 0.22 g and 13.43 ± 0.08 g were stocked in ASW and FW systems, respectively, excluding any fish below 3 g. As such, tanks were initially stocked with a ~0.6 kg/m3 biomass. Fish were sourced from the same cohort, and sex could not be determined due to their small size. To acclimate the ASW tilapia, the system-wide salinity was gradually raised by adding Instant Ocean® sea salt (Blacksburg, VA) to FW up to a salinity of 20‰ by 48 h; the salinity was then elevated to 33‰ by the onset of week 2 of the trial. Throughout the trial, salinity was measured daily by a refractometer. Both temperature and dissolved oxygen (DO) were measured daily with a multiparameter waterproof meter (HI1769819X; Hanna Instruments Woonsocket, RI). TAN and nitrite-nitrate levels were measured from weekly water samples with an Autoanalyzer (AA3; Seal Analytical, WI) by the UHM SOEST Laboratory for Analytical Biogeochemistry. Fish were fed once daily, in the morning between 0800 and 1000, with a 1:1 mix of 1.5 mm Steelhead Fry pellets and 2 mm Trout Chow pellets (Skretting, Tooele, UT). Feed containers were weighed prior to and following ad libitum feeding for a maximum of 15 minutes. Total feed fed, fish body weight, and length were measured weekly. Fish were fasted on the days they were weighed. The mean of the five tanks per salinity was considered for statistical analysis in Table 1.
Feed conversion ratio (FCR = total amount of dry feed consumed / (Δweight)) for each tank was calculated weekly. The denominator represents the difference in the fish’s wet weight gain over the given time interval. Specific growth rate (SGR = (ln (final weight) − ln (initial weight)) / (time) * 100) and condition factor (K = 100 * weight / length3) were also calculated weekly per treatment. All experimental procedures and methods were conducted following Animal Research Reporting of In Vivo Experiments (ARRIVE) guidelines and approved by the Institutional Animal Care and Use Committee (IACUC), University of Hawaiʻi.
Statistics and analysis of data variability
A Student’s T-test was used each week to determine differences in morphometric measurements and water quality parameters (n=5, 3-7; respectively) between FW and ASW. All statistics were performed using Prism 10 (GraphPad, La Jolla, CA), and values indicate mean ± standard error of the mean (S.E.M.). With tanks as experimental units, the effect size (Cohen’s D = (mean1 − mean2)/pooled standard deviation) for weight and length was calculated. Using these observed effect sizes, a projected power analysis (G*PWR3.1; Faul et al.23) was performed to determine the power when using three, four, or five tank replicates per treatment.
Results
Growth
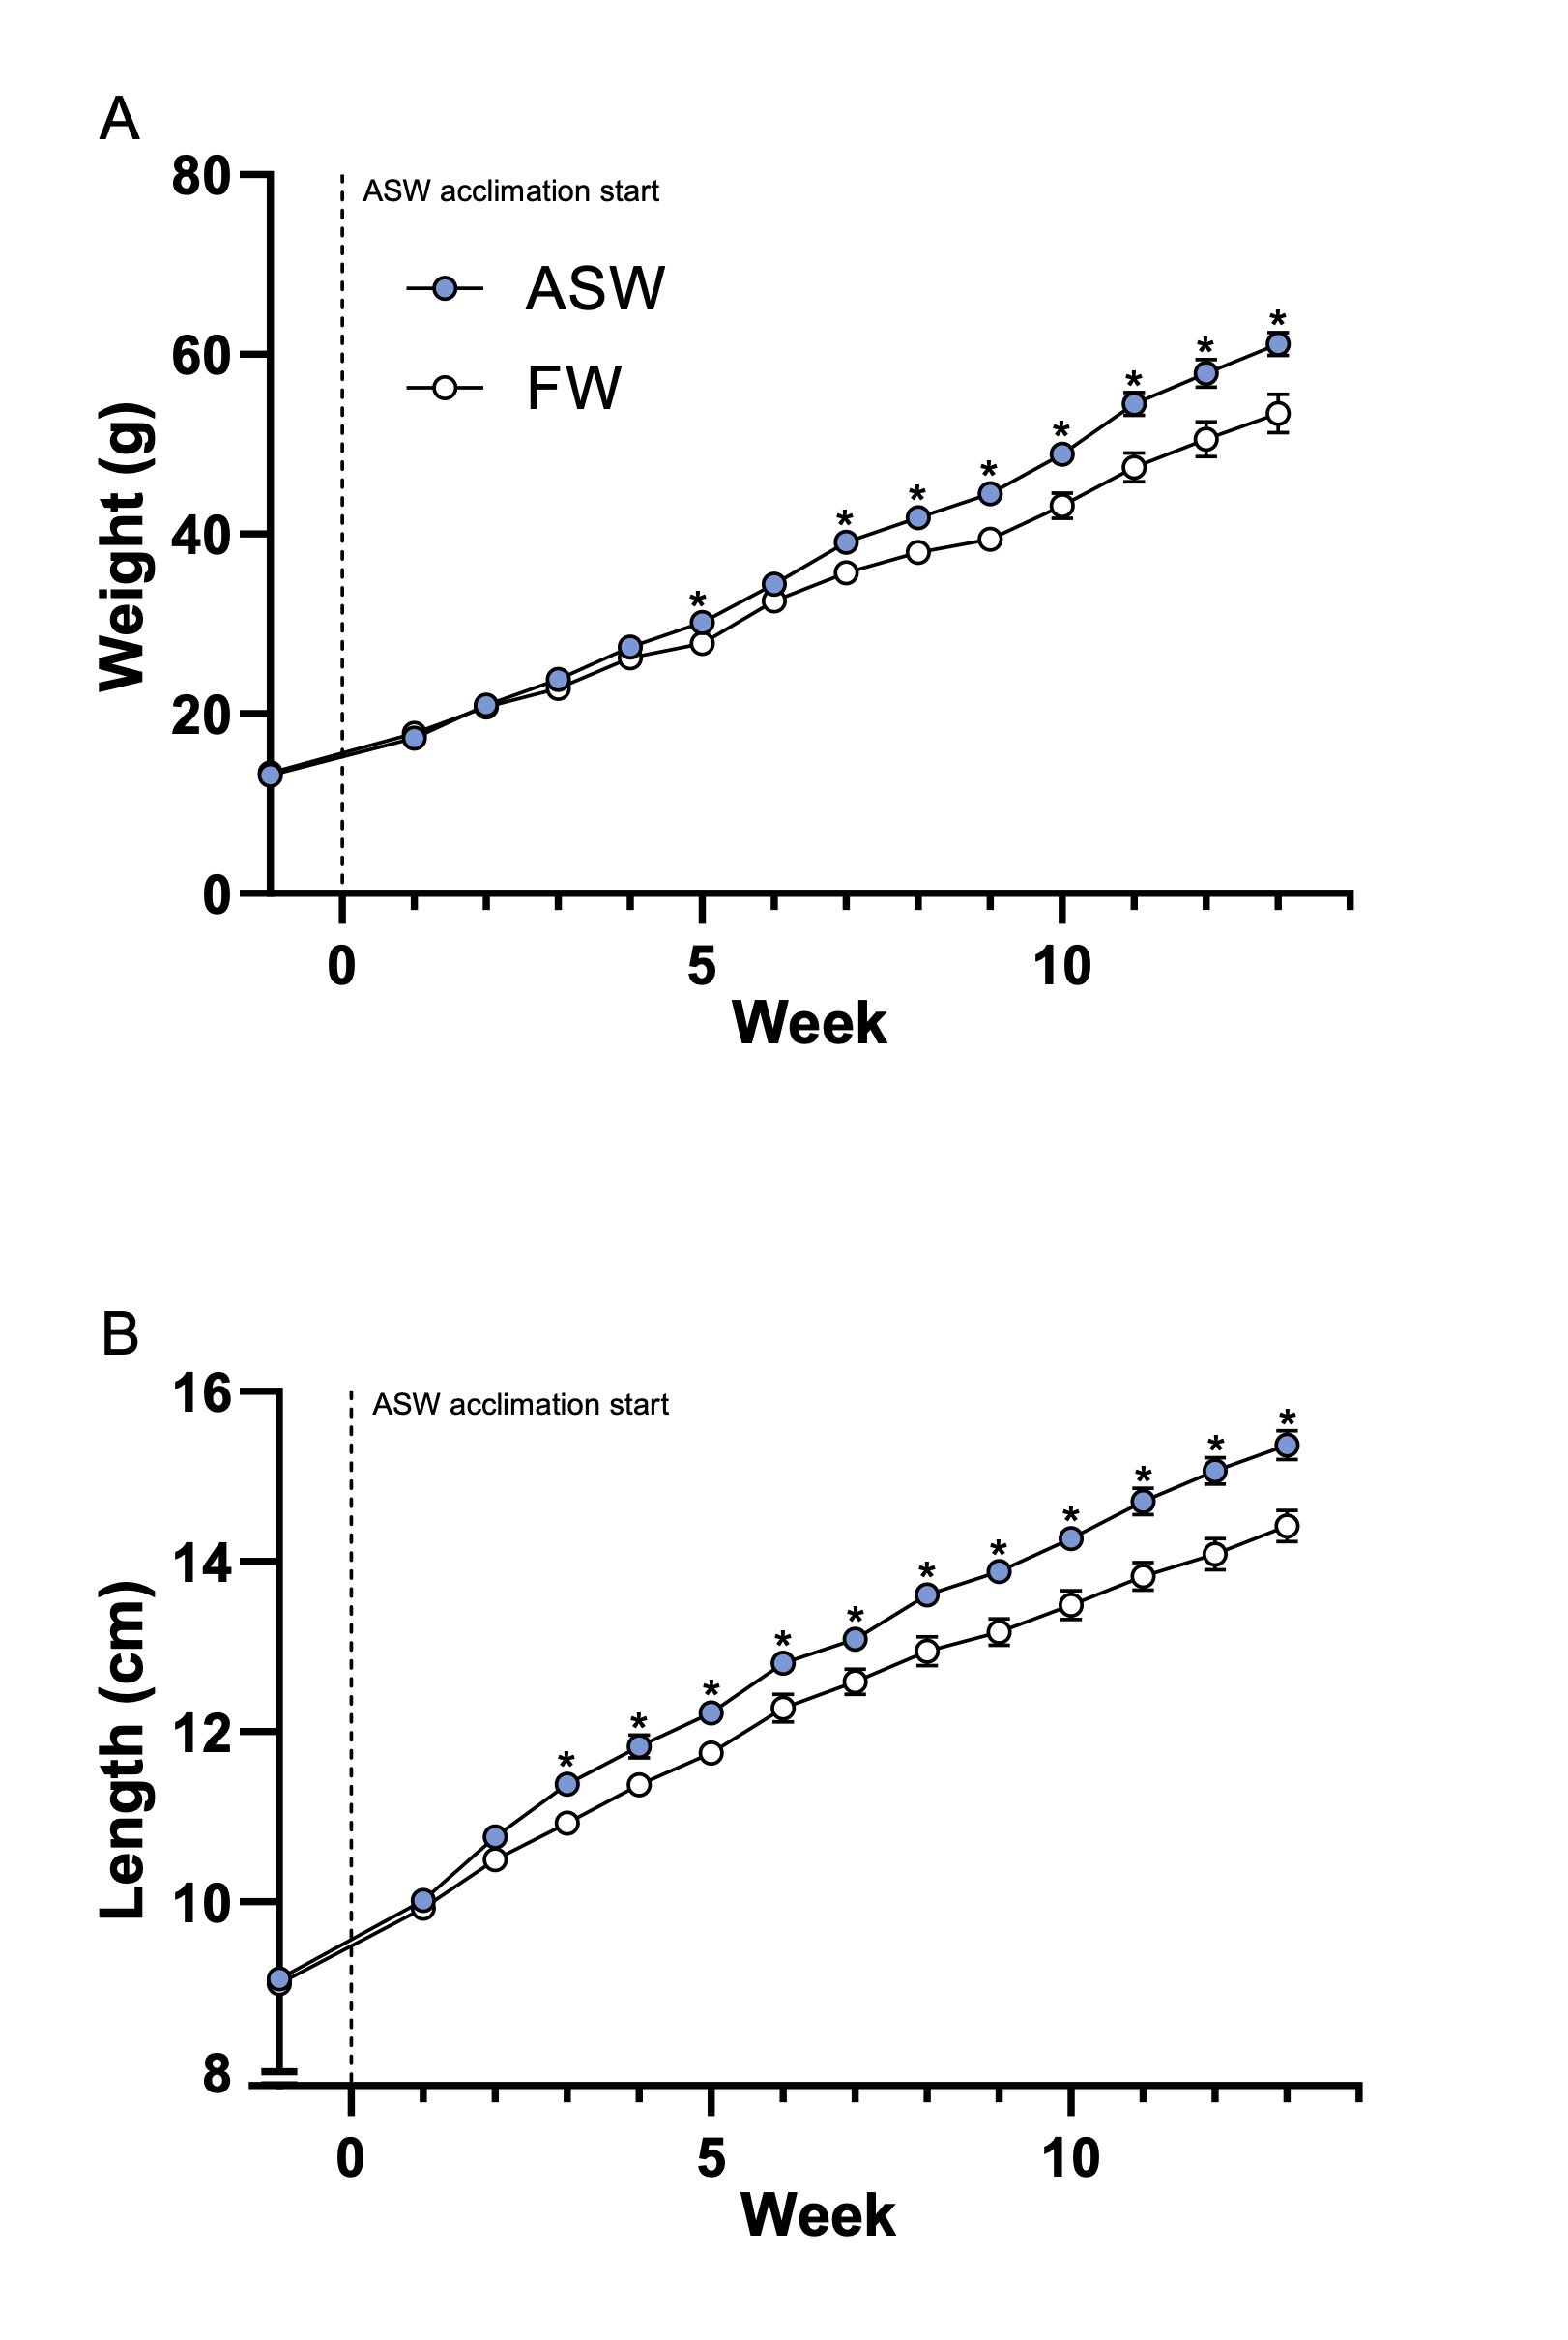
The sex ratios (female: male) averaged 1:1.42 ± 0.15 in the FW group and 1:1.78 ± 0.28 in the ASW group (P = 0.29). Over the course of the trial, SGR was higher in fish grown in ASW compared with those in FW (1.50 ± 0.03 vs. 1.30 ± 0.05, respectively, P < 0.01), with differences in body weight first measured at week 5 and then at week 7 through the remainder of the trial (Figure 2A). Considering weekly measurements, body length was initially similar between the two salinities. Still, by week 3 and until the end of the trial, fish in ASW were longer than in FW (Figure 2B). Condition factor (K) was lower in fish reared in ASW by weeks 3 and 6, with no further differences observed thereafter (Table 1). SGR was higher in fish reared in ASW than in FW as early as week 2 (Table 1).
_and_length_(2b)_(n_5)_of_mozambique_tilapia_raised_in_either_as.jpg)
Feed efficiency
The total increase in tank biomass was greater in fish reared in ASW than those in FW (1,096 ± 29.2 g vs. 878 ± 48.8 g, respectively, P < 0.01). However, the total feed given to fish in both salinities did not differ (ASW 918.5 ± 21.9 g vs. FW 905.9 ± 28.4 g, P = 0.73). A decreased FCR was detected in fish in ASW as early as week 2 and then at weeks 9 and 11 (Table 1). Using total feed consumed and total biomass increase over the 13 weeks, overall FCR was lower in fish grown in ASW compared with those reared in FW (0.84 ± 0.02 vs. 1.04 ± 0.29, respectively, P < 0.01).
Sexual dimorphism
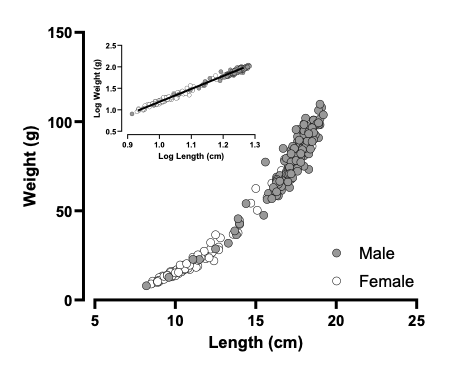
In FW, males were larger than females with respect to weight (74.5 ± 2.3 g vs. 24.2 ± 2.6 g, P < 0.001) and length (16.8 ± 0.2 cm vs. 11.1 ± 0.3 cm, P < 0.001) by week 13. Similarly, in ASW, males were heavier (80.1 ± 1.9 g vs. 29.8 ± 3.3 g, P < 0.001) and longer (17.5 ± 0.2 cm vs. 11.9 ± 0.4 cm, P < 0.001) than females. The correlation between weight (g) and total length (cm) of males and females at week 13 is shown in Figure 3. While there was marked size dimorphism between the sexes, a regression of the log-transformed data indicates that the males and females exhibit similar weight-length relationships (Fig. 3, inset). The regression equations for males and females were (Y = 2.97 * X – 1.79; R2 = 0.95) and (Y = 3.00 * X – 1.82; R2 = 0.98), respectively (not shown on graph). Because the slopes of these regressions were not significantly different (P=0.7), a single regression equation (Y = 2.99 * X – 1.81) was used to describe the relationship between weight and length in both sexes (Fig. 3).
_and_length_(cm)_of_males_(grey_circles__n___150)_and_females_(wh.png)
Morphometric data variability
The variation in fish weights and lengths was calculated at week 13 of the trial (Table 2). Greater within-tank variance (σ2within) was observed compared to between-tank variance (σ2between) when combining males and females. When the data was separated by sex, although the within tank variance decreased, the between tank variance increased for both weight and length, thus decreasing the effect size and projected power (data not shown). Based on the observed effect size of 2.34 for length, the projected statistical power was 0.76, 0.90, and 0.96 for sample sizes of three, four, and five tanks, respectively. The observed effect size for weight was 1.95, yielding power levels of 0.63, 0.78, and 0.88 for sample sizes of three, four, and five tanks, respectively (Table 2).
Water Quality Parameters
In the ASW system, salinity was initially raised to 24 ppt during week 1, and then ranged between 28.6 - 33.5 ‰, while in the FW system, salinity was maintained at 0 ‰ (Table 3). Water temperature ranged from 26-30 ℃ in both systems throughout the trial and did not differ between FW or ASW at any week. At weeks 1 and 3, average weekly DO was lower in ASW than FW, though consistently kept above ~6.2 mg/L in both systems throughout the trial. The concentration of TAN did not exceed 0.35 ppm throughout the study, and the combined nitrite-nitrate did not exceed 22 ppm. Although nitrite-nitrate measurements were not separated with the nutrient autoanalyzer, colorimetric tests (API® Freshwater Master Test Kit, API® Saltwater Master Test Kit) performed on alternate days indicate that nitrites did not exceed 0.25 ppm while nitrate ranged between 0-20 ppm throughout the duration of the trial (data not shown). The results of our colorimetric tests indicate that the increasing levels of nitrite-nitrate, as measured by the autoanalyzer in the latter weeks of the trial, primarily consist of nitrates.
Discussion
Land-based RAS offer the potential to both increase production and reduce water use.2,3 Incorporating these concepts, the design of TAREC, a dual RAS facility, also took into consideration the integration of several requirements needed to offer the versatility required for addressing research, education, and extension projects. The option to change water parameters and species, along with customizability, played a major role in designing the system. Moreover, built at an elevated grade, both RAS’s minimize energy use by supplying tank arrays with clarified and biofiltered water using a single variable speed pump each. A trial to evaluate the two RAS arrays revealed that Mozambique tilapia reared in ASW increased body mass ~15% above those in FW by the end of three months. Inasmuch as the FCR of ASW fish was lower than FW fish, the increased growth observed in fish reared in ASW was due to a greater efficiency in converting feed into body mass than to an increase in the amount of feed consumed.
A number of RAS facilities have been evaluated and described, spanning a range of design considerations according to location, use, and available resources.24–26 Fully enclosed RAS facilities, for example, provide maximal environmental control and may be outfitted with replicate RAS arrays at high levels of intensification, with strategies for maximizing water quality at high stocking densities, such as liquid oxygen supplementation and ozone treatment systems, or co-production with microalgae.27,28 Resources available to develop TAREC, at least initially, allowed for an outdoor design encompassing two main RAS arrays equipped with the required monitoring systems. Based on the facilities’ capacity for intensification, the RAS arrays were tested at low stocking densities and in accordance with the local IACUC’s recommendation of <5 kg/m3 for tilapia. Moreover, based on TAREC’s design, the replication of experimental treatments is limited to individuals and tanks, rather than complete recirculating systems. In the current trial, for example, replicate tanks were supplied with two different RAS water types (FW and ASW). Depending on experimental requirements, however, tanks may be outfitted with individual filtration systems and/or other forms of environmental control and monitoring, thereby allowing them to be operated independently from the main RAS arrays.
Given that the trial conducted was the first to test the facility with live animals, an established experimental salinity paradigm was chosen, employing a well-studied and resilient species, the Mozambique tilapia. Moreover, to minimize the risk of adversities, stocking densities and system nutrient loading were kept to a minimum. Theoretically, the biofiltration capacity of RAS’s can be calculated based on the volume of media in the MBBR units. Using conservative TAN conversion rates estimated at 1.0 g TAN/m2 per day for FW systems and 0.6 g TAN/m2 per day for SW systems,3 it can be estimated based on the available MBBR surface areas that about 555 g and 333 g of TAN can be removed daily in R2 (filled with FW) and R1 (filled with ASW) systems, respectively. Given that each kg of protein from fish feed produces roughly 92 g TAN,3 it is possible to estimate the amount of TAN produced by feed based on its protein content. Using the feed employed in the current study (40% protein content), the amount of TAN produced would be equivalent to 36.8 g TAN/kg feed (92 g TAN/ kg protein * 0.40 kg protein/ kg feed). The maximum feed rate per day can then be estimated by dividing the daily TAN removal rate by the amount of TAN produced per kg of feed, assuming continuous feeding over a 24-h period. Realistically, if fish are fed once daily, the fish will excrete almost all the TAN in a 4-h period post-feeding.3 Therefore, the time period can be reduced from one day to 4-h (1/6 day), yielding an estimated maximum feed rate of ~2.5 kg/day for the FW system [(555 g TAN/day) / (36.8 g TAN/ kg feed) = 15.08 kg feed/day * 1/6 day] for the FW system, and ~1.5 kg/day for the ASW system [(333 g TAN/day) / (36.8 g TAN/kg feed) = 9.04 kg feed/day * 1/6 day]. In the current trial, ~4.5 kg (905.9 g per tank * 5 tanks in FW or 918.5 g per tank * 5 tanks in ASW) of feed were fed over 13 weeks, averaging a feed rate of ~49.5 g/day. The final system biomass of fish in FW and ASW was ~6.1 and ~7.1 kg, respectively. Using FCRs obtained from the current study, the estimated maximum feed rates would yield theoretical maximum biomass capacities of ~308 kg and ~215 kg for FW and ASW systems, respectively. These estimates, however, do not consider a range of other factors that may influence water quality and fish health, such as the presence of algae and other microorganisms in systems and stocking densities.
Water quality parameters of common concern in RAS, including levels of TAN and nitrite-nitrate, were closely monitored. Despite a 10% weekly water change, nitrate levels increased towards the later weeks of the trial, especially in the ASW system. This trend could be caused by the higher growth and feed consumption of fish in the ASW system, resulting in greater accumulation of nitrogenous waste than could be exchanged with weekly water changes. Importantly, however, TAN, nitrite, and nitrate concentrations were kept one to two orders of magnitude below toxic levels reported for tilapia (2 ppm, 5 ppm, and 500 ppm, respectively; Rakocy29; Monsees et al.30). While well within optimal levels for growing out Mozambique tilapia, water change rates and additional filtration capabilities may need to be considered for further stabilizing water parameters, depending on species and experimental conditions.
Previous studies have demonstrated differences in growth between Mozambique tilapia reared in flow-through FW versus SW systems and fed fixed rations based on their age. For example, in a six-month trial, fish in SW grew twice as fast as those in FW, but differences in body weight were not seen during the first four months.20,31 In another study, the growth rate was reduced when fish were transferred from SW to FW for at least 21 days.32 In contrast to the abovementioned experiments, Mozambique tilapia employed in this study were kept in RAS and fed ad libitum, with the amount of feed eaten quantified for the calculation of FCR. Nonetheless, fish reared in ASW outgrew those in FW and showed lower FCR, corroborating findings in other systems (flow-through) and feeding regimes. A number of other studies have shown adaptive changes in physiological parameters that facilitate salinity acclimation while underlying increased growth rates in Mozambique tilapia reared in SW environments, such as through activation of the growth hormone/ insulin-like growth factor system,12,33,34 despite evidence of higher metabolic rates35 and branchial catabolism36 when fish are transferred from FW to SW. Interestingly, DO levels were generally lower in ASW compared with FW, though that was not an impediment to the superior growth performance observed in fish in ASW.
Growth patterns in Mozambique tilapia are sexually dimorphic, with males growing faster and larger than females of the same cohort.14,37 This pattern was confirmed in the current trial, with males being larger than females by week 13, regardless of tank salinity, and likely contributing to the high individual variation in length and weight within tanks (Table 2). In addition to sexually dimorphic growth patterns, social interactions between individuals, including breeding behavior and territorial disputes, can contribute to individual variation (Toguyeni et al., 2005). The lower σ2between relative to σ2within, however, suggests that these individual differences are equally distributed across tanks. Thus, relative to using individual means, using tank means for growth data largely decreases variation while increasing effect size, especially in sexually dimorphic species.
Generally, the description and evaluation of novel research facilities are important to optimize resource utilization and scientific output, while disseminating capabilities and limitations to researchers, educators, and collaborators.24,26
In summary, the TAREC facility was designed and built to: (1) rear aquatic species used for education, extension, and scientific research; (2) provide consistent water quality across experimental tanks connected to a given RAS, which is particularly useful in studies focusing on the physiological requirements of fish in recirculating environments; (3) serve as a versatile venue for exploring approaches to mitigate energy consumption and waste production; (4) disseminate fundamental and applied research outcomes of aquaculture; and (5) train the next generation of aquaculture researchers and practitioners with regional priorities in mind. By addressing these interconnected objectives, TAREC serves as a hub for innovation in sustainable aquaculture, directly supporting Hawaiʻi’s strategic vision for economic resilience, environmental stewardship, and community well-being. While successfully meeting the expected outcomes of an initial growth trial to evaluate the system, further investigations aimed at evaluating other species, integrated approaches, and efficiencies shall continue to pave the way for the full realization of TAREC’s priorities.
Acknowledgments
This work was funded in part by startup funds from the College of Tropical Agriculture and Human Resources and Office of the Vice Chancellor for Research of the University of Hawaiʻi at Mānoa to A.P.S.; grants from the National Institute of Food and Agriculture (Hatch no. HAW02051-H) to A.P.S.; the National Science Foundation (IOS-1755016) to A.P.S. and D.T.L.; and the National Oceanic and Atmospheric Administration (NA18OAR4170347 and NA18OAR4170076) to A.P.S., D.O. and D.T.L.; and projects R/SS-38, R/SS-39 and R/SS-46 to A.P.S., which are sponsored by the University of Hawaiʻi Sea Grant College Program, SOEST, under Institutional Grant No. NA18OAR4170347. The views expressed herein are those of the authors and do not necessarily reflect the views of NOAA or any of its subagencies. UNIHI-SEAGRANT-4952.
Authors’ contributions
Conceptualization: Andre P. Seale (Equal), Bradley K. Fox (Equal), Darren K. Okimoto (Equal), Darren T. Lerner (Equal). Methodology: Andre P. Seale (Equal), Bradley K. Fox (Equal), Ryan J. A. Chang (Equal), Reilly S. Merlo (Equal), Tyler R. Goodearly (Equal), Ke Cao (Equal), Patrick Mccrary (Equal), Brendon Lau (Equal). Investigation: Andre P. Seale (Equal), Fritzie T. Celino-Brady (Equal), G. H. T. Malintha (Equal), Ryan J. A. Chang (Equal), Reilly S. Merlo (Equal), Tyler R. Goodearly (Equal), Ke Cao (Equal), Daniel W. Woo (Equal). Visualization: Andre P. Seale (Equal), Ryan J. A. Chang (Equal), Reilly S. Merlo (Equal), Tyler R. Goodearly (Equal), Ke Cao (Equal). Writing – original draft: Andre P. Seale (Lead). Writing – review & editing: Andre P. Seale (Equal), Bradley K. Fox (Equal), Fritzie T. Celino-Brady (Equal), G. H. T. Malintha (Equal), Ryan J. A. Chang (Equal), Reilly S. Merlo (Equal), Tyler R. Goodearly (Equal), Ke Cao (Equal), Daniel W. Woo (Equal), Darren K. Okimoto (Equal). Funding acquisition: Andre P. Seale (Equal), Darren K. Okimoto (Equal), Darren T. Lerner (Equal). Supervision: Andre P. Seale (Lead). Project administration: Andre P. Seale (Lead).
Competing Interest – COPE
No competing interests were disclosed.
Ethical Conduct Approval – IACUC
The Institutional Animal Care and Use Committee, University of Hawaiʻi, approved the animal experiment (Protocol No. 98-037-26).
Informed Consent Statement
All authors and institutions have confirmed this manuscript for publication.
Data Availability Statement
All data are available upon reasonable request.