


1. Introduction
Babylonia areolata, a member of the class Gastropoda, order Neogastropoda, and family Buccinidae, is widely distributed across the coastal waters of the South China Sea and Southeast Asia.1 B. areolata is a commercially important marine gastropod with substantial economic value. Owing to its high nutritional content and palatable taste, B. areolata has become a key aquaculture species in coastal China, particularly in Guangdong, Fujian, and Hainan provinces.2 In the wild, this omnivorous species primarily consumes benthic organisms, organic detritus, and small crustaceans, whereas in aquaculture settings, its diet mainly comprises minced fish, shellfish, and formulated feeds.3 The aquaculture environment critically influences the growth, immunity, and survival of B. areolata, with substrate conditions serving as a pivotal factor that impacts water quality, sediment physicochemical properties, and microbial communities, thereby affecting gut health and growth performance.4 Commonly used aquaculture substrates, such as sandy, muddy, mixed, and artificial types, differentially influence feeding behavior, digestive metabolism, and gut microbiota composition.5 In recent years, with ongoing improvements in aquaculture systems, microecological research on the culture environment has garnered increasing attention. Among these, the gut microbiota, serving as a crucial mediator of host–environment interactions, has emerged as a focal point.
The gut microbiota constitutes a vital component of the host digestive system, playing essential roles in nutrient absorption, immune modulation, and overall growth and development.6 The composition and function of gut microbial communities are influenced by numerous factors, including host genotype,7,8 dietary composition,9,10 environmental variables11,12 and culture conditions.13–15 Understanding microbial diversity is, therefore, crucial for optimizing aquaculture management and enhancing production yields. Traditional microbiological identification primarily depends on culture-based techniques, which are limited by the fact that most gut microbes are unculturable under standard laboratory conditions. In recent years, advances in high-throughput sequencing (HTS) technologies, such as 16S rRNA gene sequencing, metagenomics, and transcriptomics, have greatly accelerated research in gut microbiology.16 Among these methods, 16S rRNA gene sequencing is most widely employed due to its cost-effectiveness and efficiency. It enables identification of community composition, and quantification of α-diversity (e.g., Chao1, Shannon index) and β-diversity (e.g., principal coordinate analysis [PCoA], non-metric multidimensional scaling [NMDS]).17–19 Recent studies have made notable progress in elucidating gut microbial communities in fish, shrimp, and other aquatic species. Zheng et al. (2025) reported that different co-culture modes significantly altered both the gut and environmental microbial communities of Takifugu rubripes. The observed differences were likely driven by shifts in environmental physicochemical parameters induced by varying culture practices.20 Gu et al. (2024) observed temporal variation in the dominant bacterial taxa in both the aquatic environment and intestinal tract of Litopenaeus vannamei during the factory farming process.21 Zhou et al. (2023) demonstrated that dietary supplementation with Bacillus and Lactobacillus enhanced the intestinal microbiota of Ictalurus punctatus, increasing community diversity and boosting the relative abundance of beneficial taxa such as Burkholderia spp..22 Nian et al. (2023) revealed the structure and diversity of the gut microbiota in Haliotis discus hannai during its transmigratory developmental stage.23 In shellfish, the gut microbial communities of bivalves (e.g., oysters, mussels) exhibit significant variation across different growth environments, closely correlating with the physicochemical properties of the culture substrate.24,25 In B. areolata, gut microbial community structure is strongly influenced by feed composition and environmental conditions. However, few studies have explored how different substrate types impact microbial diversity. Moreover, certain studies suggest that the culture substrate affects not only the physicochemical parameters of the water column but also the stability of the gut microbiota in B. areolata, potentially through changes in sediment microbial composition and metabolic activity.26,27 Therefore, investigating the composition and ecological functions of gut microbiota in mottled B. areolata under varying substrate conditions can help elucidate host-environment -microbe interactions, offering a scientific foundation for optimizing aquaculture strategies.
In summary, investigating the effects of different culture substrates on the diversity of gut microbial communities in B. areolata offers insights into the role of microbiota in host adaptation to environmental changes, while also providing a scientific basis for optimizing substrate selection and improving aquaculture environments. In this study, high-throughput sequencing was employed to analyze the composition and functional potential of the gut microbiota in B. areolata under varying substrate conditions, aiming to elucidate its ecological adaptation mechanisms and potential health implications, thereby offering theoretical support for sustainable aquaculture practices.
2. Materials and methods
2.1. Material
The experimental animal, B. areolata, was supplied by the Sanya Tropical Fisheries Research Institute. Juvenile B. areolata exhibiting uniform size, normal burrowing behavior, and robust vitality were selected for the experiment. The mean shell height, shell width, and body mass of the selected juveniles were (10.40±0.39) mm, (6.90±0.27) mm and (0.231±0.020) g, respectively. The juveniles were temporarily maintained in a land-based recirculating aquaculture system at the Wenchang Fengjiawan Modern Fishery Industry Base.
2.2. Experimental methods
2.2.1. Experimental design
An indoor recirculating aquaculture system (RAS) was employed to minimize the influence of external environmental factors and maintain stable experimental conditions. The incoming water was sterilized using ozone and ultraviolet (UV) irradiation before being circulated into the experimental tanks. Three experimental groups were established, each with a different substrate covering the bottom of the culture tanks: small ceramic grains (SC), silica sand (SS), and river sand (RS). Each treatment included three replicates to ensure statistical reliability. The particle sizes of the substrates were as follows: 2 mm for small ceramic grains, and 1–2 mm for both silica sand and river sand. All substrates were evenly spread across the tank bottom to a uniform thickness of 2.5 cm.
Each experimental tank was stocked with 10 kg of juvenile B. areolata for the culture trial. The feeding trial lasted for 60 days, during which the snails were fed a formulated diet. The feeding rate was set at 5% of the total body weight of the snails. Feeding was performed once daily at 08:00. Residual feed was examined at 30- and 60-minutes post-feeding, and observations of burrowing and wall-climbing behavior were recorded. The water exchange rate in the RAS was maintained at 150–200% per day. Key water quality parameters were controlled within the following ranges: temperature, 28–30°C; salinity, 30–32‰; pH, 7.5–8.2; dissolved oxygen, ≥7.0 mg·L⁻¹; ammonia nitrogen, ≤0.2 mg·L⁻¹; and nitrite, ≤0.02 mg·L⁻¹.
2.3. Testing of samples
2.3.1. Sample processing
Thirty healthy B. areolata individuals with intact shells and no visible mechanical damage were randomly selected from each of the SC, RS, and SS groups. The selected snails were placed in sterile ice trays on a sterile workbench. Their shells were carefully broken, and the intestines were aseptically extracted and transferred into 50 mL sterile centrifuge tubes. The intestinal samples were homogenized with 0.2 mol/L saline at a mass-to-volume ratio of 1:2. The homogenate was centrifuged at 5,000 rpm for 10 minutes at 4°C. The resulting supernatant was collected and stored at –80°C for further analysis.
Genomic DNA was extracted from the intestinal homogenates using a commercial DNA extraction kit, following the manufacturer’s protocol. DNA integrity was assessed using 1% agarose gel electrophoresis, while concentration and purity were determined using a NanoDrop One spectrophotometer. PCR amplification was performed using genomic DNA as a template with region-specific barcoded primers and Premix Taq (TaKaRa). Amplicons were verified by agarose gel electrophoresis. PCR product concentrations were quantified using GeneTools Analysis Software (v4.03.05.0, Syngene), and equal-mass volumes were calculated for pooling. The pooled PCR products were purified using the E.Z.N.A.® Gel Extraction Kit, and target DNA fragments were eluted with TE buffer.Sequencing libraries were constructed using the NEBNext® Ultra™ DNA Library Prep Kit for Illumina®, following the standard protocol. The libraries were then sequenced on Illumina HiSeq or MiSeq platforms. All sequencing procedures were conducted by Guangdong Magigene Technology Co., Ltd.
2.4. Data analysis
Statistical analyses were performed using SPSS version 21.0. Results are presented as means ± standard deviations (mean ± SD). Paired-end (PE) reads obtained from the Illumina MiSeq platform were merged based on overlapping regions, followed by quality control and filtering of the merged sequences, and subsequent clustering of Operational Taxonomic Units (OTUs).
2.4.1. OTU analysis
After OTU clustering, the number of OTUs in each sample and the number of sequences per OTU were quantified. All representative sequences were aligned against the SILVA reference database (http://www.arb-silva.de) to assign taxonomic classifications to each OTU using a 97% sequence similarity threshold to identify the closest known taxonomic relatives.28
2.4.2. Alpha Index Analysis
Alpha diversity refers to microbial diversity within a specific habitat or ecosystem, serving as a comprehensive measure that incorporates both species richness and evenness. Community richness is typically assessed using the Chao1 and ACE indices, while community diversity is evaluated using the Shannon and Simpson indices. Specifically, higher Chao1 and ACE values indicate greater species richness, whereas a higher Shannon index denotes greater diversity. In contrast, a higher Simpson index reflects lower diversity due to its inverse relationship with diversity.29 Alpha diversity indices were calculated using Mothur software (version 1.30).
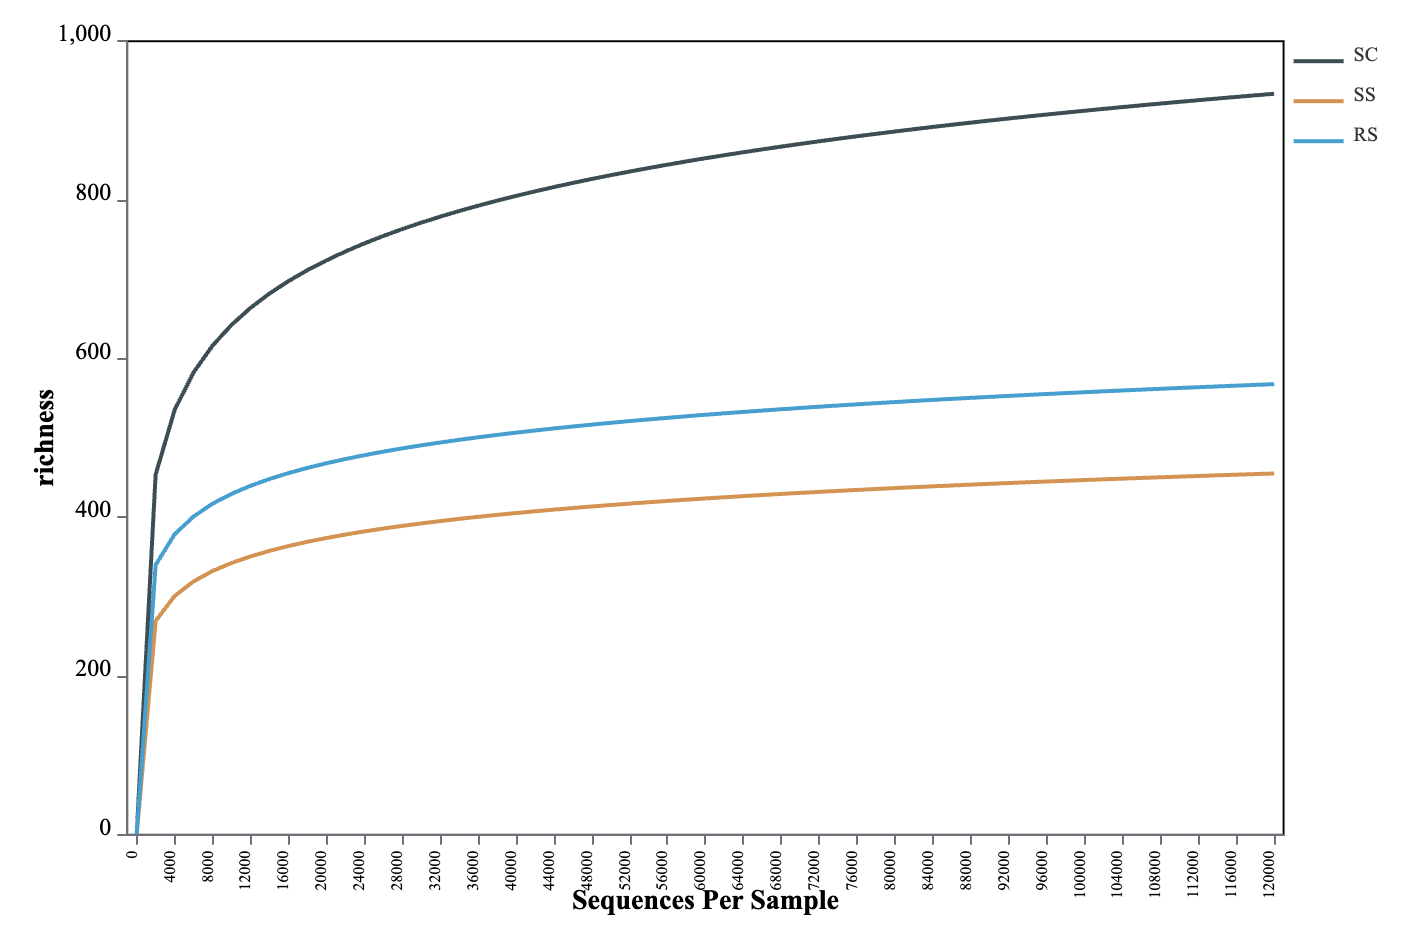
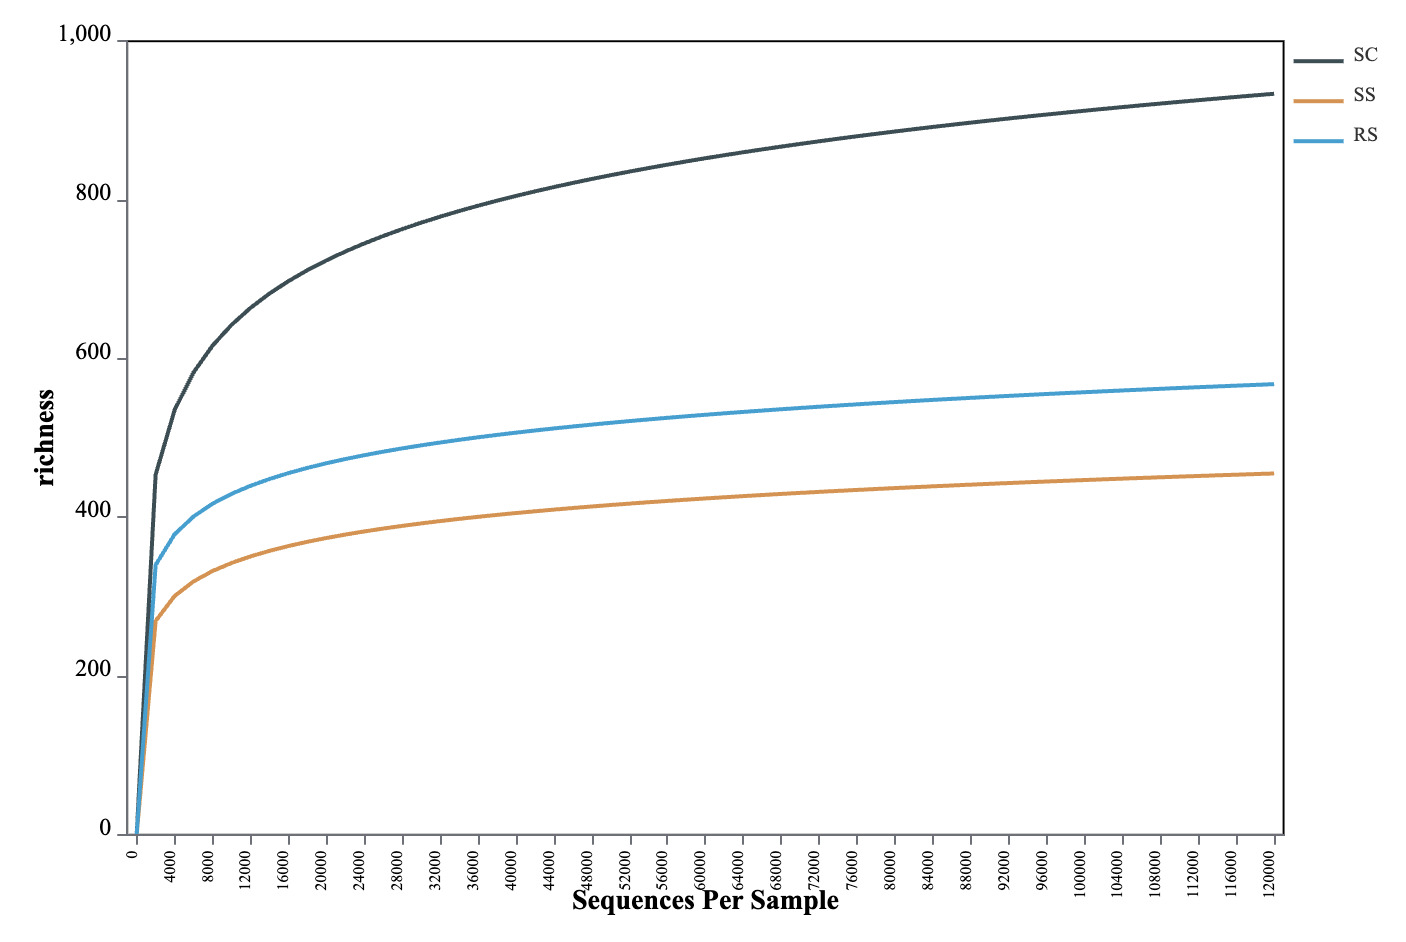
2.4.3. Dilution curve analysis
The rarefaction curve30 is generated by randomly subsampling individuals from the sample, calculating the cumulative number of observed species, and plotting the relationship between sequencing depth and species richness. A plateau in the curve indicates that the sequencing depth is sufficient to capture the majority of species diversity within the sample. Rarefaction analysis was conducted using Mothur software (version 1.30), and the curves were visualized using a Perl-based plotting script.
2.4.4. PCA analysis
Principal Component Analysis (PCA)31 reduces the dimensionality of multivariate data by decomposing variance, allowing visualization of differences in microbial community composition across samples in a two-dimensional space. Samples positioned closer together on the PCA plot indicate greater similarity in community composition. PCA plots were generated using R software.
3. Results
3.1. Sequencing Results
A total of 1,446,502 paired-end reads were obtained from 16S rRNA gene sequencing of 15 gut samples of B. areolata cultured in different substrate environments. To investigate species composition and microbial diversity, clean tags were merged and quality-filtered, followed by chimera removal and clustering into Operational Taxonomic Units (OTUs), yielding a total of 9,975 OTUs. As shown in Table 1, OTU numbers varied across samples, with SC1 exhibiting the highest OTU count (1,721) and SS2 the lowest (239). The Venn diagram (Fig. 1) illustrates the number of shared and unique OTUs among the three substrate groups. According to Fig. 1, a total of 3,722 clustered OTUs were observed across the 15 samples, among which the SC group possessed the highest number of unique OTUs (1,675), exceeding those of both the SS and RS groups. A total of 568 OTUs were shared across all three substrate environments, representing 15.26% of the total observed OTUs. These shared OTUs accounted for 20.98%, 44.44%, and 37.25% of the SC, SS, and RS group totals, respectively.

Fig. 1 OTU Venn diagram
Note: SS: Sample from silica sand as a substrate for aquaculture environments; RS: Sample from river sand as a substrate for aquaculture environments; SC: Sample from small ceramic grains as a substrate for aquaculture environments. Same as below.
3.2. Analysis of the microbial community diversity
3.2.1. Analysis of microbial community α-diversity
The OTU-based rarefaction curve was used to assess sequencing depth and species richness of the gut microbiota in B. areolata. As shown in Fig. 2, when the number of reads was below 12,000, each curve exhibited a steep rise with increasing sequencing depth, indicating the presence of a large variety of microbial taxa in the gut of B. areolata. Between 12,000 and 24,000 reads, the curves began to plateau, suggesting that additional sequencing would yield diminishing returns in terms of detecting new taxa. The sequencing depth was therefore considered sufficient, as most microbial diversity had already been captured, and further sequencing would contribute little to the identification of additional OTUs. These findings indicate that the sequencing effort was adequate and the observed diversity representative of the gut microbial community. A slight increase in some curves beyond 24,000 reads may reflect residual low-abundance taxa or sequencing noise due to sequencing noise or sampling artifacts. Overall, the rarefaction analysis suggests that the gut microbiota sampled in this study was nearly exhaustively covered and adequately reflects the microbial diversity within each substrate group.
As shown in Table 1, the Coverage values of all samples exceeded 99%, indicating that nearly all sequences present in each sample were successfully detected, and the sequencing depth was sufficient. Higher OTU coverage reflects a greater likelihood of capturing the full microbial diversity within the samples. The near-complete Coverage values (~100%) further validate the reliability of the sequencing data and confirm that the microbial community structure and diversity were accurately represented. Comparison of Alpha diversity indices among the 15 samples showed that SC1 had the highest Chao1 value (1721.2), indicating the greatest species richness. SS3 had the lowest Simpson index (0.0493) and a relatively high Shannon index (5.62), suggesting that this sample exhibited the highest microbial diversity, characterized by a more even and complex community structure.
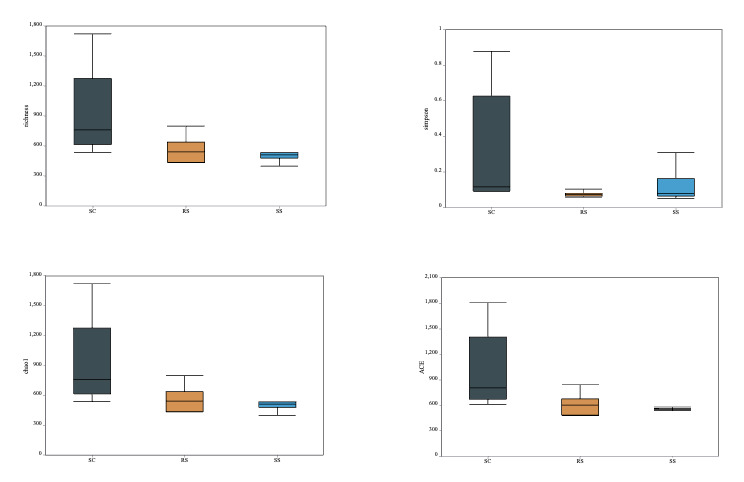
The richness index, Simpson index, Chao1 index, and ACE index were used to assess the α-diversity of the intestinal bacterial communities. As shown in Fig. 3, the SC group exhibited higher values for all four indices compared to the other two groups. However, no statistically significant differences were observed among the groups in terms of α-diversity under different substrate conditions. These results suggest that the SC group harbored a gut microbial community with the highest richness but relatively lower diversity. In contrast, the RS group had the lowest Simpson index, indicating the highest microbial diversity among the three groups of B. areolata.
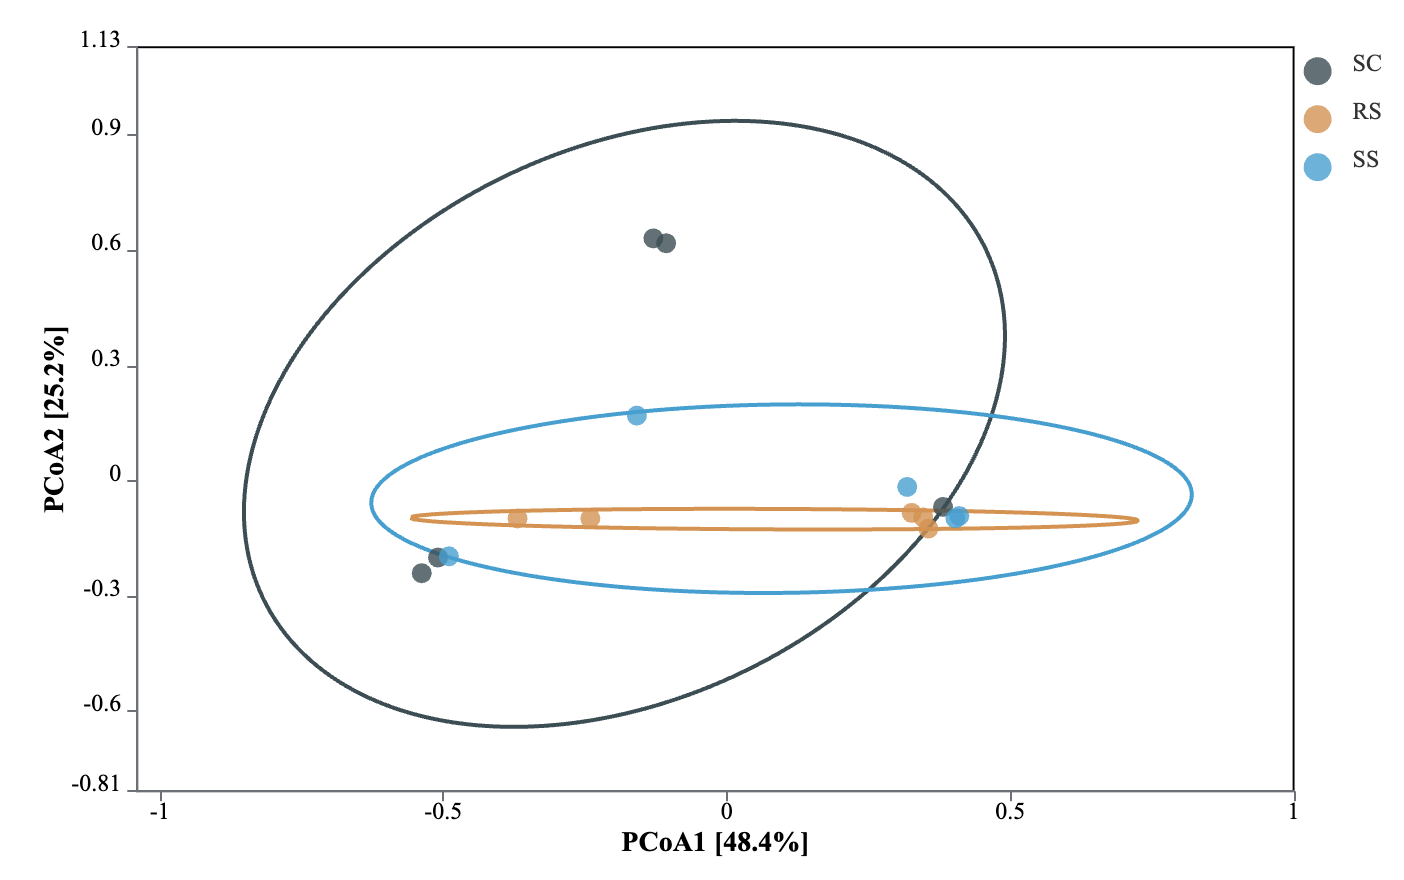
3.2.2. Analysis of the β-diversity of intestinal microbial community
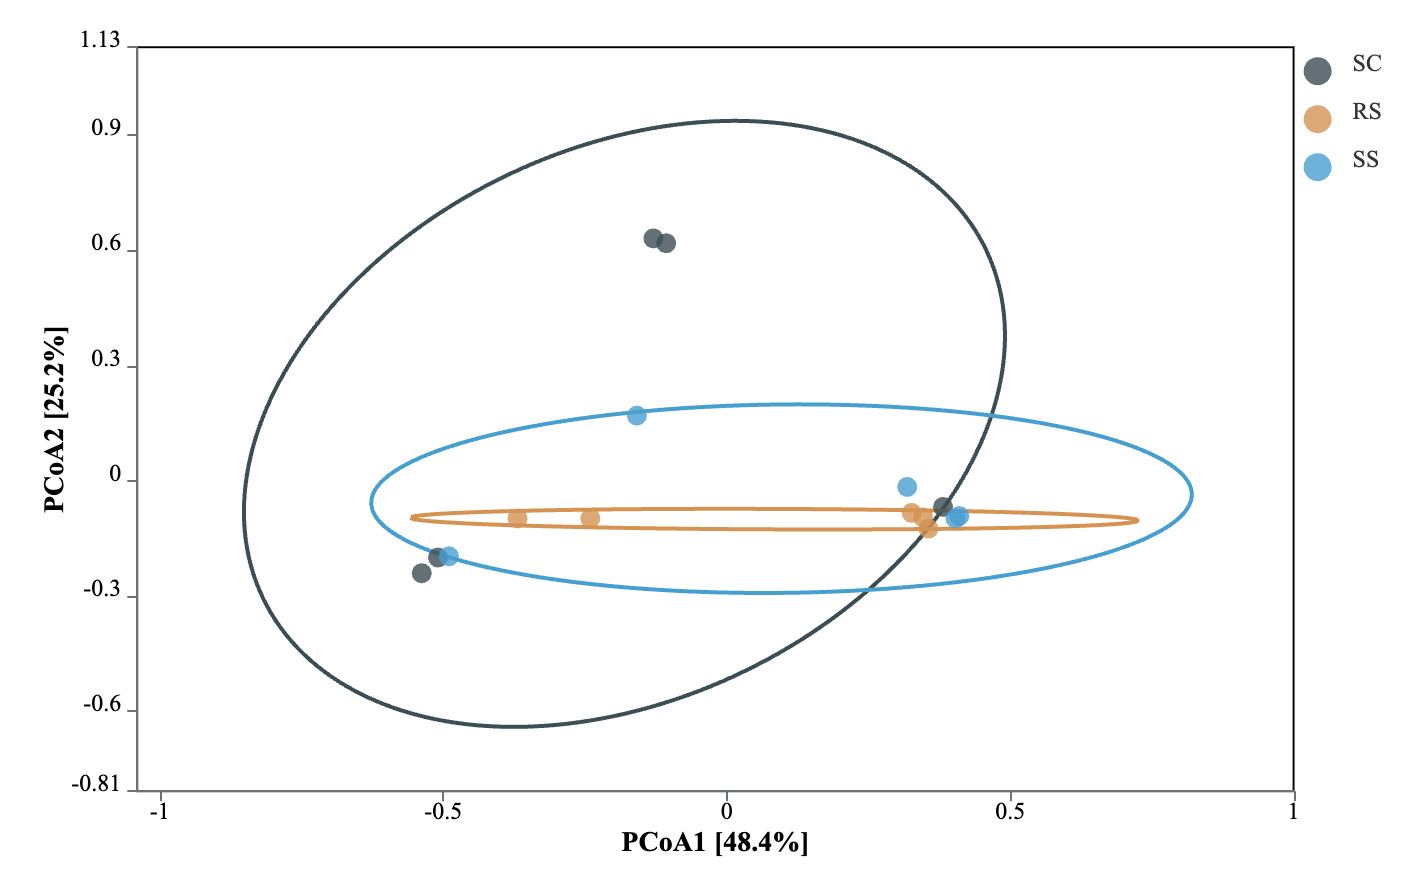
Principal coordinate analysis (PCoA) based on Bray-Curtis distance was used to assess the differences in the gut microbial communities of B. areolata under different substrate culture conditions (Fig. 4). The results showed that the first principal coordinate (PCoA1) explained 48.4% of the total variation, while the second principal coordinate (PCoA2) accounted for 25.2%. Significant structural differences in the gut microbiota were observed among the groups (P < 0.05), with the substrate type explaining 73.6% of the overall variation. Pairwise comparisons revealed a clear separation of microbial communities among the three groups, with the SC and RS groups showing the greatest dissimilarity, indicating substantial divergence in their gut microbiota composition.
3.3. Analysis of the composition of the intestinal microbial community
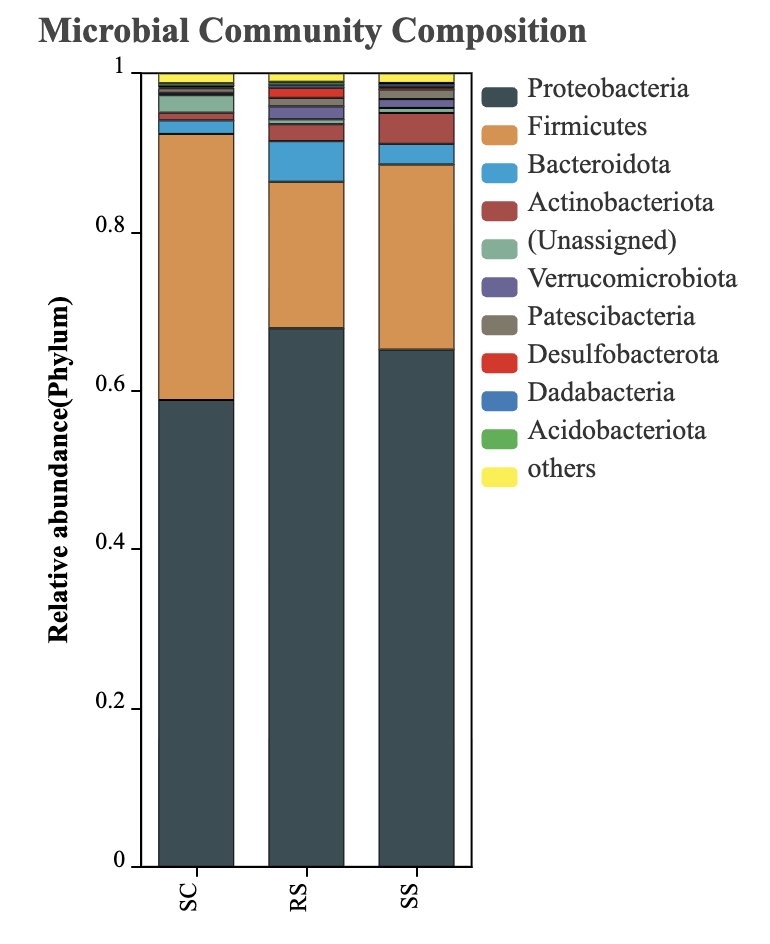
3.3.1. Microbial Community Composition at the Phylum Level
The intestinal microbial composition of B. areolata under different substrate conditions was analyzed at the phylum level. As shown in Fig. 5, only taxa with relative abundances greater than 0.01% were included, while unannotated species at the phylum level were grouped under “Others.” The results indicated that in the SC group, the dominant phyla (relative abundance >5%) were Proteobacteria (58.81%) and Firmicutes (33.53%). In the RS group, the dominant phyla included Proteobacteria (67.86%), Firmicutes (18.46%), and Bacteroidota (5.11%). For the SS group, Proteobacteria and Firmicutes were also dominant, accounting for 65.17% and 23.32%, respectively. These findings demonstrate that Proteobacteria and Firmicutes were the predominant phyla across all three groups. The combined relative abundance of these two phyla accounted for 92.35% in the SC group, 86.32% in the RS group, and 88.49% in the SS group, indicating their critical role in shaping the intestinal microbial communities of B. areolata.

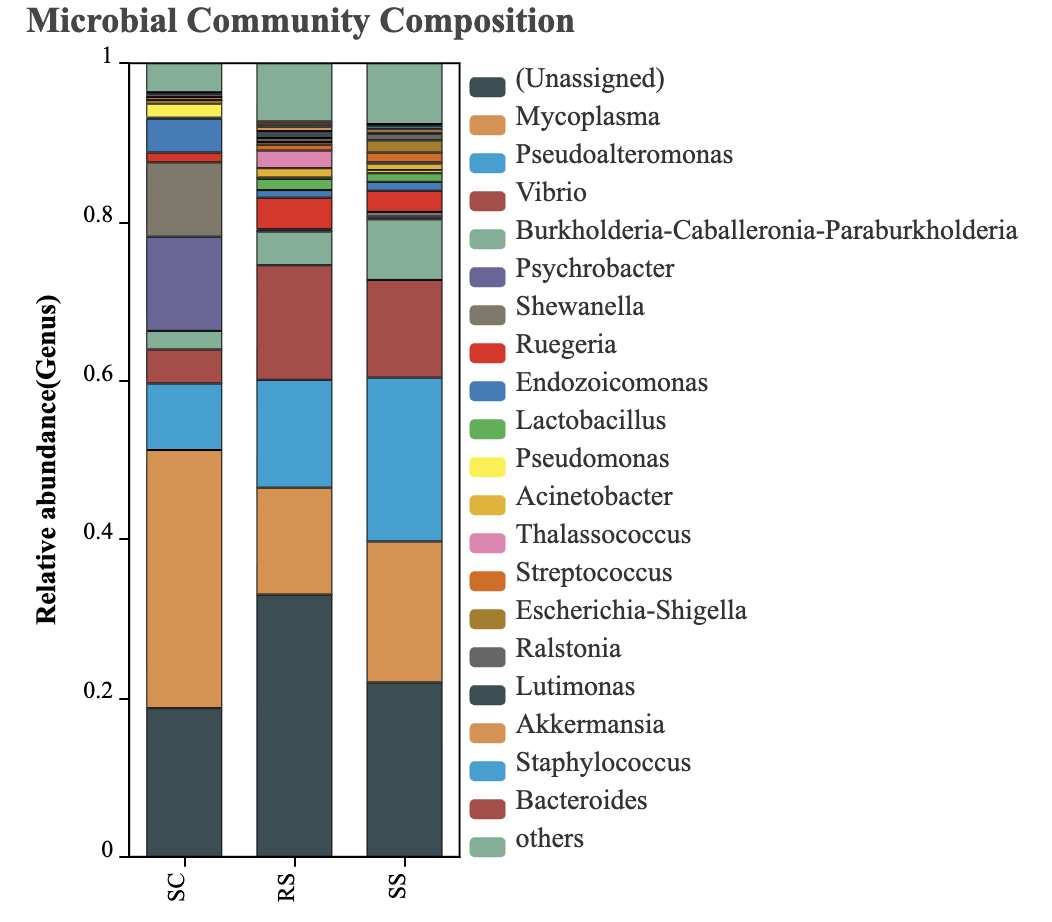
3.3.2. Microbial Community Composition at the Genus Level
The composition of the intestinal microbiota of B. areolata was further analyzed at the genus level. Only the top 20 genera based on relative abundance were included, while unannotated taxa at this level were grouped into the “Others” category. The results are presented in Fig. 6. In the SC group, the dominant genera (relative abundance >5%) were Mycoplasma (32.53%), Psychrobacter (11.87%), Shewanella (9.37%), and Pseudoalteromonas (8.38%). In the RS group, the dominant genera were Vibrio (14.44%), Pseudoalteromonas (13.59%), and Mycoplasma (13.46%). In the SS group, the dominant genera included Pseudoalteromonas (20.65%), Mycoplasma (17.76%), Vibrio (12.31%), and Burkholderia-Caballeronia-Paraburkholderia (7.64%). These results indicate that Pseudoalteromonas and Mycoplasma were the predominant genera across all three substrate groups, suggesting their core role in shaping the intestinal microbial community structure of B. areolata under different environmental conditions.

3.3. Analysis of differences in microbial community composition
LEfSe (Linear Discriminant Analysis Effect Size) was used to identify taxa with significant differences in relative abundance among the intestinal microbiota of B. areolata under different substrate conditions. The results are shown in Fig. 7. At the phylum level, Chloroflexi and Nitrospirota were significantly enriched in the SC group, while Desulfobacterota and Verrucomicrobiota were significantly enriched in the RS group. In contrast, Firmicutes and Actinobacteriota (Actinomycetes) were significantly enriched in the SS group. These findings suggest that different substrate environments exert distinct selective pressures on the gut microbial community structure of B. areolata, leading to phylum-level shifts in microbial composition.
At the order level, SBR1031, Ignavibacteriales, Opitutales, Methylococcales, Cardiobacteriales, Dongiales, and Nitrospirales were significantly enriched in the intestinal microbiota of B. areolata in the SC group. In the RS group, Desulfobulbales, Verrucomicrobiales, Rhodobacterales, and Bacillales showed significant enrichment. In the SS group, Enterobacterales, Staphylococcales, and Micrococcales were the orders significantly enriched in the intestinal microbiota. These differences further illustrate that substrate type has a strong influence on the taxonomic composition of gut microbial communities in B. areolata.
At the genus level, the following taxa were significantly enriched in the intestinal microbiota of B. areolata in the SC group: Blastococcus, WCHB1, Ferruginibacter, Flavisolibacter, Algoriphagus, Reichenbachiella, Adhaeribacter, NS5_marine_group, Moheibacter, Pedobacter, Ignavibacterium, Sulfurimonas, OLB15, Planococcus, Planococcaceae, Nitrospira, SWB02, Dongia, Hyphomicrobium, Limnobacter, Piscinibacter, Thiobacillus, Ellin6067, MND1, Nitrosospira, Janthinobacterium, Denitratisoma, Ignatzschineria, Cellvibrio, and Acidibacter. In the RS group, significantly enriched genera included Glutamicibacter, Actinomycetospora, Labilibacter, Fibrella, Desulforhopalus, Lactococcus, Blautia, Allorhizobium, Fulvimarina, and Sulfitobacter. In the SS group, Nesterenkonia, Salinicoccus, Staphylococcus, and Escherichia were the genera significantly enriched. These findings further highlight the impact of substrate composition on shaping the intestinal microbial community structure of B. areolata at the genus level.

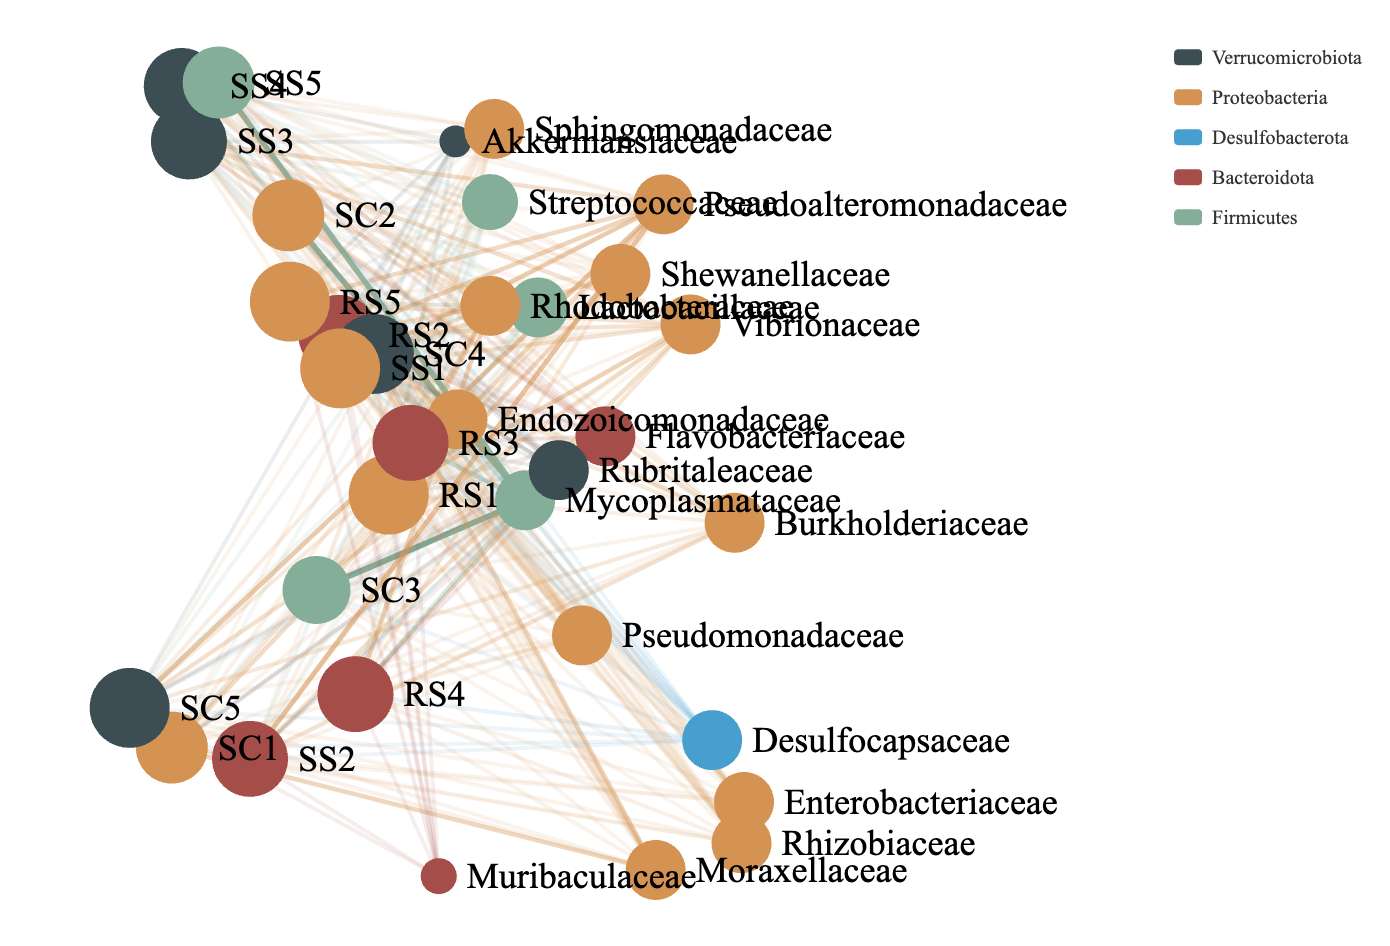
3.3. Co-occurrence network analysis of Microbial community
Co-occurrence network analysis was employed to visualize the distribution patterns between samples and microbial taxa. By correlating species abundance profiles across different samples, this method reveals co-occurrence relationships that help highlight the similarities and differences in microbial composition across environmental conditions. It is particularly effective for interpreting large and complex datasets. In this analysis, clusters were generated based on shared taxa among samples. The greater the number of shared taxa between samples, the closer their nodes appeared in the network. The resulting network graph includes two types of nodes: species nodes and sample nodes. An edge is formed between a species and a sample when the species is present in that sample. The co-occurrence network of the intestinal microbial communities of B. areolata under different substrate culture conditions is shown in Fig. 8. Node size is proportional to the number of connections (degree), and nodes are defined at the family level, with the top 20 most abundant taxa included. Nodes of the same color represent species belonging to the same taxonomic family. The microbial communities across different substrate environments exhibited complex co-occurrence patterns. Five core phyla were predominantly involved in the networks: Verrucomicrobiota, Proteobacteria, Desulfobacterota, Bacteroidota, and Firmicutes. The SC group network was mainly composed of closely connected families such as Mycoplasmataceae, Pseudoalteromonadaceae, Moraxellaceae, and Shewanellaceae. In the RS group, the dominant co-occurrence families included Rhodobacteraceae, Mycoplasmataceae, Vibrionaceae, and Pseudoalteromonadaceae. The SS group network was primarily composed of Mycoplasmataceae and Pseudoalteromonadaceae. Notably, Mycoplasmataceae and Pseudoalteromonadaceae emerged as the most consistently and strongly co-occurring families across all three substrate groups, indicating their potential as core members of the gut microbiota in B. areolata under varying environmental conditions.

4. Discussion
4.1. Diversity and abundance of intestinal microbial communities of B. areolata under different substrate culture environments
In this study, three groups of B. areolata cultured under different substrate conditions were selected for analysis. Intestinal contents were extracted, and the microbial diversity was assessed using high-throughput 16S rRNA gene sequencing. The rarefaction curves reached a plateau, indicating that the sequencing depth was sufficient and appropriate to comprehensively capture the diversity and structural composition of the intestinal microbiota in these samples.
The intestinal microbiota of snails is closely linked to host health and is influenced by various factors, among which environmental changes and host genetics play crucial roles in shaping the intestinal microbial community structure.32,33 In this study, we compared the diversity and abundance of gut microorganisms in B. areolata cultured under different substrate environments, revealing structural and functional differences in their gut microbiomes. A total of 9,975 OTUs were identified across all samples, with 4,874, 2,276, and 2,825 OTUs detected in the SC, RS, and SS groups, respectively. The numbers of unique OTUs in the SC, RS, and SS groups were 1,675, 484, and 341, respectively, while 568 OTUs were shared among all groups, indicating significant individual specificity in the gut microbial composition across different substrate culture conditions, alongside certain commonalities. Pang et al. (2025) reported a total of 14,128 OTUs in their study on the gut microbiota of three freshwater snail species from the Lijiang River.34 Compared to that, the lower OTU number in the present study may reflect species-specific differences in gut microbial abundance, as well as variations arising from distinct aquatic environments and feeding regimes. Our study was conducted in a closed recirculating aquaculture system, where microbial community abundance in the intestinal tract was relatively low, likely due to the more homogeneous culture environment and standardized feeding conditions compared to natural habitats. These findings align with Huang et al. (2023),35 who observed similar patterns in the intestinal flora of Cipangopaludina chinensis. Alpha diversity indices-including richness, Simpson, Chao1, and ACE-were highest in the SC group, suggesting that a ceramic particle substrate more effectively enhances gut microbial abundance in B. areolata compared to silica sand and river sand substrates. However, the SC group also exhibited reduced microbial diversity. Conversely, the RS group showed the lowest Simpson index, indicating the highest gut microbial diversity under river sand culture conditions, possibly due to the heterogeneous size distribution of river sand particles, which may provide more diverse attachment sites for microbial colonization. Zhang et al. (2015)36 similarly reported that environmental changes affect the abundance and diversity of intestinal microbial communities in shrimp, corroborating our findings.
4.2. Differences in the intestinal microbial community structure of B. areolata under different substrates culture environments
Gut microbes play a vital role in regulating the intestinal environment and maintaining the balance of the gut microbiota to promote host health.37 Changes in gut bacterial communities have been closely associated with disease severity, and dysbiosis of the gut microbiota may lead to impaired growth or increased susceptibility to infections in the host.38,39 Microbial diversity is critical for ecological stability; communities with low diversity tend to exhibit poor resilience and a higher risk of disease in the host. Sun et al. (2013) demonstrated that the diversity of the intestinal microbiota is positively correlated with its stability.40 Similarly, Huang et al. (2018) reported that higher alpha diversity in aquaculture water correlates with greater environmental stability and healthier aquatic animals, whereas lower diversity is linked to increased morbidity.41 In this study, B. areolata were cultured in a recirculating aquaculture system with a relatively stable external water quality. Despite observable differences in the intestinal microbial community structure among the three substrate culture groups, no significant loss of microbial diversity occurred during the experiment, suggesting that the culture environment contributed to maintaining the stability of the intestinal microbiota in B. areolata.
Although no significant differences were observed in the α-diversity of the intestinal microbiota among the SC, RS, and SS groups, the abundance of dominant bacterial taxa in B. areolata was significantly influenced by the different substrate culture environments. At the phylum level, the dominant taxa in the intestinal tract of B. areolata in the SC group were primarily Proteobacteria (58.81%) and Firmicutes (33.53%). In the RS group, the dominant phyla were Proteobacteria (67.86%), Firmicutes (18.46%), and Bacteroidota (5.11%). Meanwhile, in the SS group, Proteobacteria (65.17%) and Firmicutes (23.32%) predominated. Overall, Proteobacteria and Firmicutes were the common dominant phyla across all three groups, with Proteobacteria representing the most abundant phylum. These findings align with previous studies on the gut microbiota composition of aquatic species such as fish and shrimp.42,43 Notably, the presence of Bacteroidota as a dominant phylum was unique to the river sand-based RS group, suggesting that Bacteroidota may be better adapted to culture environments utilizing river sand as a substrate. This insight has practical implications: incorporating river sand as a culture substrate could help maintain or enhance the microbial abundance in the gut of B. areolata. Principal coordinate analysis (PCoA) revealed that substrate type explained 73.6% of the total variation in microbial community structure, indicating that differences in substrate culture environments significantly influence the intestinal microbiota of B. areolata. This effect is likely mediated by changes in the physicochemical properties of the culture environment induced by the different substrates. Gut microbial communities are generally regarded as plastic ecosystems, capable of structural and functional shifts in response to environmental changes.44 Environmental effects on gut microbiota have been extensively documented in various farmed aquatic animals, including Salmo salar,45 Oreochromis niloticus,46 Parabramis pekinensis,47 and Litopenaeus vannamei,48 with significant alterations observed in gut microbial diversity and community composition under differing environmental conditions. These precedents further support that varying substrate materials at the bottom of culture tanks can alter the culture environment, thereby driving changes in the structure and abundance of the gut microbial communities in B. areolata.
4.3. Differences in the co-occurrence network of B. areolata under different substrates culture environments
It has been demonstrated that increased bacterial interactions and shared ecological niches contribute to larger and more complex microbial networks, reflecting fundamental differences among microorganisms from distinct samples.49 For example, healthy soil microbial communities exhibit tightly connected and modular bacterial populations, which enhance network stability and dynamism, thereby maintaining ecosystem stability.50 The intestinal microbiota plays a critical role in the physiological health of B. areolata, with a stable gut flora potentially preventing bacterial infections in the host. In this study, the co-occurrence networks of the gut microbiota differed among the three B. areolata groups, indicating that substrate culture environments may influence the stability of their intestinal microbial communities. The SC group exhibited optimal node connectivity, higher transferability of connections, increased clustering probability, and tighter interactions among nodes, accompanied by the highest modularity. These findings suggest that the intestinal microbiota of B. areolata cultured with ceramic grains as the substrate (SC group) demonstrated greater stability compared to those in the RS and SS groups.
Microorganisms play a vital role in aquaculture by regulating the aquatic environment through the decomposition of organic matter, maintaining water quality stability, preventing disease outbreaks, promoting nutrient cycling, and overall improving water conditions, all of which are critical for the health of aquaculture systems.51 The structure and function of the intestinal microbiota in aquatic animals are closely linked to their nutritional metabolism, intestinal development, and immune system function, serving as key factors in maintaining the internal intestinal homeostasis.52 Food digestion in aquatic animals results from the synergistic action of enzymes produced by both the host digestive system and the gut microbiota.53 However, the composition and characteristics of gut microbial communities vary across different culture environments. This study investigated the intestinal microbiota of B. areolata under varying substrate culture conditions, providing insights into the digestive physiology and nutritional needs of this species. These findings are significant for optimizing healthy cultivation practices, feed formulation, and the development of feed additives. Moreover, intestinal diseases are often closely associated with alterations in gut bacterial populations. Understanding the gut microbiota can elucidate disease pathogenesis and progression. Beneficial bacteria and other advantageous microorganisms can be formulated into probiotic consortia and administered to aquatic animals to enhance their disease resistance and immunity, thereby promoting growth and reproductive performance in cultured species.
Acknowledgments
The study was supported by the Hainan Province Science and Technology Special Fund (ZDYF2022XDNY351), the earmarked fund for CARS (CARS-49), the Central Public-interest Scientific Institution Basal Research Fund, the South China Sea Fisheries Research Institute, CAFS (2023TD58), and the Financial Fund of the Ministry of Agriculture and Rural Affairs of China (NHYYSWZZZYKZX2020).
Authors’ Contribution
Conceptualization: Wei Fang (Equal), Cheng Zhou (Equal), Mingqiang Chen (Equal), Wang Zhao (Equal), Chuanxin Qin (Equal), Gang Yu (Equal), Zhenhua Ma (Lead). Writing – original draft: Wei Fang (Lead). Formal Analysis: Wei Fang (Equal), Cheng Zhou (Equal), Mingqiang Chen (Equal), Wang Zhao (Equal), Chuanxin Qin (Equal), Gang Yu (Equal), Zhenhua Ma (Equal). Investigation: Wei Fang (Equal), Cheng Zhou (Equal), Wang Zhao (Equal). Data curation: Mingqiang Chen (Equal), Wang Zhao (Equal), Chuanxin Qin (Equal), Gang Yu (Equal), Zhenhua Ma (Equal). Methodology: Mingqiang Chen (Equal). Writing – review & editing: Gang Yu (Lead). Supervision: Zhenhua Ma (Lead).
Competing Interest – COPE
No competing interests were disclosed.
Ethical Conduct Approval – IACUC
Every effort was made to minimize animal suffering in this study, and no ethical approval was required for the experimental animals.
Informed Consent Statement
All authors and institutions have confirmed this manuscript for publication.
Data Availability Statement
All are available upon reasonable request.