


Introduction
Color variation in clownfish is a visually striking trait and plays critical roles in ecological adaptation, mate selection, and commercial value in the ornamental fish trade. Coloration influences predator avoidance, social signaling, and environmental fitness in coral reef ecosystems. In aquaculture, vibrant and stable coloration directly impacts breeding success and market preference.1–3 Among the most widely cultured clownfish, Amphiprion percula and A. ocellaris are morphologically similar but exhibit distinctly different coloration patterns, as A. ocellaris is characterized by bright reddish-yellow tones, while A. percula shows darker greenish-blue hues. These phenotypic differences are visually apparent and commercially relevant, yet the underlying molecular mechanisms responsible for this divergence remain poorly understood. Their close evolutionary relationship and contrasting pigmentation provide a powerful system to explore how gene regulation contributes to color variation.
While previous studies have investigated general pigmentation mechanisms of fish, including the roles of melanocytes, carotenoid-containing cells, and pigment-regulating genes such as MC1R and tyrosinase,4–7 few have explicitly focused on clownfish or compared closely related species with divergent pigmentation. Melanin contributes to dark pigmentation, UV protection, and camouflage,5 while carotenoids maintain red-to-yellow hues and enhance oxidative defense and visual signaling.6 These pigments are synthesized and distributed through complex gene regulatory networks, influenced by genetic and environmental factors.7–10 Recent advances in transcriptomics have enabled researchers to uncover genes and pathways involved in pigmentation, such as MC1R, ASIP, and members of the cytochrome P450 family.11,12 However, the transcriptional basis for interspecific pigmentation differences in clownfish has not yet been systematically investigated. This study aims to determine whether the phenotypic color divergence between A. percula and A. ocellaris is driven by differences in gene expression related to pigment metabolism, particularly in melanin and carotenoid pathways. We hypothesize that interspecific variation in skin pigmentation is associated with distinct transcriptional profiles, reflecting differences in both pigment content and pigment cell distribution.
By integrating phenotypic measurements (HSB colorimetry and pigment quantification), histological analysis, and transcriptomic profiling, we provide one of the first comparative molecular assessments of skin pigmentation in these two clownfish species. Our results reveal differential expressions of key pigmentation genes and pathways, offering insight into clownfish’s genetic regulation of coloration.13 This research provides a theoretical foundation for selective breeding and color trait improvement in ornamental aquaculture and contributes to understanding the genetic basis of ecologically important traits in marine fish.
Materials and Methods
Sample Collection and HSB Parameter Measurement
Skin samples from the red area on the sides of A. percula (black-edge false clownfish) and A. ocellaris (false clownfish) were selected. The color parameters (L*, a*, b*, and ΔE) were measured using a colorimeter (Figure 1) as phenotypic data for body color traits. Each species included samples from 10 individual fish (N = 10), collected from 3 independent tanks (n = 3 tanks per species). Subsequently, skin samples were taken from the area between the head and tail fin of both species. After washing with PBS buffer, each sample was divided into two portions, one for pigment quantification and the other for histological analysis. Part of the samples were quickly frozen in liquid nitrogen and stored at -80°C for the extraction of melanin and carotenoids. Pigment analysis was performed on 6 biological replicates per species (N = 6), with two fish sampled from each tank. The remaining samples were fixed in 4% PFA at 4°C for 24 hours. After fixation, the samples were transferred to an ethanol gradient (30%, 50%, 70%, 80%, 90%), with each gradient treated for 2 hours, and finally stored in 100% ethanol for permanent preservation. Histological analysis was performed on skin samples from 6 individual fish per species (N = 6), corresponding to those used for pigment analysis.
All animal treatment met the standards of the Institutional Animal Care and Use Committee guidelines.

Preparation and Observation of Paraffin Sections of Skin Tissue
The skin tissue samples were first soaked in a 1:1 mixture of anhydrous ethanol and xylene for 20 minutes, followed by two washes in pure xylene until the tissue became transparent. The tissue was then immersed in a 1:1 solution of xylene and paraffin for 1 hour, transferred to pure liquid paraffin for 2 hours, and finally placed in a cold storage unit to cool before being stored at -20°C. After retrieving the embedded tissue, the paraffin surface was trimmed with a scalpel to ensure the tissue area was higher than the surrounding paraffin. The tissue was then mounted on a microtome, and the section thickness was adjusted to 5 μm. The tissue was spread in a 40°C water bath, dried in a 37°C drying oven, and then subjected to dewaxing, rehydration, and staining. Dewaxing was performed by soaking the sections in xylene twice, each for 5 minutes, followed by a 5-minute treatment in a mixture of xylene and anhydrous ethanol (1:1), and two washes in anhydrous ethanol, each for 5 minutes. The sections were rehydrated through gradient ethanol (95%, 80%, 70%, 50%, 30%) for 2 minutes each, then transferred to ultrapure water. Hematoxylin and eosin (H&E) staining was performed according to the kit instructions. Dehydration was performed in reverse, followed by embedding in xylene. The slides were then sealed with neutral balsam and observed under an Olympus BX43 microscope, and images were captured.
Extraction and Measurement of Melanin and Carotenoids in Skin Tissue
Several skin tissue samples from A. percula and A. ocellaris (Figure 1) were collected and added to 9 volumes of PBS buffer. The skin tissue was chopped with scissors and thoroughly ground on ice using a tissue homogenizer. The homogenate was then centrifuged at 13,000 rpm for 10 minutes at 4°C, and the supernatant was transferred to a new 1.5 mL EP tube. The melanin and carotenoid contents in the supernatant were measured using fish melanin and carotenoid enzyme-linked immunosorbent assay (ELISA) kits (Enzyme-linked Biology).
Quality control and Read mapping
The raw paired-end reads were trimmed, and quality was controlled by fastp with default parameters. Then, clean reads were separately aligned to the reference genome with orientation mode using HISAT2 software. StringTie assembled the mapped reads of each sample using a reference-based approach.
Statistical analysis
All statistical analyses were conducted using Microsoft Excel 2021. For comparisons of pigment content (melanin and carotenoids) between A. ocellaris and A. percula (Figure 2), an independent two-tailed t-test was performed. Results are expressed as mean ± standard deviation (SD). Statistical significance was set at p < 0.05.
Results
HSB Analysis of the Two Clownfish Species
The HSB measurement results for the two clownfish species are shown in Table 1. The L* value for A. ocellaris is -57.11 with a standard deviation of 2.59, while the L* value for A. percula is -59.87 with a standard deviation of 4.30. The a* value for A. ocellaris is 29.91 with a standard deviation of 4.77, while the a* value for A. percula is 14.08 with a standard deviation of 3.42. The a* value represents the red-green color distribution; the higher a* value in A. ocellaris indicates that its skin is more red, whereas A. percula has more greenish skin. The b* value for A. ocellaris is 20.70 with a standard deviation of 4.68, while the b* value for A. percula is 13.32 with a standard deviation of 5.03. The b* value represents the yellow-blue color distribution; A. ocellaris has a higher b* value, indicating a more yellowish tone, while A. percula has a more bluish hue. The ΔE value for A. ocellaris is 67.85 with a standard deviation of 2.77, while the ΔE value for A. percula is 63.26 with a standard deviation of 3.52. ΔE is a quantitative indicator of color difference, and a higher ΔE value for A. ocellaris indicates a greater color difference in the red skin region. The lower L* value in A. percula suggests darker skin brightness. These results demonstrate that the skin color of A. ocellaris is brighter and more reddish, with more vibrant colors, while A. percula has a more greenish-blue tone and generally darker skin. The difference in ΔE values further confirms the significant color difference between the two species.
Pigment Content Analysis of Two Clownfish Species
The pigment content analysis results of the skin of two clownfish species are shown in Figure 2. In terms of melanin content, A. ocellaris has significantly lower melanin content compared to A. percula. The melanin content in A. ocellaris is approximately 62 mg/g, while that in A. percula is close to 90 mg/g, showing a significant difference. This suggests that A. percula has a higher melanin content, which may be related to its darker skin color, reflecting a greater accumulation of melanin in its body. Regarding carotenoid content, A. ocellaris has a significantly higher content than A. percula. The carotenoid content in A. ocellaris is nearly 30 μg/g, while that in A. percula is less than 10 μg/g. This difference suggests that A. ocellaris’s skin may be richer in carotenoids, which could be linked to its redder and brighter skin color. A. percula has significantly higher melanin content than A. ocellaris, whereas A. ocellaris is richer in carotenoids. This difference may be related to the color differences and physiological characteristics of the two species.

Pigment Distribution Analysis in the Skin of Two Clownfish Species
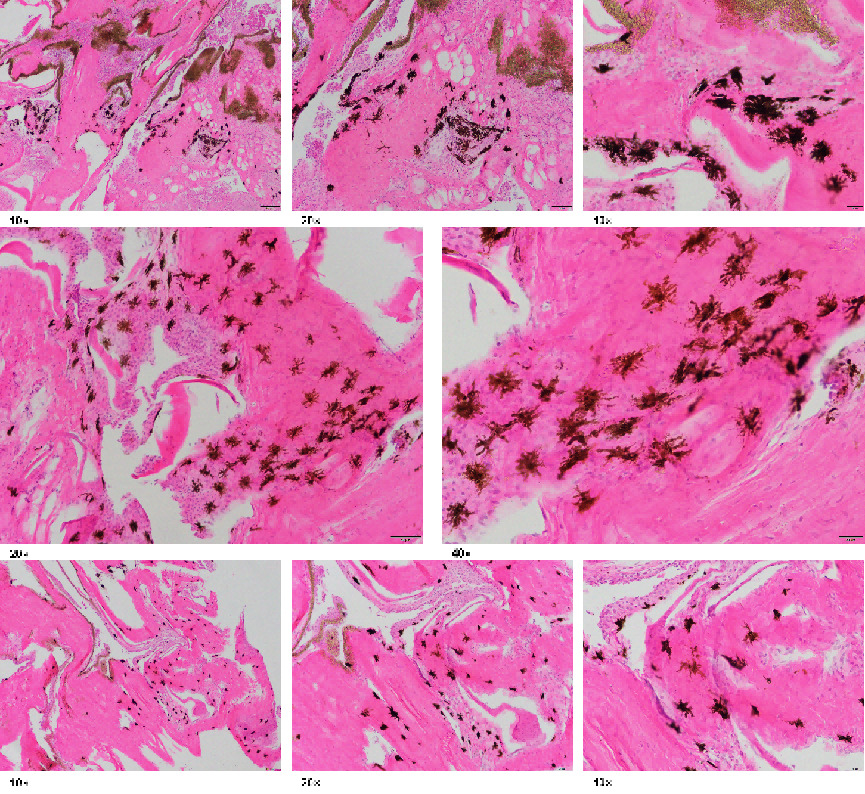
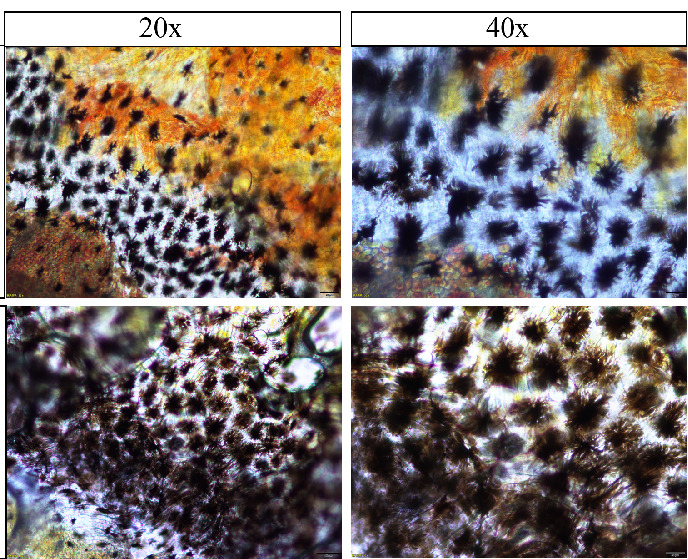
The results of pigment distribution analysis in the skin of the two clownfish species are shown in Figures 3-6, where Figures 3-5 display direct photographs of the skin samples after being cut, and Figure 6 shows histological sections observed under the microscope. Direct microscopic examination of the skin tissue revealed that under 10x magnification, the skin of A. ocellaris exhibited more dispersed melanocytes, with melanin concentrated mainly in the superficial layers of the skin and minimal pigment deposition. Under 40x magnification, the distribution of melanin granules was sparse, and the melanocytes appeared uniform in shape. In contrast, the skin of A. percula showed a denser arrangement of melanocytes with a higher amount of melanin deposition under 10x magnification. Under 40x magnification, the melanin granules were densely packed and irregularly shaped, giving the skin a darker overall appearance, which aligns with its darker skin tone. Histological examination revealed that under 20x magnification, the skin of A. ocellaris displayed a rich array of colors with more scattered melanin granules and relatively shallow skin layers. At 40x magnification, fewer dark granules were observed in the epidermis, consisting mainly of a small amount of melanin and carotenoid deposition, giving the skin a lighter tone with some brightness. On the other hand, A. percula exhibited denser melanin granules under 20x magnification, with significant melanin deposition in the epidermis, resulting in a darker color. At 40x magnification, the melanin granules were evenly distributed and closely packed, giving the skin a deeper tone, reflecting a more substantial accumulation of melanin. Overall, the combined microscopic and histological analysis indicates that the melanocytes in the black-edge region of A. ocellaris are more loosely arranged in a punctate pattern. In contrast, in A. percula, the melanocytes in the black-edge region are tightly arranged in a band-like pattern.


Discussion
This study analyzes the color differences, pigment content, and distribution in the skin of A. percula and A. ocellaris, revealing significant differences in their skin color traits. These differences are likely related to their adaptive needs, ecological roles, and genetic backgrounds in different habitats.
Analysis of Phenotypic Color Parameter Differences
HSB color difference analysis showed significant differences in skin color between the two species. The L-value of A. ocellaris was -57.11, indicating higher skin brightness with red and yellow tones, possibly related to the need for visual attraction or warning responses in its environment. In contrast, the L-value of A. percula was -59.87, with skin tones leaning towards green and blue, generally darker, which helps it blend better in specific environments. These color differences are closely related to natural selection pressures, as darker skin helps conceal the fish in specific environments to avoid predator attacks. Pigment content analysis further confirmed this. A. percula had significantly higher melanin content (90 mg/g) than A. ocellaris (60 mg/g), consistent with its darker skin tone. The higher melanin content may enhance UV resistance or help in camouflage in complex environments. On the other hand, A. ocellaris had higher carotenoid content (approximately 30 μg/g) than A. percula (less than 10 μg/g), which is associated with its bright red and yellow skin colors. Carotenoids have antioxidant properties, which might be beneficial in environments with strong sunlight or those requiring strong visual signals, helping with social interactions or mate attraction.14,15 Microscopic observations showed that the melanocytes in A. ocellaris were sparse, and the particles were dispersed, reflecting its higher brightness and lower melanin content. In contrast, the melanocytes in A. percula were denser, with irregular particle shapes corresponding to its darker skin. These differences may be related to their ecological adaptations. Dense melanocytes help with camouflage, adapting to intense light or complex environments.16,17 Similar patterns of melanocyte distribution have been observed in other fish and amphibians, suggesting that they adapt to camouflage or reduce UV damage through this mechanism.18,19 These differences indicate that the color traits of A. percula and A. ocellaris are closely related to ecological factors such as habitat light conditions, predation pressure, and reproductive needs.20,21
Gene Expression Differences and Correlation with Color Phenotype Regulation
Analysis of gene expression differences between A. ocellaris and A. percula revealed significant variations, with 1925 differentially expressed genes (DEGs), of which 641 were upregulated and 1284 downregulated (graph not shown). The DEGs primarily involved biological processes such as cellular processes, single-cell processes, and binding. KEGG analysis revealed six metabolic pathways related to metabolism, genetic information processing, and environmental information processing, with multiple pathways related to color regulation, such as drug metabolism-cytochrome P450 and pigment biosynthesis. These genes and pathways may play key roles in pigment cell formation and functional regulation, especially in A. percula, where increased activity of specific genes likely promotes melanocyte proliferation or enhanced activity, resulting in its darker skin tone. HSB color difference analysis showed that A. ocellaris’s skin was redder and brighter, whereas A. percula had a darker overall skin tone leaning towards green and blue. This difference matched the pigment content measurements. A. ocellaris had significantly lower melanin content and higher carotenoid content. Transcriptomic analysis revealed significant expression differences in genes related to pigment synthesis, such as MC1R (melanocortin 1 receptor) and CYPs (cytochrome P450), suggesting that these two species have distinct regulatory mechanisms in their melanin and carotenoid synthesis pathways.22 These color differences are likely closely related to ecological adaptations. The darker skin tone of A. percula might help it camouflage in complex environments to avoid predator attacks, while the brighter skin of A. ocellaris might aid in mate attraction or increase social interaction during the breeding season.23,24 While these transcriptomic data suggest associations between gene expression and color phenotypes, it is important to note that the current findings are correlational. Functional validation experiments—such as CRISPR-Cas9 gene knockout, gene overexpression, or in vivo pigment cell assays—are necessary to determine the direct roles of candidate genes like MC1R, tyrosinase, and CYPs in driving phenotypic variation. Future research should explore these functional approaches to confirm the causative effects of the identified genes on skin pigmentation.
Relationship Between Pigment Synthesis and Ecological Adaptation
Transcriptomic analysis revealed gene expression differences in pigment cell proliferation and differentiation processes between A. percula and A. ocellaris, directly influencing the formation of their color traits. Differences in gene expression in DNA replication and cell cycle pathways indicate that pigment cell proliferation and differentiation play a critical role in color formation.25 The significant enrichment of the drug metabolism-cytochrome P450 pathway suggests that this pathway may be involved in the metabolism of pigment precursors, regulating the synthesis and breakdown of pigments.26,27 A. percula had significantly higher melanin content than A. ocellaris, suggesting that the proliferation and functional regulation of melanocytes are key factors in its darker skin tone. Key genes in melanin synthesis, such as tyrosinase, were highly expressed in A. percula, leading to its higher melanin content28 A. ocellaris, on the other hand, exhibited higher gene expression in carotenoid synthesis, especially CYP family genes, which may promote carotenoid synthesis, affecting its red and yellow skin tones.29 These gene expression differences indicate that color differences are determined by pigment content and gene regulation in the pigment synthesis process. Histological analysis showed that the melanocytes in A. percula were tightly packed and irregularly shaped, corresponding to its darker skin tone,30 while A. ocellaris’s melanocytes were sparse with fewer particles, reflecting its brighter skin tone.31 The melanocytes in A. percula were arranged in bands, which might help with camouflage in high-light environments.32 These histological differences further confirm the influence of gene expression on pigment distribution and skin color formation. The color differences are of significant ecological and evolutionary importance. The dark tone of A. percula helps it camouflage in complex environments, reducing predation pressure,33 while the bright tone of A. ocellaris may aid in sexual selection, attracting mates or displaying territories.34 The evolution of color demonstrates how fish adapt their strategies to different environmental conditions. On the molecular level, the roles of genes such as MC1R, tyrosinase, and CYPs in pigment synthesis explain the color differences, revealing how fish adapt to their ecological environments through gene expression.35,36
Acknowledgments
This project was supported by grants from the Hainan Provincial Natural Science Foundation of China (320QN360) and the Central Public-Interest Scientific Institution Basal Research Fund, CAFS (2025XT03).
Authors’ Contribution
Conceptualization: Jing Hu (Equal), Zhenhua Ma (Equal). Data curation: Jing Hu (Equal), Mengya Wang (Equal). Investigation: Jing Hu. Methodology: Jing Hu (Equal), Zhenhua Ma (Equal). Project administration: Jing Hu. Resources: Jing Hu. Software: Mengya Wang (Equal), Bo Wang (Equal). Supervision: Zhenhua Ma (Lead). Validation: Jing Hu (Equal), Mengya Wang (Equal), Bo Wang (Equal). Writing – original draft: Jing Hu (Equal), Mengya Wang (Equal). Writing – review & editing: Jing Hu (Equal), Zhenhua Ma (Equal).
Competing of Interest – COPE
The authors declare that they have no known competing financial interests or personal relationships that could have appeared to influence the work reported in this paper.
Ethical Conduct Approval – IACUC
All procedures were conducted in accordance with the “Guiding Principles in the Care and Use of Animals” (China).
Informed Consent Statement
All authors and institutions have confirmed this manuscript for publication.
Data Availability Statement
All are available upon reasonable request.