


Introduction
Thamnaconus septentrionalis, commonly named as greenfin horse-faced filefish, was a fish species with significant economic value along the coast of China.1 However, due to environmental pollution and overfishing, its wild population has declined rapidly, failing to meet market demands.2 Aquaculture systems provide a viable solution to reduce fishing pressure on wild populations while maintaining stable production of T. septentrionalis.
With the development of intensive aquaculture, high-density stress has become a key factor causing growth inhibition and immune suppression in aquatic animals. It has been demostrated that high stocking density increases cortisol and whole blood glucose concentrations in Oreochromis niloticus, where elevated plasma cortisol and blood glucose levels can serve as biomarkers for acute stress response in Oreochromis niloticus under aquaculture conditions, ultimately affecting growth performance.3 In addition, it has been proved that high stocking density causes chronic crowding stress, negatively impacting growth performance, blood biochemical parameters, and hepatic antioxidant capacity in Carassius gibelio.4 Density stress activates the hypothalamic-pituitary-interrenal (HPI) axis, leading to elevated cortisol levels that subsequently induce metabolic reprogramming.4 Research by Yu et al. showed that under high-density culture conditions, the neuroendocrine system, energy metabolism system, antioxidant system, and immune system of Larimichthys crocea are all involved in stress regulation. Physiological indicators such as cortisol, blood glucose, SOD, and CAT demonstrated excellent biomarker potential for monitoring density stress in this species.5
Aquaculture of T. septentrionalis has developed rapidly since the breakthroughs on artificial propagation.6 Stocking density is a critical limiting factor in aquaculture systems. Excessive density intensifies competition among aquatic animals for resources such as food, oxygen, space, and other resources, thereby affecting gene expression and adaptive capacity.7,8 Current research on fish density stress has primarily focused on Salmonidae and Perciformes,9,10 while the stress response mechanisms in Tetraodontiformes remain systematically uncharacterized. As an emerging aquaculture species, T. septentrionalis may exhibit heightened sensitivity to density stress due to its unique respiratory physiology (reliant on buccal cavity expansion). Under high-density farming conditions, Hippoglossus hippoglossus exhibit intensified competition for benthic space, altered spatial distribution, increased swimming activity, and significantly more frequent surfacing behavior.9 Oplegnathus fasciatus grow rapidly under low density but show slowed growth and dramatically increased mortality under prolonged high-density stress.10 Procambarus clarkii digestive enzyme activity remains largely unaffected by density stress, but antioxidant system function was impaired.11 Currently, the molecular response mechanisms of T. septentrionalis gill tissue to density stress remain unclear.
Transcriptomics provides a powerful tool for analyzing gene expression levels and identifying DEGs, offering insights into molecular mechanisms.12 Transcriptome sequencing is widely used to analyze gene expression patterns, discover novel genes, identify differentially expressed genes (DEGs), and annotate gene functions.13,14 This technology has been extensively used in aquatic animal research. Recent applications of single-cell transcriptomics have revealed heterogeneous responses in zebrafish gill cells under hypoxic conditions.15 However, spatiotemporal-resolved transcriptional dynamics during density stress remain unexplored. Hypoxia stress significantly increased expression of 60 ribosomal protein genes in Danio rerio gills, with 15 highly enriched GO pathways related to ribosomal protein assembly and synthesis.15 Exopalaemon carinicauda gill tissue responds to hypoxia by enhancing early protein synthesis and metabolic capacity, with post-hypoxic recovery involving gradual elevation of substance synthesis and energy metabolism.16 Transcriptomic studies on Chionodraco hamatus revealed downregulation of gill-expressed genes (eg, gata1a, tfr1a, slc4a1a, myb, slc25a37, metap2a) associated with immune function and erythropoiesis.17
This study aims to explore the molecular response mechanisms of T. septentrionalis gill tissue to density stress and provide fundamental data for determining optimal stocking densities in intensive aquaculture.
Materials and Methods
Experimental Materials
The farming experiments were conducted at the Ganyu Research Center of East China Sea Fisheries Research Institute (CAFS). Healthy, disease-free, and lively T. septentrionalis individuals with an average weight of 9.5±0.5 g were selected. Fish were acclimated for 7 days in large tanks at 50 individuals/m³ before being transferred to culture tanks at two stocking densities: low density (100 fish/m³) and high density (500 fish/m³), with three replicates per group. In each treatment, the experiment was conducted in culture tanks, each with a bottom area of 0.9 m2 and a height of 1.2 m. After water injection, the effective water volume was 1 m3. The experiment lasted 50 days, from November 7 to December 27, 2020. A continuous micro-flow water system with a 120% daily water exchange rate was employed. The water conditions were maintained at dissolved oxygen 6.7±0.4 mg/L, pH 8.20±0.9, and temperature 17±1°C. Fish were fed commercial pellets three times daily, amounting to approximately 3% of their body weight. The crude protein content (%) of the commercial diet used was 37%.
Tissue Sample Collection
Gill tissues were collected from fish in the large acclimation tank as the control group (CG) at the start of the experiment. Subsequently, gill samples were collected from both density groups on day 25 (D1G: low density; D2G: high density) and day 50 (d1G: low density; d2G: high density). Three fish per density group per time point served as biological replicates, and each fish originated from a separate tank. Fish were anesthetized with eugenol before sampling. Gill tissues were excised, rinsed, and cut into fragments smaller than 5 mm in all dimensions. Tissues were immersed in 5-10 volumes of RNAwait solution (Tiangen Biotech (Beijing) Co., Ltd), stored overnight at 4°C, and then transferred to -20°C for storage.
RNA Extraction, Library Construction, and Sequencing
Total RNA was isolated from frozen gill tissues using Trizol reagent, and RNA integrity was assessed using an Agilent 2100 Bioanalyzer (RIN ≥ 7.0). PolyA-tailed eukaryotic mRNA was enriched from 1 μg of total RNA using oligo(dT) magnetic beads (NEB), with two rounds of purification to remove rRNA contaminants. The enriched mRNA was fragmented into ~200-300 bp pieces using divalent cations under elevated temperature in NEBNext First Strand Synthesis Reaction Buffer. First-strand cDNA was synthesized using M-MuLV Reverse Transcriptase (New England Biolabs, NEB) with random hexamer primers. The synthesis was carried out at 25°C for 10 minutes (primer annealing), followed by 42°C for 60 minutes (extension), and terminated by heating at 70°C for 15 minutes to inactivate the reverse transcriptase. Second-strand cDNA synthesis using DNA Polymerase I and RNase H to simultaneously degrade the RNA template and synthesize the complementary DNA strand. The reaction was incubated at 16°C for 120 minutes, then terminated by adding 10 mM EDTA. The resulting double-stranded cDNA was subjected to end repair (blunting of overhangs and 5’ phosphorylation), 3’ adenylation (addition of a single A-base to prevent self-ligation), and ligation of NEBNext adaptors with hairpin loop structures for strand specificity. Adaptor-ligated fragments of ~250-300 bp (insert size ~200 bp) were size-selected using AMPure XP beads. The libraries were then amplified by 12 cycles of PCR using Phusion High-Fidelity DNA Polymerase, and final library purification was performed with AMPure XP beads to remove primer dimers and short fragments. The PCR conditions were as follows: initial denaturation at 98°C for 30 seconds; followed by 12 cycles of denaturation at 98°C for 10 seconds, annealing at 60°C for 30 seconds, and extension at 72°C for 30 seconds; with a final extension at 72°C for 5 minutes. Library quality was validated using Agilent 2100 Bioanalyzer and qPCR for concentration determination. Qualified libraries were sequenced on the Illumina HiSeq platform (2 × 150 bp paired-end reads).
Sequencing Data Assembly and Functional Annotation
Raw sequencing data were first subjected to comprehensive quality control using fastp v0.23.2.18 The quality control pipeline included: (i) removal of adapter sequences (both 5’ and 3’ adapters) using automatic adapter detection; (ii) trimming of read ends with Phred quality scores < 20 using a sliding window approach (window size = 4, minimum quality = 20); (iii) removal of reads containing >10% ambiguous bases (N); (iv) filtering out poly-A/T rich reads (reads with >80% A/T bases); (v) exclusion of short reads (<36 bp) generated after trimming; and (vi) calculation of key quality metrics including Q20/Q30 percentages, GC content, and sequence duplication levels. All clean reads passing these filters were retained for subsequent analysis, with the overall data quality validated using FastQC v0.11.9.
For genome alignment, the clean reads were mapped to the reference genome (GenBank accession: GCA_009823395.1)19 using HISAT2 v2.2.1, which employs a hierarchical indexing strategy based on Bowtie2. The alignment parameters were set as follows: max-intronlen 500000 (maximum intron length), min-intronlen 20 (minimum intron length), and k 5 (reporting up to 5 multiple alignments). Uniquely mapped reads with mapping quality ≥20 were retained for downstream analysis. The overall alignment rate, uniquely mapped rate, and distribution of reads across genomic features (exon, intron, intergenic regions) were calculated using SAMtools v1.15.1 and featureCounts v2.0.3 to evaluate alignment quality.
Gene Expression and Differential Analysis
Gene expression levels were quantified as fragments per kilobase of transcript per million mapped fragments (FPKM)20 using StringTie v2.2.1, which assembles transcripts and estimates their abundances based on the aligned reads. Differential expression analysis was performed using DESeq2 v1.34.0 (R package)21 with the following parameters: size factor normalization to account for library size differences, a negative binomial generalized linear model to model read counts, and Wald tests for significance testing. Differentially expressed genes (DEGs) were identified with strict thresholds of |log2(fold change)| > 1 (equivalent to |Fold change| > 2) and adjusted P-value (Benjamini-Hochberg method) < 0.05.22
For functional enrichment analyses: GO (Gene Ontology) enrichment was conducted using the clusterProfiler v4.2.2 R package, which employs a hypergeometric test to identify significantly enriched GO terms (biological process, cellular component, and molecular function) among DEGs compared to the background gene set. KEGG (Kyoto Encyclopedia of Genes and Genomes) pathway enrichment analysis was also performed using clusterProfiler v4.2.2, leveraging the KEGG orthology annotations to determine over-represented biological pathways. Both GO and KEGG enrichments used a false discovery rate (FDR) < 0.05 as the significance threshold after Benjamini-Hochberg correction.
Visualization of the results was performed using the following R packages: ggplot2 v3.3.6 for generating volcano plots (displaying log2 fold change vs. adjusted P-value) and bar plots (showing top enriched terms); pheatmap v1.0.12 for hierarchical clustering heatmaps of DEG expression profiles; and pathview v1.34.0 for visualizing DEGs mapped onto specific KEGG pathways. All visualization parameters were set to default unless specified, with significant terms/pathways highlighted using color gradients based on enrichment significance.
Results
The growth and mortality of T. septentrionalis
During the experiment, the information on growth and mortality of T. septentrionalis is as follows: in terms of growth, the initial body weight was 9.5±0.5 g for both groups; the final body weight was 17.97±0.45 g in the low-density group (100 fish/m³) and 17.26±0.28 g in the high-density group (500 fish/m³). Regarding mortality, the survival rate was 99.3% in the low-density group (100 fish/m³) and 95.6% in the high-density group (500 fish/m³).
Gill Transcriptome Sequencing Data
Total RNA integrity and purity were rigorously evaluated to ensure suitability for transcriptome profiling. The quality metrics, such as OD260/OD280 ratios, RIN values, and concentrations, confirmed that all RNA samples met stringent criteria for Illumina-based transcriptome sequencing, ensuring the robustness of subsequent data generation and differential expression analyses. Illumina HiSeq sequencing generated 101.2 Gb of raw data and 100.0 Gb of clean data after filtering. The GC content ranged from 48.51% to 51.00% across groups, with all samples exhibiting Q20 values ≥ 97.20% and Q30 values ≥ 92.38% (Table 1).
Overall Gene Expression Distribution
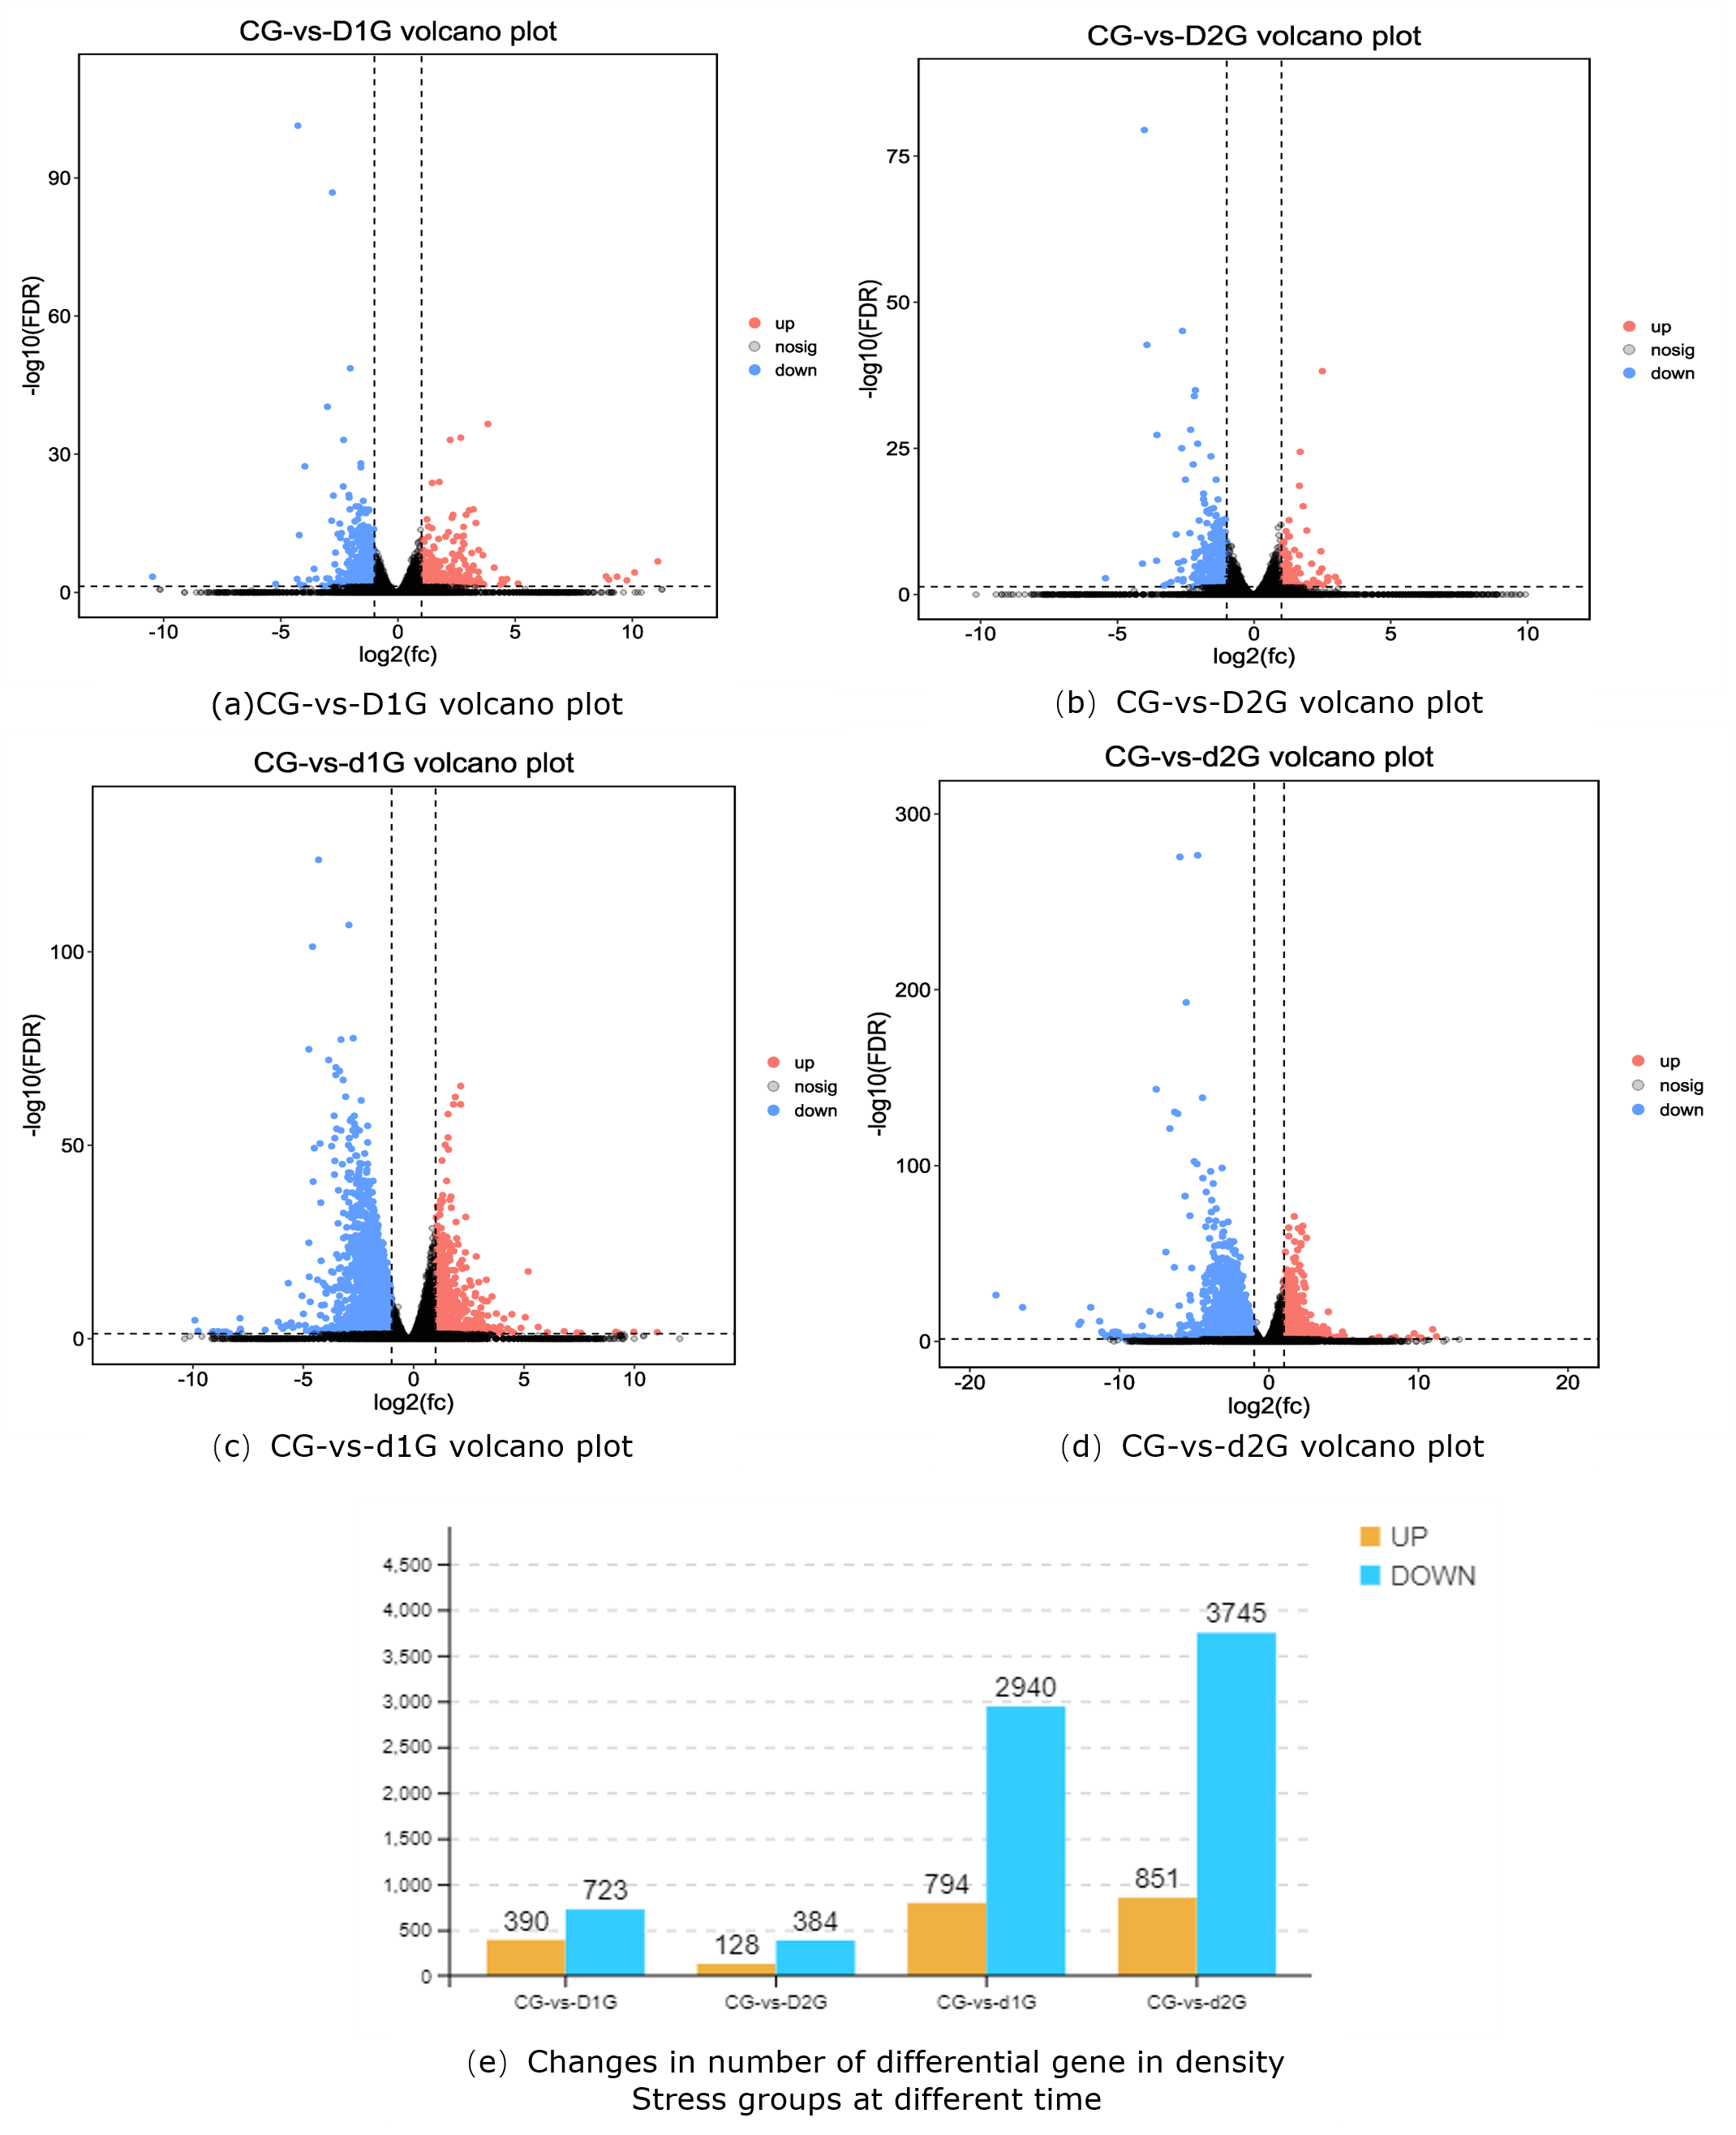
Comparative analysis between control and density-stress groups revealed significant differences in gene expression (Fig. 1a-d). DEG counts were as follows: CG-vs-D1G (390 up-regulated, 723 down-regulated), CG-vs-D2G (128 up-regulated, 384 down-regulated), CG-vs-d1G (794 up-regulated, 2940 down-regulated), and CG-vs-d2G (851 up-regulated, 3745 down-regulated) (Fig. 1e).

GO Functional Enrichment Analysis
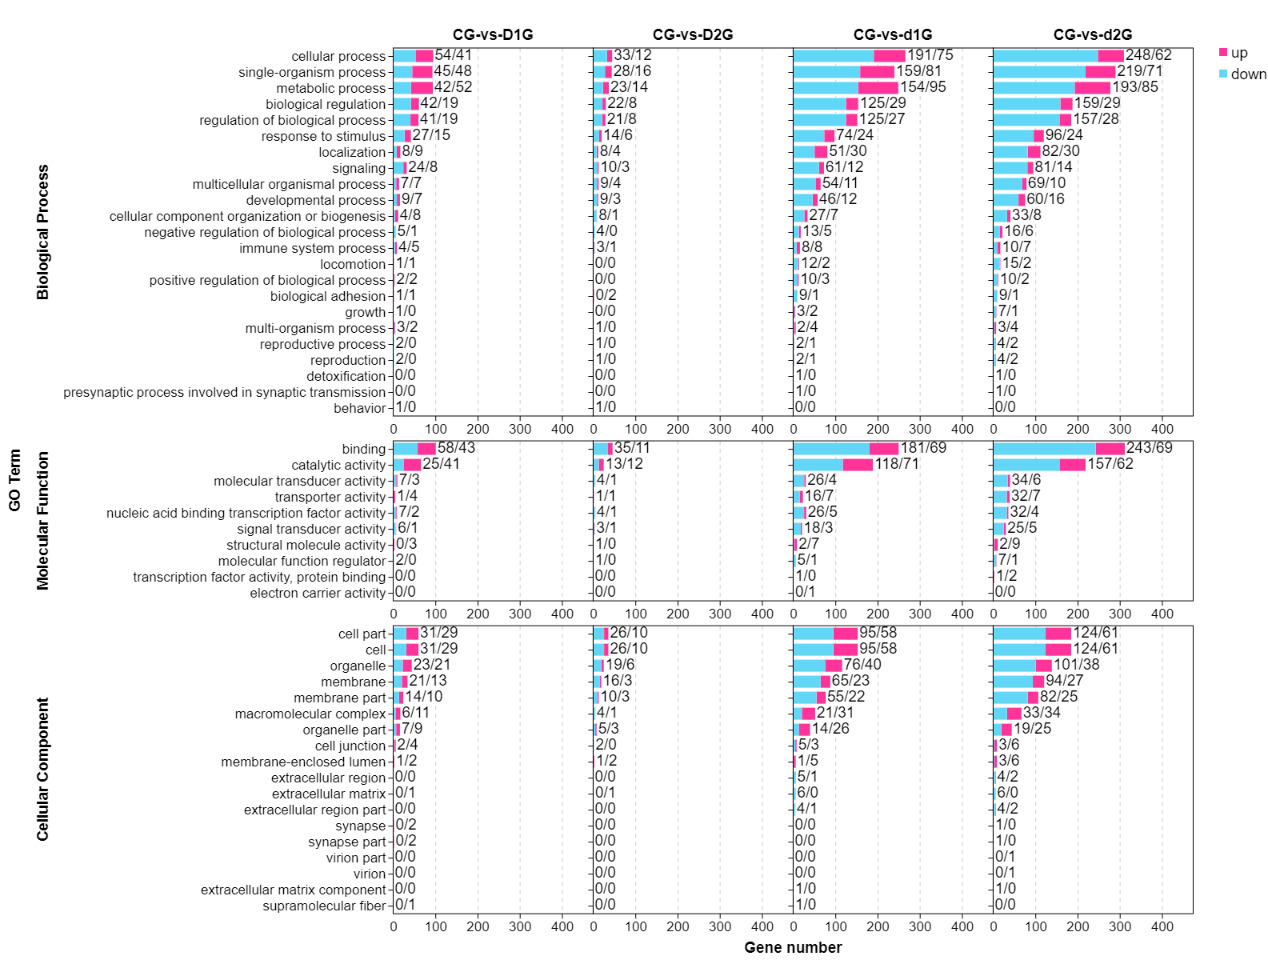
GO enrichment analysis categorized DEGs into three main categories: biological process (BP), molecular function (MF), and cellular component (CC) (Fig. 2). The most significantly enriched BP terms included cellular process, single-organism process, metabolic process, and biological regulation. The top MF terms were binding and catalytic activity, while key CC terms included cellular component, cell, organelle, and membrane. Downregulated genes consistently outnumbered upregulated genes across all comparisons, with DEG counts being substantially higher in the d1G/d2G groups (day 50) compared to the D1G/D2G groups (day 25).
KEGG Functional Enrichment Analysis
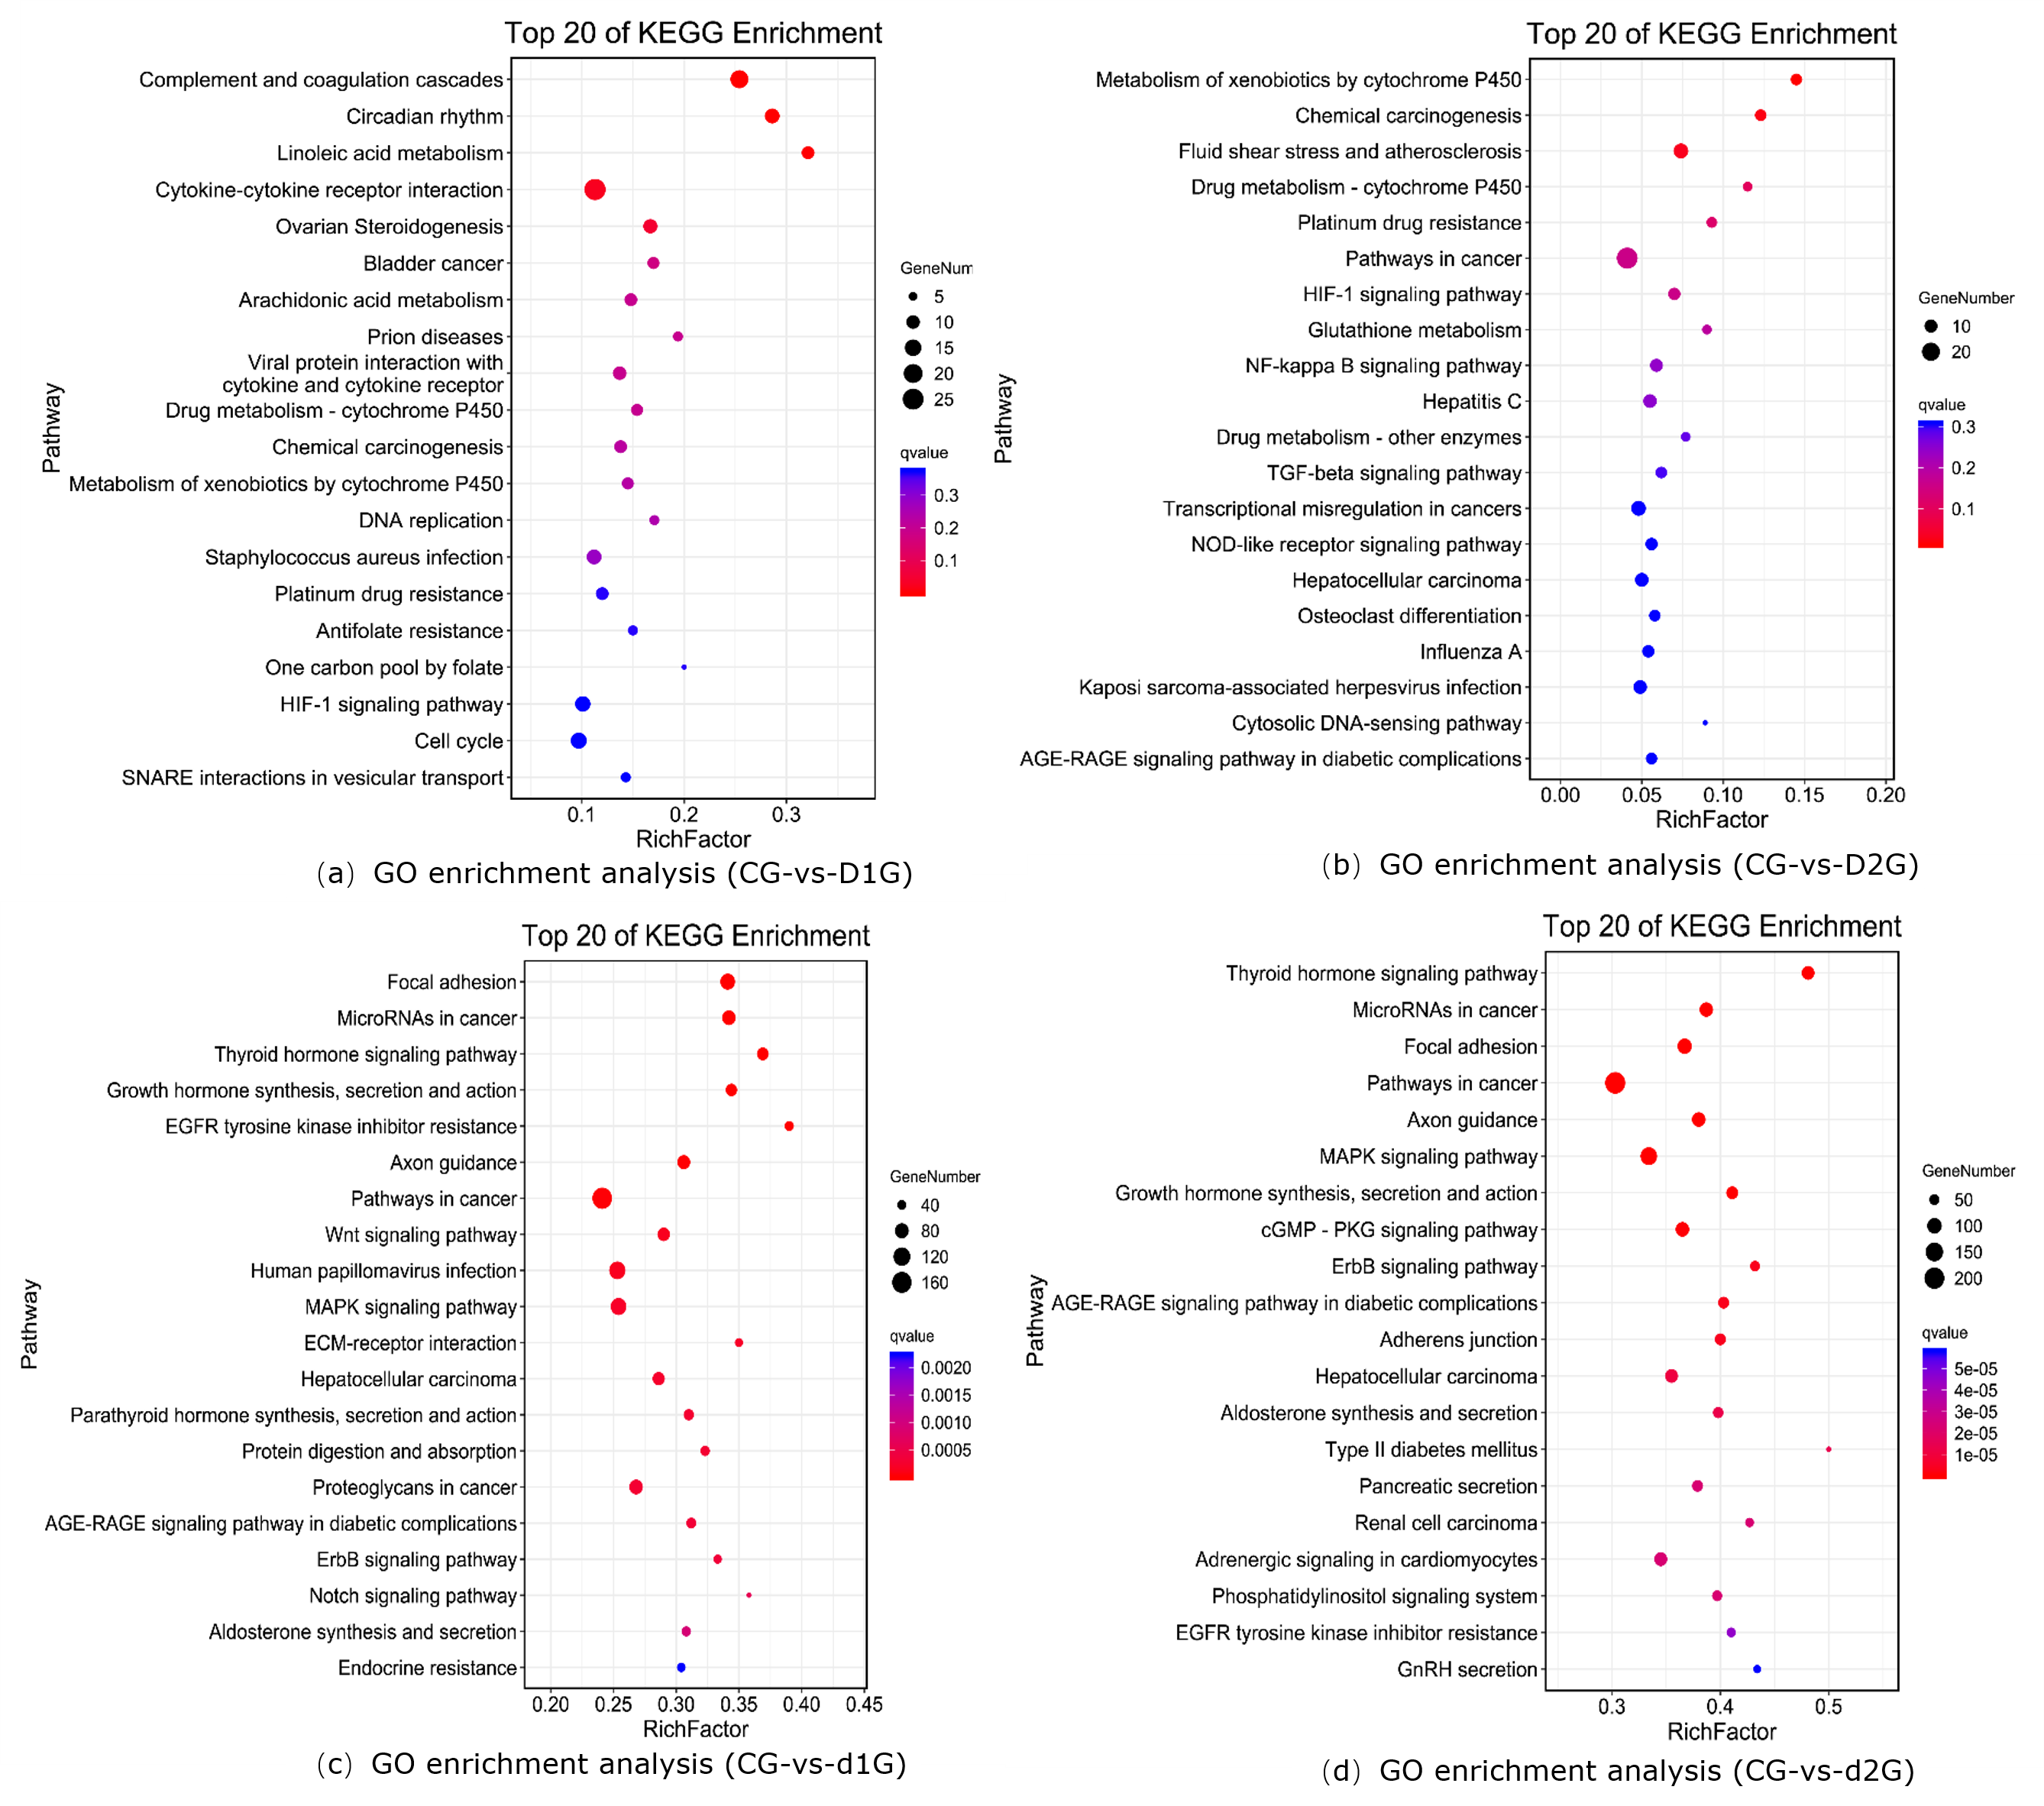
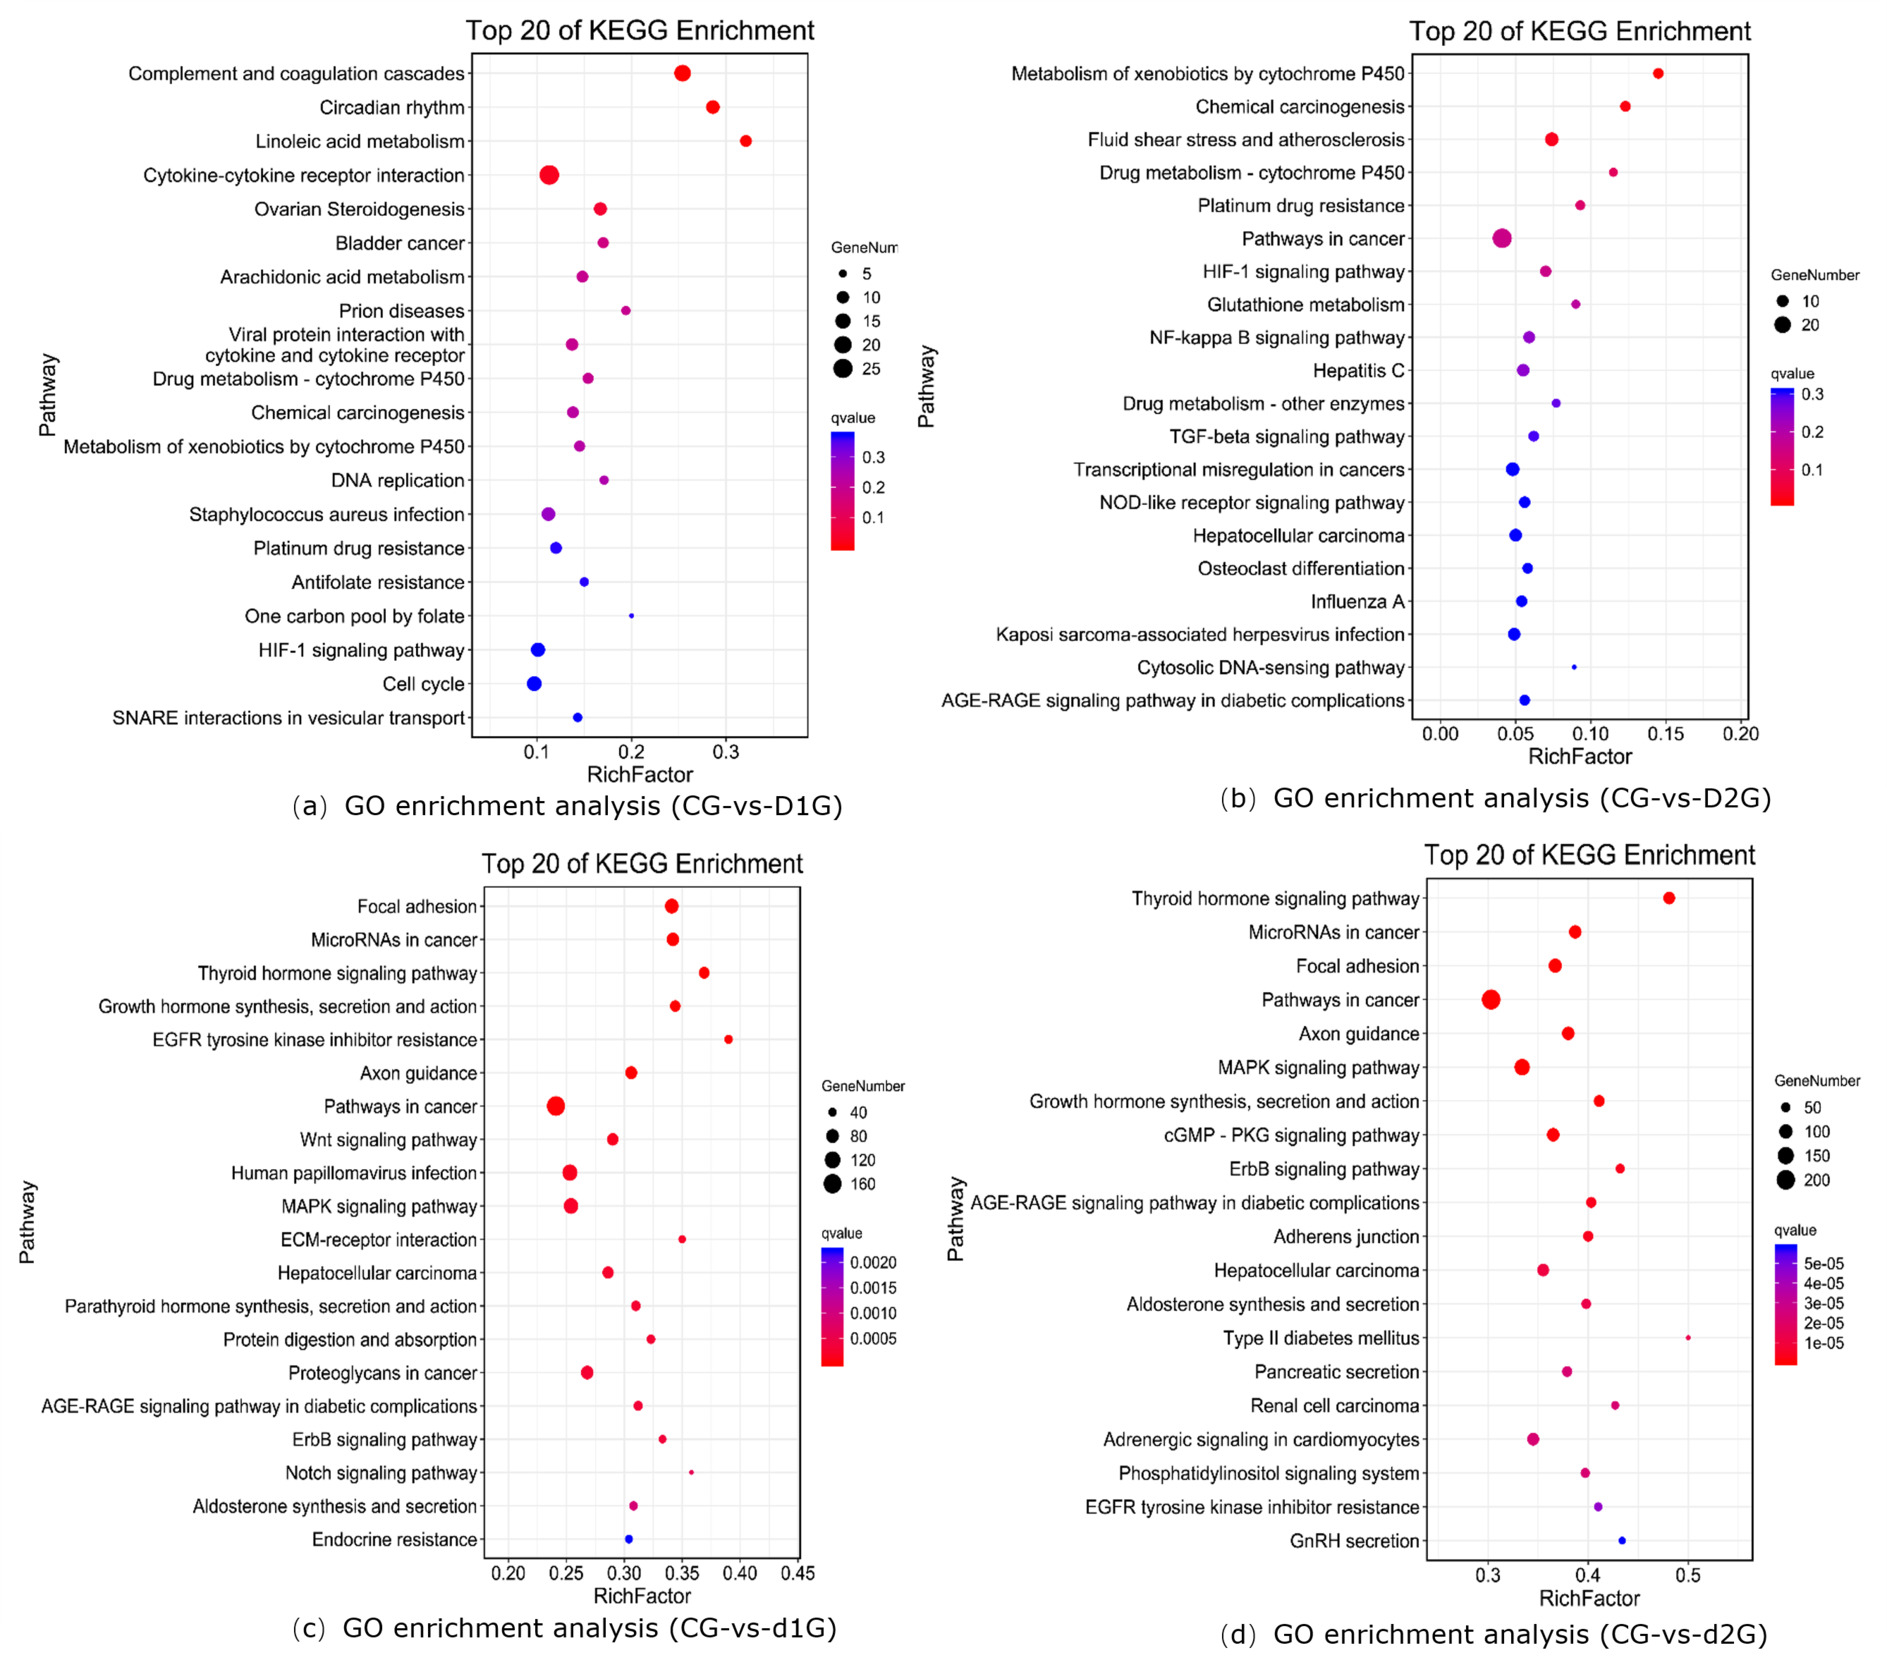
KEGG enrichment analysis revealed significantly enriched pathways (Fig. 3). The y-axis shows pathways; the x-axis shows the enrichment factor (number of DEGs in pathway/total genes in pathway); bubble size represents gene count; redder color indicates lower Q-value. The enrichment analysis results showed that in the CG-vs-D1G comparison, differentially expressed genes were enriched in 299 pathways, with the most significantly enriched pathways being: Complement and coagulation cascades, Circadian rhythm, Cytokine-cytokine receptor interaction, and Ovarian Steroidogenesis (Fig.3a). In the CG-vs-D2G comparison, differentially expressed genes were enriched in 263 pathways, with the most significantly enriched pathway being: Metabolism of xenobiotics by cytochrome P450 (Fig.3b). In the CG-vs-d1G comparison, differentially expressed genes were enriched in 322 pathways, with the most significantly enriched pathways being: Focal adhesion, Growth hormone synthesis, secretion, and action, and the Wnt signaling pathway (Fig.3c). In the CG-vs-d2G comparison, differentially expressed genes were enriched in 326 pathways, with the most significantly enriched pathways being: Focal adhesion, MAPK signaling pathway, Growth hormone synthesis, secretion, and action, and the cGMP-PKG signaling pathway (Fig.3d).
Trend Analysis
Trend analysis clustered gene expression patterns across sequential samples (CG, D1G/d1G or D2G/d2G) based on temporal progression.
Trend Analysis for 100 fish/m³
A total of 5,193 genes from CG_D1G_d1G were assigned to eight expression patterns (Fig.4), among which Profiles 3, 0, and 4 were significant trends. In Profile 3, 1,962 genes showed an initial plateau followed by a downward trend in expression. KEGG pathway analysis indicated that the most significantly enriched pathways were Focal Adhesion, ECM-Receptor Interaction, and Regulation of Actin Cytoskeleton. In Profile 0, 1,051 genes exhibited a continuous downward trend in expression. The KEGG pathway analysis revealed that the most significantly enriched pathways were the Wnt signaling pathway, MAPK signaling pathway, and Growth Hormone Synthesis, Secretion, and Action. In Profile 4, 391 genes showed no change initially followed by an upward trend in expression. The most significantly enriched pathways were the IL-17 signaling pathway, Steroid Hormone Biosynthesis, and Hematopoietic Cell Lineage.

Trend Analysis for 500 fish/m³
For CG_D2G_d2G, 5,697 genes were assigned to eight expression patterns (Fig.5), with Profiles 3, 0, 4, and 7 being significant trends. In Profile 3, 3,206 genes showed an initial plateau followed by a downward trend in expression. The KEGG pathway analysis indicated that the most significantly enriched pathways were Focal Adhesion, Phosphatidylinositol Signaling System, Adherens Junction, MAPK signaling pathway, and Apelin signaling pathway. In Profile 0, 856 genes exhibited a continuous downward trend in expression. The most significantly enriched pathways were Focal Adhesion, cGMP-PKG signaling pathway, and MAPK signaling pathway. In Profile 4, 480 genes showed no change initially followed by an upward trend in expression. The most significantly enriched pathways were the Ribosome, Pertussis, Legionellosis, and IL-17 signaling pathway. In Profile 7, 395 genes showed a continuous upward trend in expression. The most significantly enriched pathways were the Ribosome, Oxidative Phosphorylation, Thermogenesis, Folate Biosynthesis, and Arachidonic Acid Metabolism.

Discussion
DEG Counts and GO Enrichment in Gill Tissue
As the primary interface between fish and their environment, the gill’s transcriptomic responses directly reflect the physiological impacts of density stress. Our comparative analysis of differentially expressed genes (DEGs) across density groups (CG-vs-D1G/D2G/d1G/d2G) revealed significantly more downregulated than upregulated genes, with DEG numbers positively correlated with stress intensity.
Under short-term stress (25 days), the CG-vs-D1G group showed 390 upregulated and 723 downregulated DEGs, while the CG-vs-D2G group exhibited 128 upregulated and 384 downregulated DEGs, indicating acute stress primarily activates defense-related genes.
In contrast, prolonged stress (50 days) triggered a dramatic increase in downregulated genes: the CG-vs-d1G group displayed 794 upregulated and 2,940 downregulated DEGs, and the CG-vs-d2G group had 851 upregulated and 3,745 downregulated DEGs. This pattern suggests chronic stress leads to metabolic suppression, consistent with findings in Pacific white shrimp (Litopenaeus vannamei).23
GO enrichment analysis identified the most significant functional terms: cellular process, single-organism process, metabolic process, biological regulation, regulation of biological process, binding, catalytic activity, cellular component, cell, organelle, and membrane. These findings indicate profound disruption of fundamental physiological processes in gill tissue under crowding stress. Crucially, DEG numbers increased exponentially with prolonged exposure and higher density (d1G/d2G groups showed 3-8 times more DEGs than D1G/D2G groups), demonstrating time-dependent and density-dependent transcriptional reprogramming.
Enriched Pathway Analysis
KEGG pathway analysis uncovered a tiered adaptation network consisting of three functionally coordinated systems, with oxygen stress response being the primary activated component. KEGG analysis of gill tissue revealed significant enrichment of these pathways across individual comparisons or trend analyses: Oxidative phosphorylation, Thermogenesis, Metabolism of xenobiotics by cytochrome P450, Hematopoietic cell lineage, Ribosome, Pertussis, Legionellosis, Folate biosynthesis, and Arachidonic acid metabolism. Cytochrome P450 enzymes, self-oxidizing hemoproteins classified as monooxygenases, mediate metabolism of endogenous and exogenous compounds including environmental chemicals and drugs.24 cyp1b1 encodes a key P450 enzyme.25 Oxidative phosphorylation genes (UQCR11, COX5B; log2FC>4) were upregulated to enhance mitochondrial electron transport chain activity. Concurrently, the hematopoietic cell lineage pathway was stimulated, with erythropoiesis-related genes (e.g., GATA1) showing strong positive correlation with hematocrit levels (r=0.79, p<0.01), demonstrating a physiological cascade from high-density stress → hypoxia → compensatory erythropoiesis. This oxygen-conservation strategy appears more pronounced than in Salmonidae species that primarily rely on angiogenesis. The hematopoietic cell lineage denotes the developmental process where hematopoietic stem cells differentiate into blood cells, including platelets, erythrocytes, macrophages, and granulocytes.26 Upregulation of hematopoietic pathway genes under density stress likely reflects intensified oxygen competition within populations, driving enhanced erythropoiesis to sustain vital activities.
Concurrently, metabolic reprogramming occurred through two key mechanisms: accelerated ribosome biogenesis and folate-dependent synthesis. The coordinated upregulation of both 60S (e.g., RPL26) and 40S subunit genes (e.g., RPS11) facilitated hemoglobin mRNA translation. Meanwhile, DHFR overexpression (3.2-fold increase) supported nucleic acid synthesis, though this folate-dependent pathway may become nutritionally limiting. These adaptations collectively enhance oxygen transport capacity while prioritizing energy allocation to essential biosynthetic processes. The central dogma establishes ribosomal complexes, comprising small (40S) and large (60S) subunits,27 that catalyze protein synthesis. Genes encoding 60S ribosomal proteins include prl22l1, prl26, prl28, prl31, prl35, prl37, prl36a, and prlp1.28,29 Genes encoding 40S ribosomal proteins (e.g., rps17, rps11, rps20, rps21, rps25) belong to the S17E family and localize in the cytoplasm.30 Mutations in these genes are associated with Diamond-Blackfan anemia, which involves impaired peptide elongation and rRNA processing.28 Folate biosynthesis genes showed sustained upregulation. Folate, a one-carbon unit donor, participates in amino acid and nucleic acid biosynthesis. Humans and higher animals lack complete folate synthesis systems; deficiency disrupts protein synthesis and causes pathologies like megaloblastic anemia,31 characterized by abundant immature erythrocytes with underdeveloped nuclei.32 Key genes in this pathway include dhfr33 and ggh. Collectively, upregulation of xenobiotic metabolism, hematopoietic, ribosomal, and folate pathways indicates adaptive enhancement of ribosomal biogenesis to accelerate erythropoiesis and mitigate hypoxia under crowding stress.
Notably, inflammatory responses remained balanced despite stress conditions. Tnf encodes a multifunctional proinflammatory cytokine regulating proliferation, differentiation, apoptosis, coagulation, and lipid metabolism. Its dysregulation links to autoimmune diseases and tuberculosis. Tnf participates in the Legionellosis pathway, where Legionella infection causes respiratory disease via host cell death, tissue damage, and inflammatory immune responses.34 Arachidonic acid, converted into diverse metabolites, regulates inflammation, immunity, fever, and respiratory function.35PLA2G10 encodes a phospholipase A2 enzyme that releases arachidonic acid from membrane phospholipids, initiating inflammatory lipid mediator production. The PLA2G10-mediated arachidonic acid metabolism pathway induced mild gill inflammation (histologically confirmed as lamellar congestion), while TNF/IL-10 ratio analysis (2.8 vs. >5 in pathogenic infections36) indicated controlled inflammatory responses. These findings suggest that the respiratory system of T. septentrionalis may experience immune-mediated alterations under density stress. Notably, the observed respiratory compromise primarily stems from physiological adaptations rather than pathological damage, distinguishing density-induced stress from disease-related gill injury. This integrated response network demonstrates how T. septentrionalis orchestrates oxygen acquisition, metabolic efficiency, and immune homeostasis to mitigate crowding stress.
Within the Thermogenesis pathway, uqcr11 encodes a component of the ubiquinol-cytochrome c reductase complex; atp5mc3, atp5mf, and atp5pf encode mitochondrial ATP synthase subunits; cox5b and cox7c encode cytochrome c oxidase subunits; and ndufb5 encodes an NADH dehydrogenase.37 Uqcrq, uqcr11, atpP5mc3, and cox5b also function in oxidative phosphorylation. Upregulation of these genes indicates enhanced oxidative phosphorylation to meet elevated energy demands during oxygen competition under density stress.36,37
Conclusion
The current study reveals that the density stress triggers coordinated activation of pathways governing protein synthesis (ribosomal biogenesis), cellular development (erythropoiesis), oxygen transport capacity, and metabolic adaptation (oxidative phosphorylation) in T. septentrionalis gills.
Acknowledgments
We thank Prof. Siqing Chen and Dr. Li Bian at Yellow Sea Fisheries Research Institute, CAFS for providing the whole genome sequence of T. septentrionalis. This study is financially supported by Central Public-interest Scientific Institution Basal Research Fund, ECSFR, CAFS (No.2024TD07) and Science and Technology Commission of Shanghai Municipality (Shanghai Natural Science Foundation No. 19ZR1470100).
Authors’ Contribution
Conceptualization: Qiqun Cheng;
Data curation: Xiaochen Duan, Xin Chen, Qiqun Cheng;
Formal Analysis: Xiaochen Duan, Xin Chen, Qiqun Cheng;
Funding acquisition: Qiqun Cheng;
Investigation: Xiaochen Duan, Xin Chen, Qiqun Cheng, Wei Liu, Yanqing Wu, Di Peng, Sumaiye Mieradili;
Methodology: Xiaochen Duan, Xin Chen, Qiqun Cheng, Wei Liu;
Project administration: Qiqun Cheng;
Resources: Qiqun Cheng, Yanqing Wu;
Software: Xiaochen Duan, Xin Chen;
Supervision: Qiqun Cheng;
Validation: Xiaochen Duan, Xin Chen, Qiqun Cheng, Wei Liu, Yanqing Wu, Di Peng, Sumaiye Mieradili;
Visualization: Xiaochen Duan, Xin Chen, Qiqun Cheng;
Writing – original draft: Xiaochen Duan, Xin Chen;
Writing – review & editing: Qiqun Cheng, Xiaochen Duan, Xin Chen
Competing of Interest – COPE
No competing interests were disclosed.
Ethical Conduct Approval – IACUC
All animal experiments in this study were conducted in accordance with the relevant national and international guidelines. Our project was approved by Institutional Animal Care & Use Committee (IACUC) of East China Sea Fisheries Research Institute.
Informed Consent Statement
All authors and institutions have confirmed this manuscript for publication.
Data Availability Statement
All are available upon reasonable request.