1. Introduction
Carbohydrates serve as a vital source of energy and contribute to the nutritional value of diets, so playing a crucial role in their overall efficacy.1 Carbohydrates are considered to be the most economical and cheapest nutritional source when compared to lipids and proteins.2,3 The optimization of carbohydrate utilization has the ability to effectively reduce ammonia excretion and attenuate the harmful effects of water pollution .4
There exist optimistic rationales that offer support for the potential use of carbohydrates in fish. These reasons are based on the fact that glucose has the ability to induce the production of insulin. However, high-carbohydrate levels have a negative impact on fish, particularly carnivorous ones.5 Based on prior research, trout fed a high-carbohydrate diet showed sustained hyperglycemia.6 The Oncorhynchus mykiss and Dicentrarchus labrax showed little inhibition of hepatic gluconeogenesis at the molecular and enzyme activity levels when administered a high-carbohydrate diet.7 Insulin has an influence on hepatic gluconeogenesis in Seriola quinqueradiata and Pagrus major, resulting in a notable decrease in blood glucose levels. Besides, the glycolytic potential was increased by the administration of insulin.8 The diminished capacity of fish to utilize carbohydrates may be linked to the suppression of insulin release induced by several hormones, such as somatostatin.9
Rhodiola rosea extract, also known as Rhodiola rosea , has a rich historical lineage as a revered botanical species with medical properties. The use of this substance as a medicinal cure may be traced back to the historical period of the Vikings.10 Rhodiola rosea extract has been associated with a variety of pharmacological properties, including antiaging, hepatoprotective, anti-inflammatory, and antioxidant effects.11,12 Previous studies have found that Rhodiola rosea extract is acknowledged as an important immune modulator. It has the ability to prevent liver gluconeogenesis, decrease adipogenesis and lipid peroxidation, enhance the survival of islet B-cells, and exhibit anti-inflammatory effects.13,14 Furthermore, it has been shown to upregulate the levels of expression of the glutathione peroxidase (GPX) and catalase (CAT) genes in Litopenaeus vannamei, indicating enhanced antioxidant capacity.15 Rhodiola rosea extract improves glucose metabolism in mice and improves antioxidant capacity in Lateolabrax maculatus.16,17
Lateolabrax maculatus, often known as spotted sea bass, belongs to the family Moronidae in the order Perciformes.18 Importantly, the species exhibits distinctive black dots that are visibly present on its lateral body surface. L. maculatus exhibits a geographical distribution that extends from the Bohai Sea to the Indo-China Peninsula.19 The annual production of L. maculatus in China is approximately 220,000 tons.20 Our research group has conducted consecutive studies on this species under high-carbohydrate stress: in 2023, we focused on intestinal health, investigated how different concentrations of Rhodiola rosea extract (30–120 mg/kg) affect intestinal digestive enzyme activities, barrier function-related genes, and gut microbiota composition, and identified 60 mg/kg as the optimal dose for improving intestinal homeostasis.17 In 2024, we shifted to exploring the intestinal inflammatory response and confirmed that 60 mg/kg Rhodiola rosea extract significantly downregulated pro-inflammatory genes while upregulating anti-inflammatory factors, thereby alleviating intestinal inflammation induced by high-carbohydrate diets.
However, these prior studies had two limitations: first, they focused solely on intestinal-related indices and did not involve liver metabolism or insulin signaling pathways; second, the optimal dose for intestinal health (60 mg/kg) was not evaluated for its effects on hepatic function.21 Based on these gaps, the aim of this study was to assess the impact of various levels of Rhodiola rosea extract (with a focus on verifying the comprehensive efficacy of 120 mg/kg) upon the antioxidant capacity, immunological response, and insulin signaling pathways in juvenile L. maculatus that were fed a carbohydrate-rich diet, while also comparing it with the 60 mg/kg dose to clarify organ-specific dose effects.
2. Materials and methods
2.1. Feeding Protocols
The Rhodiola rosea extract, sourced from Xi’an Lancao Biotechnology Co., Ltd., contained a salidroside concentration of 10%. Three experimental diets were prepared, comprising a control group (20% carbohydrate), the HC group (30% carbohydrate), and the HC group enhanced with Rhodiola rosea extract (120 mg/kg) (Table 1). This Rhodiola rosea extract dosage was selected based on its efficacy in hepatic protection, while our prior study identified 60 mg/kg as optimal for intestinal health, reflecting organ-specific responsiveness.21 Cornstarch is the primary source of carbohydrates, while the key sources of protein are casein and fish meals. In addition, fish oil is the main source of fat. In this study, the diets were prepared based on the method outlined in our previous work.17 In summary, the dry components were thoroughly mixed manually prior to their incorporation with water and oils. Next, the dough was formed using mechanized pelletizing machinery (F-26, South China University of Technology, Guangzhou, China) into spherical pellets with a diameter of 2.5 mm. After that, diets were air-dried and stored in bags at -20°C until they were used.
2.2. Feeding management
The Shenzhen Long Qi Zhuang Industrial Development Co., Ltd. (Shenzhen, China) provided all of the experimental L. maculatus that was used. Before starting the official experiment, the fish had a 14-day acclimatization phase in polythene cages, during which they were provided with commercial meals sourced from Guangdong Yuequn Marine Life Research and Development Co., Ltd., located in Jieyang, China. Subsequently, a total of 225 adolescent individuals with a body weight close to the average (9.37±0.14g) were selected in a random and equitable manner. These individuals were then uniformly distributed among three cages of 1.0 m × 1.0 m × 1.5 m, with every treatment being replicated three times. The fish were provided
with food twice a day, at 6:00 and 18:00 hours, for 56 days until they seemed satiated. The pH of water ranges from 7.63-8.44 and the temperature range was 28.2°C-32.3°C. Salinity was within a range of 20‰ to 25‰, and the concentration of dissolved oxygen exceeded 5.1 mg/L for the duration of the study.
2.3. Sampling
The fish had a 24-hour fast after the feeding experiment, and then MS-222 was used to anesthetize them (Sigma, St. Louis, MO, USA. Subsequently, the livers of seven fish from each cage were sampled and stored in RNase-free 1.5mL centrifuge tubes. Subsequently, the tubes were rapidly cryopreserved in liquid nitrogen and kept at -80°C for the purpose of assessing enzyme activity and gene expression. Blood was collected from the tail vein and placed into a 1.0 mL centrifuge tube. Liver samples were obtained by randomly sampling three fish from each cage. These samples were quickly preserved into fish liver slices in neutral-buffered formalin.
2.4. Plasma and liver biochemical indices
The Huawei Delong DR-200BS Enzyme Labeling Analyzer was used to conduct an enzyme-linked immunosorbent test (ELISA) to ascertain the levels of plasma lactate (LA), insulin (INS) and pyruvate (PA). The measurements of alanine aminotransferase (ALT), triglycerides (TG), and total cholesterol (TC) were conducted using an automated biochemical analyzer, the Myriad BS-420 Automatic Biochemical Instrument. The levels of liver lipid peroxidation product, total antioxidant capacity (T-AOC), superoxide dismutase (SOD), catalase (CAT), phosphoenolpyruvate carboxykinase (PEPCK), and hexokinase (HK) were assessed using commercially available assay kits (refer to our previous paper for the reagent kit company and reagent model).17
2.5. Liver histology and electron microscopy
The liver tissues were fixed in 10% neutral-buffered formalin, subsequently processed through a graded ethanol series for dehydration, and finally encapsulated in paraffin. Hematoxylin and eosin (H&E) was used to stain 4 µm sections. Oil Red O stain and electron microscopy were carried out as documented in prior studies .22–24
2.6. Real-Time Polymerase Chain Reaction
RNA was isolated from L. maculatus liver tissue using the Foregene RNA kit. The purity of the extracted RNA was assessed with 1% agarose gel electrophoresis, and the RNA concentration was measured with the Nanodrop 2000 (Thermo Fisher Scientific, Waltham, MA, USA). The RNA was reverse transcribed into cDNA using the HiScript™ cDNA Synthesis Kit for qPCR (MIKX). After that, it was kept at -20°C. A 10 µL mixture made up the real-time polymerase chain reaction (PCR) amplification apparatus. Please refer to our previous article for specific experimental methods.17 Table 2 details the β-actin gene utilized as a standard and the primer sequences for the target gene.
2.7. Statistical Analysis
Before doing the study, we assessed the normality of homogeneity and the distribution of variance. The statistical analysis was conducted using IBM SPSS Statistics 26.0 software, developed by IBM Corporation in Somers, NY, USA. A one-way analysis of variance (ANOVA) and a Tukey test were both used to determine the statistical significance (p < 0.05). The data is represented as means ± S.E.M.
3. Results
3.1. Growth Performance
No significant differences in FCR, WGR, CF, VSI, CI, VAI were found among treatments (p > 0.05). Compared with the control group, SR and HSI were significantly increased in the HC group (p < 0.05), but SGR and liver glycogen showed no significant differences (p > 0.05). SGR was significantly higher in the groups supplemented with 120 mg/kg dietary Rhodiola rosea extract than in the 30% carbohydrate group, the opposite pattern was seen in SR and liver glycogen (p < 0.05) (Table 3).
3.2. Plasma biochemical analysis
No significant difference in TC was found among treatments (p > 0.05). Unlike the controlled group, TG was significantly increased in the HC group (p < 0.05), however INS, LA, PA, and ALT showed no significant differences (p > 0.05). TG and ALT were significantly lower in the groups supplemented with 120 mg/kg dietary Rhodiola rosea extract than in the HC group, but the INS, LA, and PA were significantly increased (p < 0.05) (Table 4).
3.3. Histological analyses
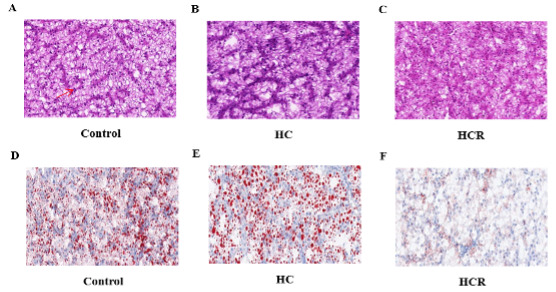
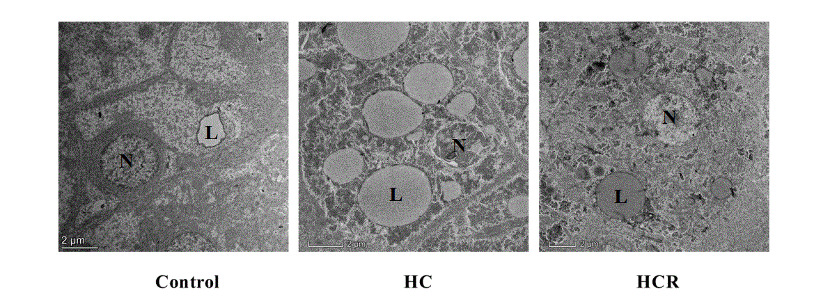
There was shrinkage and darkening of liver cells (Fig. 1) in the HC group (B) compared to the control group (A), as well as an increase in liver vacuoles, blurring of cell boundaries, and a decrease in the number of nuclei. The consistency and abundance of nuclear density in hepatocytes were higher in the HCR group (C) than in the HC group (B). The lipid droplets were more numerous and larger in the HC group (E) than in the control group (D). When compared to the HC group (E), the lipid droplets in the HCR group (F) became smaller and fewer in number (Fig. 1). As shown in Fig. 2, there was a large increase in the number of lipid droplets observed in the HC group (B) compared to the control group (A). Decrease in the number of lipid droplets and smaller lipid droplet morphology in the HCR group (C) compared to the HC group (B).


3.4. Liver enzyme activity analysis
There were no significant variations in the activity of HK and PEPCK among the control and HC groups (p > 0.05). The activity of HK and PEPCK in the HCR group was lower than that observed in group HC (p < 0.05) (Table 5).
Liver T-AOC and CAT activity were lower in the control group compared to the HC group, but MDA showed an opposite trend (p < 0.05). T-AOC and SOD activity in the liver were higher in the HCR group compared to the HC group, however, CAT activity was lower (p<0.05). MDA levels showed no significant change (p > 0.05) (Table 6).
3.5. Gene expression associated with glucose metabolism in the liver
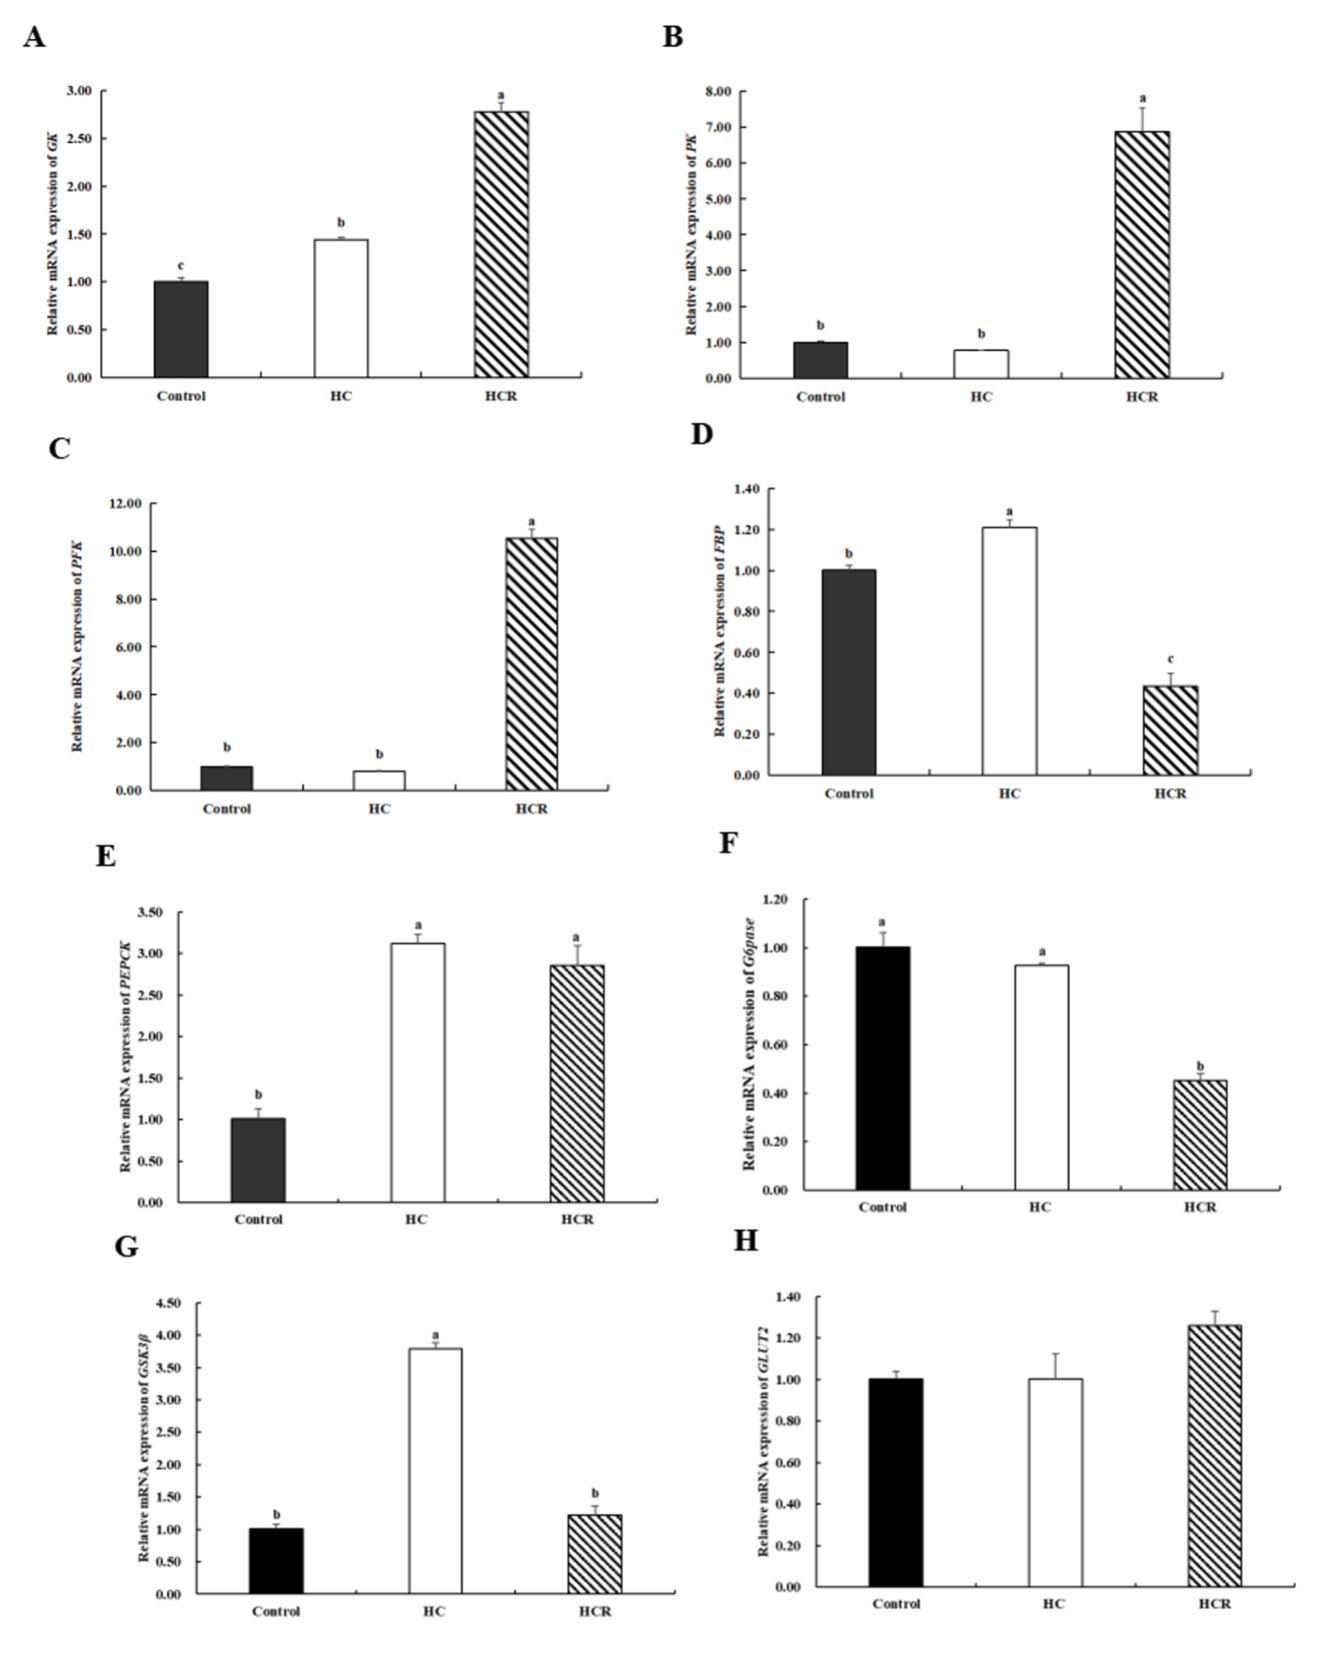
In relation to the control group, the relative expression of GK, PEPCK, FBP (fructose 1, 6-bisphosptase), and GSK3β (Glycogen synthase kinase-3β) in the liver of the HC group increased (p < 0.05), while the relative expression of PK (pyruvate kinase), PFK (phosphofructokinase), G6Pase (glucose-6-phosphatase), and GLUT2 (glucose transporter 2) remained unchanged (p > 0.05). Compared with the HC group, the relative expression of GK, PK, and PFK in the liver of the HCR group increased (p < 0.05). However, the relative expression of FBP, G6Pase, GSK3β in the liver of the HCR group were decreased (p < 0.05). The relative expression of PEPCK and GLUT2 showed no significant change (p > 0.05) (Fig. 3).

3.6. Gene expression associated with insulin signalling pathways in the liver
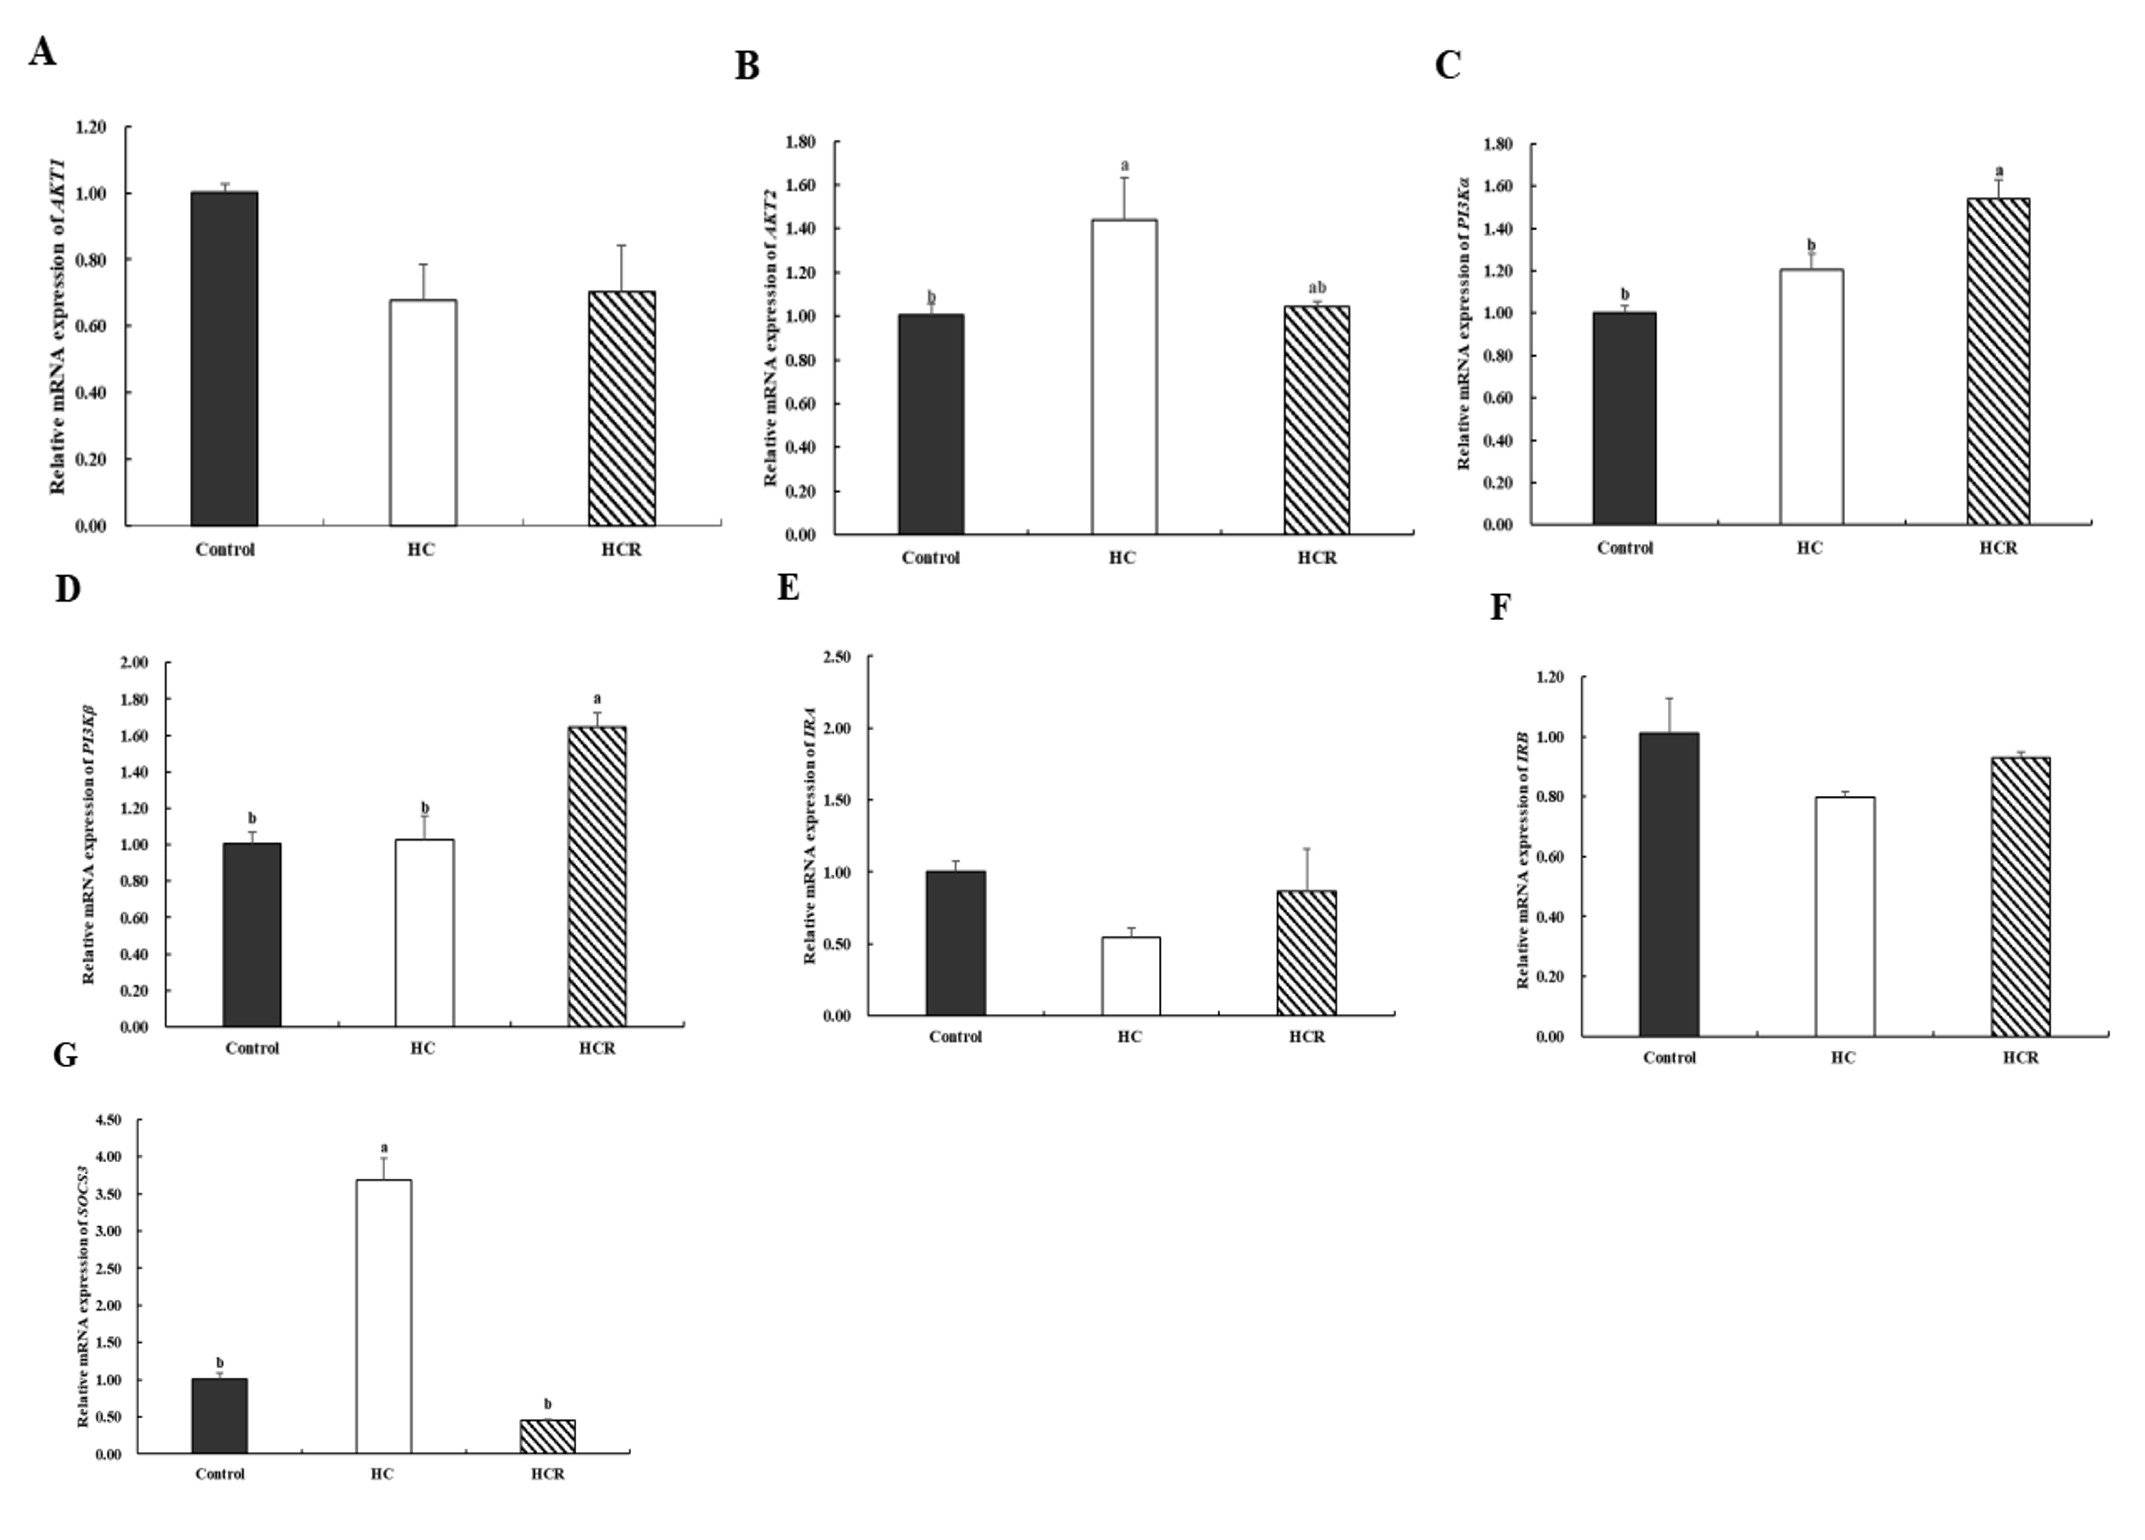
Relative to the control group, the relative expression of AKT2 (protein kinase Bβ), SOCS3 (Suppressor of cytokine signalling 3) in the liver of the HC group increased (p < 0.05), while the relative expression of AKT1 (protein kinase Bα), PI3Kα (Phosphatidylinositol-3-kinase α), PI3Kβ (Phosphatidylinositol-3-kinase β), IRA (insulin receptor subtype A), IRB (insulin receptor subtype B) were no significant difference (p > 0.05). In comparison to the HC group, the expression of PI3Kα, PI3Kβ in the liver of the HCR group was increased (p < 0.05). But the relative expression of SOCS3 was decreased (p < 0.05). The relative expressions of AKT1, AKT2, IRA, and IRB showed no significant difference (p > 0.05) (Fig. 4).

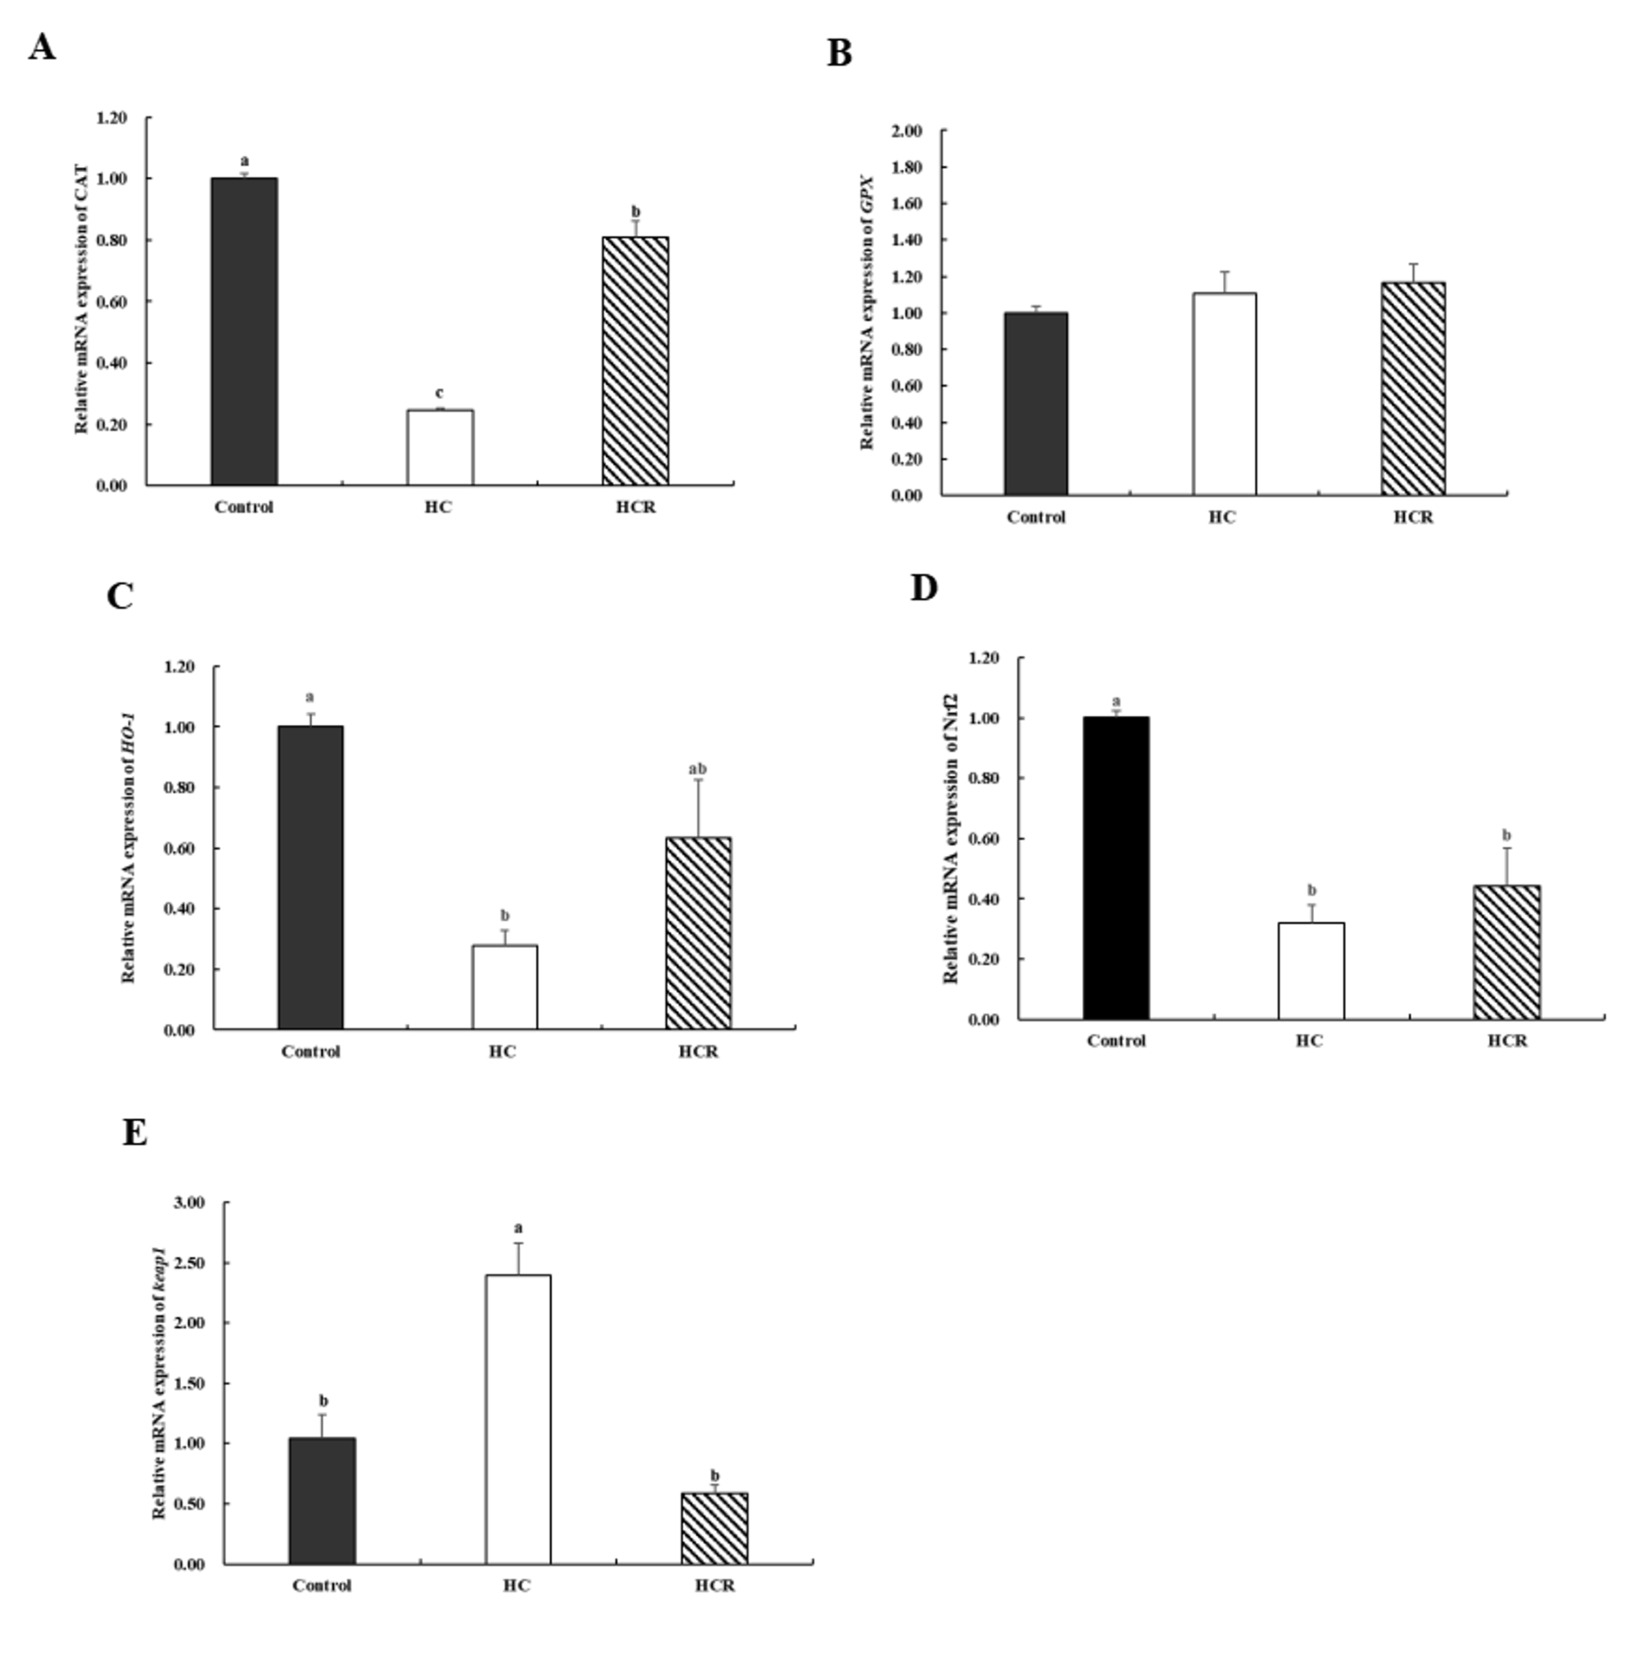
3.7. Gene expression associated with antioxidant activity in the liver
There was no significant difference in GPX (glutathione peroxidase) gene expression between treatments (p > 0.05) (Fig. 5). In comparison to the control group, the expression of CAT, HO-1 (heme oxygenase-1) and Nrf2 (nuclear factor erythroid 2-related factor 2) in the liver decreased in the HC group (p < 0.05), but the relative expression of Keap1 (Kelch-like ECH-associated protein 1) in liver was opposite (p < 0.05). Compared to the HC group, the relative expression of CAT in the liver was increased in HCR group (p < 0.05), but the relative expression of Keap1 in liver was opposite (p < 0.05). The relative expression of HO-1 and Nrf2 in the liver increased but there was no significant difference (p > 0.05) (Fig. 5).

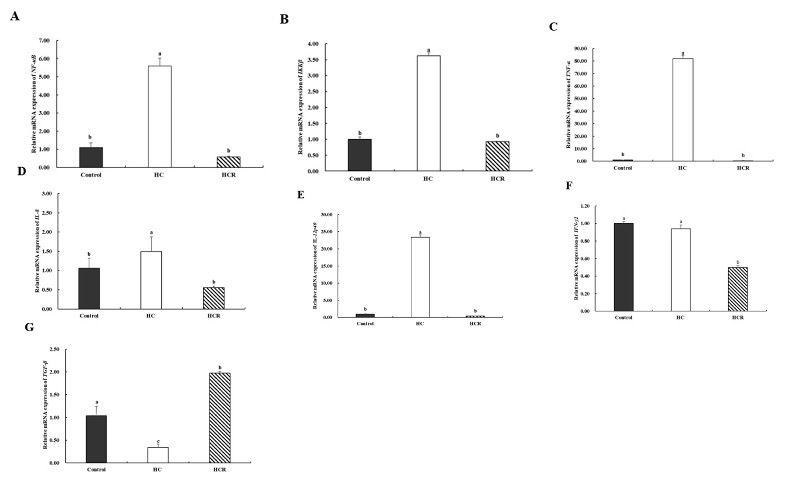
3.8. Gene expression associated with immune function in the liver
Relative to the control group, the relative expression of IL-8 (Interleukin-8), NF-κB (nuclear factor-κB), IKKβ (IκBkinaseB), TNF-α (tumor necrosis factor α) and IL-12p40 (Interleukin-12p40) in the liver of the HC group increased (p < 0.05), but the expression level of TGF-β (transforming growth factor β) in the liver was in contrast (p < 0.05). The relative level of IFN-γ2 (interferon-γ2) in the liver showed no significant difference (p > 0.05). Relative expression of IKKβ, IL-8, IL-12p40, NF-κB, TNF-α, and IFN-γ2 in hepatic tissue was lower in the HCR group than in the HC group (p < 0.05), while TGF-β expression was higher (p < 0.05) (Fig. 6).

4. Discussion
In the present investigation, the inclusion of microcrystalline cellulose at a concentration of 10.5% was implemented in the diets as a means of supplementing the required carbohydrate amounts, and it was expected that the growing performance of the fish would not be adversely impacted.17,25 SGR was significantly lower in the 30% carbohydrate group than in the 20% carbohydrate group and higher in the groups supplemented with 120 mg/kg dietary Rhodiola rosea extract than in the 30% carbohydrate group, which indicated that the growth of L. maculatus was found to be adversely impacted by high-carbohydrate intake, whereas the inclusion of Rhodiola rosea extract resulted in enhanced growth performance. Previous research has demonstrated that the growth of fish can be significantly enhanced with the administration of feeding immunostimulants, such as berberine and emodin.26,27 The accumulation of glycogen in excess of normal levels may induce hepatic injury in fish.28 Based on this study, taking Rhodiola rosea extract supplements led to a reduction in liver glycogen and a reduction in the liver damage that high-carbohydrate intake in L. maculatus caused.
The blood indicator is a significant biomarker used in the assessment of an organism’s overall health.20 Based on previous studies, Rhodiola rosea extract decreased carbohydrate-induced insulin resistance in mice. The plasma INS increased in the present study, indicating that Rhodiola rosea extract L supplementation enhances insulin secretion. Similar to the study of Rhodiola rosea extract L, expanding islet size increases the proportion of beta cells.29 PA is produced by the glycolysis cycle and may be converted to LA .30 In this study, the Rhodiola rosea extract supplements increased PA and LA, which suggests that Rhodiola rosea extract improved glucose metabolism. Fenugreek and Rhodiola rosea extract are both phytotherapeutic agents. It has been shown that fenugreek seeds have the ability to effectively regulate and maintain stable levels of plasma lipids in rats, and Rhodiola rosea extract could improve lipid metabolism and anti-cellulite.31,32The current study observed a reduction in plasma TG levels after supplementation with Rhodiola rosea extract. This finding suggests that Rhodiola rosea extract may possess the potential to enhance lipid metabolism.
MDA is used as a biomarker to measure lipid peroxidation and oxidative stress. Additionally, it has biotoxic properties.33 In this study, the MDA increased in the HC group compared with the control group, which showed that the high-carbohydrate diet may lead to the peroxidation of liver lipids. T-AOC, SOD, and CAT are the three main antioxidant enzymes in the organism.34 In the present study, the activity of T-AOC, SOD, and CAT both tend to decrease in the HC group compared with the control group. However, with supplementation with Rhodiola rosea extract, T-AOC and SOD activity increased in the HCR group when compared to the HC group. The result suggests that Rhodiola rosea extract protects the L. maculatus liver from the harmful effects of high-carbohydrate intake by increasing its antioxidant activity.
According to studies, fish liver’s histological morphology may be used as a reliable predictor of their nutritional state, metabolism, and liver health .35In the present study, high-carbohydrate intake increases the size of lipid droplets in L. maculatus liver and increases the number of lipid droplets. The findings of this study align with those in Megalobrama amblycephala.24 However, with Rhodiola rosea extract supplementation, the lipid droplets are reduced in size and number, the enlargement of nucleus and the hepatocytes become regular and abundant. This study showed the hepatoprotective properties of Rhodiola rosea extract on the liver. ALT levels are an essential marker of liver damage.36 Earlier research has demonstrated that intake of Rhodiola rosea extract has been associated with enhanced hepatic function, as seen by a reduction in plasma transaminase levels.37 Similar to this, in our investigation, Rhodiola rosea extract supplementation resulted in a hepatoprotective effect by reducing plasma ALT.
Glucose metabolism, antioxidants, and inflammation are all related.38According to studies, a diet high in carbohydrates reduces the capacity of the organism to produce antioxidants, which can lead to inflammation.39 The two key pathways in the metabolism of carbohydrates are glycolysis and gluconeogenesis. The main enzymes involved in glycolysis are HK, GK, PK, and PFK, whereas the key enzymes in gluconeogenesis are FBP, PEPCK, and G6pase.40 In this research, high-carbohydrate elevated the levels of GK. Similar to findings in Cyprinus carpio.41 And the high-carbohydrate diet used in this research increased the expression of FBP and PEPCK, which suggested that high-carbohydrates promote gluconeogenesis. which is in line with the prior discoveries of Sparus aurata.42Rhodiola rosea extract has been shown to inhibit gluconeogenesis.43 Adding Rhodiola rosea extract for the diet, the activity of HK and PEPCK decreased. Differently, the level of GK, PK, and PFK increased, but the expression of FBP and G6pase decreased. Adding Rhodiola rosea extract to a high-carbohydrate diet decreased gluconeogenesis and glycolysis at the level of enzyme activity. Conversely, at the gene level, Rhodiola rosea extract increased gluconeogenesis and inhibited glycolysis. The findings of this study indicate that the addition of Rhodiola rosea extract to a diet high in carbohydrates inhibits the mechanism of gluconeogenesis. GSK-3β plays an important role as an enzyme in liver glucose metabolism, including in the regulation of liver glycogen production, leading to its reduction.44 This research suggests that the expression of GSK-3β was higher in the HC group compared to the control group, however, there was no statistically significant change in liver glycogen levels, indicating that a diet rich in carbohydrates disrupted glucose utilization. GSK-3β expression increased in the HCR group after Rhodiola rosea extract supplementation, which is compatible with the present study’s findings of reduced hepatic glycogen.
In the normal insulin signalling pathway in the liver, insulin activates the kinase AKT2 and decreases the expression of genes involved in gluconeogenesis.44 As one of the three AKT isozymes, AKT2 is essential for maintaining glucose homeostasis in zebrafish.44 In this research, both the HC and HCR groups demonstrated an upregulation of AKT2 expression compared to the control group, with the HCR group exhibiting the highest insulin levels. Similar to insulin changes, AKT2-null zebrafish have decreased levels.44 PI3K is an IRS-1 downstream gene that is essential for insulin metabolic action.45 The phosphorylation of AKT, mediated by insulin, is contingent upon the presence and activity of PI3Kα. Previous research that investigated the pathways of insulin-induced PI3K activation discovered that high glucose levels only occur when both PI3Kα and PI3Kβ are inhibited.46 According to our findings, administering Rhodiola rosea extract as a supplement affects the expression of PI3Kα and PI3Kβ. This finding suggests that Rhodiola rosea extract in a high-carbohydrate diet did not contribute to L. maculatus’s hyperglycemia. SOCS3 prevents the binding of IRS to PI3K, and the loss of SOCS3 results in an increase in insulin signaling effects. In the current research, the expression of SOCS3 increased in the HCR group relative to the HC group. This suggests that supplementing a carbohydrate-rich diet with Rhodiola rosea extract improves the insulin signalling pathway in L. maculatus.
CAT is a crucial enzyme involved in the first response to counteract oxidative stress. CAT is a terminal oxidase whose primary job is to avoid excessive blood H2O2 levels after liver damage.47 Inhibiting oxidative stress and promoting the expression of many antioxidant genes, including CAT, are two functions of Nrf2. And it could regulate the expression of antioxidant genes such as CAT, GPX, and HO-1. In this study, the expression of CAT, HO-1 and Nrf2 decreased, and Keap1 increased in the HC group compared with the control group. However, after supplementation with Rhodiola rosea extract into a high-carbohydrate diet, the expression of CAT, HO-1, and Nrf2 increased, and Keap1 decreased. According to previous studies, Keap1 can reduce the activity of Nrf2, and a decreased expression of Keap1 can improve the ability of antioxidants.48 This result indicates that including Rhodiola rosea extract into a diet high in carbohydrates may lead to the activation of the Nrf2/HO-1 pathway, resulting in the reduction of oxidative stress. Similarly, in the case of Stevia rebaudiana Bertoni, also a plant, it was discovered that it induces an increase in HO-1 mRNA expression in the liver of mice.49 And berberine, as a natural supplement, also, by activating the Nrf2/HO-1 pathway, improved liver damage in rats .49 Previous studies have discovered that Nrf2 activity may be regulated by PI3K/AKT.50 Drawing on the findings of this experiment and prior research, we hypothesize that Rhodiola rosea extract may enhance the hepatic antioxidant capacity of L. maculatus, with gene expression indicating a potential role of the PI3K/AKT/Nrf2/HO-1pathway. However, this mechanistic link requires further validation through functional assays, such as those employing pathway-specific inhibitors or activators.
Inflammation is encouraged by an imbalance between free radicals and antioxidants.51,52 An essential function of NF-κB is to control inflammation.53 Moreover, IKKβ activation is necessary for NF-κB activation.54 Increased transcription of pro-inflammatory cytokine genes, which include TNF-α and IL-8 is caused by activation of NF-κB. Consequently inflammation. IFN-γ2 and IL-12p40 are pro-inflammatory cytokines as well.39 TGF-β is an anti-inflammatory cytokine, it can inhibit the inflammatory response.35 In this study, the expression of NF-κB, IKKβ, IL-8, IFN-γ2, TNF-α, and IL-12p40 increased, and the expression of TNF-α reduced in the HC group relative to the control group. This suggests that high-carbohydrate diets cause an inflammatory response in the liver. However, the trend is reversed after supplementation with Rhodiola rosea extract in a high-carb diet. So, in a high-carb diet, Rhodiola rosea extract includes the capacity to be anti-inflammatory in the liver of L. maculatus.
In conclusion, supplementing high-carbohydrate diets with Rhodiola rosea extract (120 mg/kg) may alleviate the detrimental impacts of such diets on fish by optimizing glucose metabolism and bolstering antioxidant and anti-inflammatory responses.
Acknowledgments
This work was supported by Hainan Provincial Natural Science Foundation of China (324MS133) and the Central Public-interest Scientific Institution Basal Research Fund, CAFS (2025XT0802; 2023TD58).
Authors’ Contribution
Methodology: Luzhe Zheng (Equal), Chuanpeng Zhou (Equal). Formal Analysis: Luzhe Zheng (Lead). Investigation: Luzhe Zheng (Equal), Zhanzhan Wang (Equal), Bo Zhang (Equal), Jun Wang (Equal), Yun Wang (Equal), Heizhao Lin (Equal), Zhenhua Ma (Equal). Writing – original draft: Luzhe Zheng (Lead). Resources: Lihua Qiu (Equal), Chuanpeng Zhou (Equal). Supervision: Lihua Qiu (Equal), Chuanpeng Zhou (Equal). Conceptualization: Chuanpeng Zhou (Lead). Writing – review & editing: Chuanpeng Zhou (Lead). Funding acquisition: Chuanpeng Zhou (Lead).
Competing of Interest – COPE
No competing interests were disclosed.
Ethical Conduct Approval – IACUC
The animal experiment was approved by the Animal Care and Use Committee of South China Sea Fisheries Research Institute, Chinese Academy of Fishery Sciences (Approval number nhdf2025-20). All procedures were strictly carried out according to the regulations and guidelines approved by the committee.
Informed Consent Statement
All authors and institutions have confirmed this manuscript for publication.
Data Availability Statement
The data that has been used is confidential.