


1. Introduction
Under the dual pressures of escalating climate change and increasing natural resource constraints, the global food system is facing unprecedented challenges. The 2024 State of Food Security and Nutrition in the World report highlights that, in 2023, approximately 2.33 billion people worldwide faced moderate or severe food insecurity, and in 2022, over 2.8 billion people were unable to afford a healthy diet.1 Promoting sustainable development in agriculture and fisheries, while improving resource use efficiency, is essential to ensure global food security.2 Aquatic products have become an integral part of global food security, gaining increasing importance. This is due to growing awareness of their health benefits and the rising social preference for seafood. The scale of aquaculture is likely to expand in the future (Clark et al., 2019).3 Optimizing the international trade structure of aquatic products, strengthening fisheries resource management, and promoting green and healthy aquaculture practices will help better secure global food security. (Chen et al., 2023).4
Current studies generally agree that economic development, market maturity, technological advancements, and cultural backgrounds are key factors determining aquatic product consumption. (Lu et al., 2002; Hu & Wang, 2009; Yue et al., 2017; Tian et al., 2024).5–8 From a national perspective, there are significant regional differences in aquatic product consumption. While accelerating urbanization, it is essential to consider the differentiated characteristics of aquatic product consumption across regions. (Zhang & Sun, 2009).9 At the global level, significant differences exist among countries in terms of consumption patterns, structures, and levels of aquatic products. These differences are not only related to income levels but are also influenced by market maturity and cultural factors. (Zhang et al., 2021).10 Understanding these differences is crucial for developing the aquatic economy and formulating relevant policies. (Zhang & Zhao, 2018).11
As a high-nutrient and low-environmental-impact aquatic product, shellfish holds significant socio-economic and ecological value. From an industrial economics perspective, shellfish aquaculture has become a key sector driving employment growth, promoting rural economic development, optimizing dietary structures, and improving living standards (Que & Zhang, 2016).12 In terms of sustainability, studies have shown that shellfish products are an important source of sustainable animal protein. Through innovative technological advancements in shellfish production models, traditional agricultural resource constraints can be overcome, providing marginalized groups in the global food security system with a sustainable protein source (Hallström et al., 2019; Willer & Aldridge, 2020).13,14 Compared to land-based livestock farming, shellfish aquaculture offers significant advantages in carbon emissions (Ray et al., 2018; Ray et al., 2019; Jones et al., 2022),15–17 making it an ideal choice for the transition to sustainable diets. In comparison to other aquatic products, shellfish provides a more environmentally friendly protein source. However, the resource potential of shellfish aquaculture remains underutilized, and its consumption remains marginal within the broader structure of aquatic product consumption. Therefore, how to leverage the unique advantages of shellfish to promote sustainable development while contributing to global food security and dietary nutrition is a critical issue that requires urgent attention.
Although the drivers of seafood consumption have been extensively explored in existing studies, research specific to shellfish consumption remains limited, particularly regarding the regional and national variations in shellfish consumption patterns. Given this, the aim of this study is to conduct a comparative analysis of apparent shellfish consumption in major producing countries, employing empirical research with a two-way fixed effects model. The study will investigate the mechanisms through which factors such as economic development, trade openness, demographic structures, and climate change influence shellfish consumption. Using major global shellfish-consuming countries as a sample, this study will explore the global and regional differences in shellfish consumption patterns, and propose policy recommendations for optimizing the shellfish industry within the context of global consumption structure upgrades and sustainable development. .
2. Research Methodology and Data Description
2.1. Variables and Research Hypotheses
From an industrial impact perspective, this study selects the top ten global shellfish-producing countries in 2022, using production volume as an indicator. The study examines the changes in overall shellfish consumption at the national level and conducts an empirical analysis on the factors influencing consumption in eight countries with relatively complete data. To more accurately reflect the shellfish consumption capacity and future potential of these countries, the study refers to the FAO Food and Nutrition Balance Sheets ,as well as the research by Li Xue et al. (2024)18 and Sun Xiuhui et al (2025),19 using per capita apparent consumption as the key indicator to compare and analyze the differences and changes in shellfish consumption across countries, which is then used as the dependent variable in the empirical study.
Based on consumer theory and demand elasticity theory, key variables such as household consumption capacity, consumption structure, and the shellfish substitute index are considered. Taking into account economic, social, consumer behavior, and environmental factors, this study integrates international trade theory, the life cycle hypothesis, and the Environmental Kuznets Curve theory, with reference to the works of Gao et al. (2013)20 and Xiang & Zhong (2013),21 to include fisheries trade openness, population aging, and climate change as control variables in the analysis to ensure the robustness of the model results. (Shi et al., 2015; Huo et al., 2021; Ivanovich et al., 2022; Bianchi et al., 2022).22–25
Based on existing literature and theoretical analysis, the following research hypotheses are proposed:
(1) Impact of Economic Development
Economic development level is a concentrated reflection of consumption capacity. Relevant studies generally align with economic theory, suggesting that economic development is conducive to increasing consumption, including shellfish consumption. (Cai et al., 2018).26 This study uses per capita GDP as a proxy for economic development level. Additionally, considering that the conversion of consumption capacity into food expenditure is often constrained by the share of food expenditure in total consumption, this can be assessed through the Engel coefficient, an important indicator of household income levels and consumption structure. Theoretically, as economic development progresses, residents’ incomes increase, consumption levels rise, and the proportion of food expenditure in total consumption decreases, driving increased demand for higher-nutrient, higher-quality, and more diversified foods, such as shellfish.
Based on this, Hypothesis 1 and Hypothesis 2 are proposed:
Hypothesis 1: There is a positive correlation between per capita GDP and shellfish consumption.
Hypothesis 2: There is a negative correlation between the Engel coefficient and shellfish consumption.
(2) Impact of Substitutes
According to consumption theory, the price and quality of substitutes (in this study, other aquatic products excluding shellfish) can reduce shellfish consumption through substitution, price competition, and other factors. This study uses the shellfish substitute index as a proxy variable, specifically the ratio of non-shellfish aquatic product output to shellfish output, which reflects the level of competition between shellfish and other aquatic products. The higher the shellfish substitute index, the greater the competition pressure on shellfish in the market, which is unfavorable for shellfish consumption.
Based on this, Hypothesis 3 is proposed
Hypothesis 3: There is a negative correlation between the shellfish substitute index and shellfish consumption.
2.2. Model Specification
The following regression model is used to empirically analyze the determinants of per capita apparent shellfish consumption across countries. The general model equation is:
SCCit= β0+β1GDPit+β2Engelit+β3SSEit+δ1Tradeit+δ2Ageit+δ3Gasit+γit+λit+εit
Where:
- :represents the per capita apparent consumption of shellfish in country 𝑖 at time 𝑡, which is calculated as shown in formula (2):
SCC=Ishellfish−Eshellfish+Pshellfishpop
Here,, and refer to the import, export, and production volumes of shellfish, respectively; represents the per capita apparent consumption, and represents the population of the corresponding country or region.
- :denotes the per capita GDP of country 𝑖 at time 𝑡;
is Engel’s coefficient for country 𝑖 at time 𝑡, which is calculated as shown in formula (3)
Engel=E food E total
Where,refers to the total expenditure on food, and refers to the total consumption expenditure.
- :represents the shellfish substitute index for country 𝑖 at time 𝑡, calculated as shown in formula (4):
SSE=Pnon−shellfishPshellfish
Where $P_{non - shellfish}\ $ refers to the production volume of non−shellfish aquatic products, and refers to the production volume of shellfish;
- :represents the fisheries trade openness for country i at time 𝑡, calculated as shown in formula (5):
Trade=TwaterPwater
Where refers to the trade volume of aquatic products, and refers to the production volume of aquatic products.
-
represents the degree of population aging for country 𝑖 at time 𝑡;
-
refers to the greenhouse gas emissions of country 𝑖 at time 𝑡;
-
represent the coefficients of the core explanatory variables, indicating the marginal effect of each independent variable on shellfish consumption. A positive value indicates a positive influence, while a negative value indicates a negative influence;
-
represent the coefficients of the control variables;
-
represents the country fixed effect, which controls for country-level invariant factors;
-
represents the time fixed effect, controlling for global time trends;
-
is the error term, representing the unexplained part of the model and reflecting other factors that may influence shellfish consumption.
The regression model includes year dummy variables, and the overall model is significant. However, as the coefficients of the year dummy variables have minimal impact on the conclusions of this study, their specific coefficients are not displayed in detail.
2.3. Data Description
Considering data availability, this study selects the period from 1976 to 2022 (a total of 47 years) as the timeframe for estimating per capita apparent shellfish consumption. The empirical analysis includes panel data from eight countries: China, Japan, the United States, South Korea, Spain, France, Canada, and New Zealand, with a total sample size of 376 observations.
Data on fishery and shellfish production, as well as import and export trade, were obtained from the Food and Agriculture Organization (FAO) Fisheries Statistics Software FishstatJ.27 The shellfish production category includes species such as abalones, mussels, snails, clams, oysters, and cockles—bivalve mollusks in general. The data cover both aquaculture and capture production methods. Shellfish product processing types include live, fresh, chilled, smoked, salted, and dried forms. Population data, per capita GDP, and aging indicators for each country were sourced from the World Bank Group.28–30 Greenhouse gas emissions data were retrieved from Our World in Data.31 The raw data required for calculating the Engel coefficient for each country were sourced from national statistical offices, specifically household or residential consumption expenditure data.
Given the differences in consumption expenditure reporting standards across countries, as well as the significant variations in the dimensionality of the variables, logarithmic transformations were applied to all non-index variables, and all variables were standardized prior to the empirical analysis. This ensured the practical relevance of the model and achieved comparability across different indicators. To handle missing values in the panel data, both forward and backward interpolation methods were employed. Specifically, forward interpolation was first applied, followed by backward interpolation to fill in any remaining missing values. This approach ensured both the smoothness and consistency of the data, while minimizing the impact of missing values on subsequent analyses. It is important to note that missing data was primarily concentrated in the Engel’s coefficient data for Spain, Japan, New Zealand, and Canada prior to the 21st century.
3. Results and discussion
3.1. Global Shellfish Consumption Status
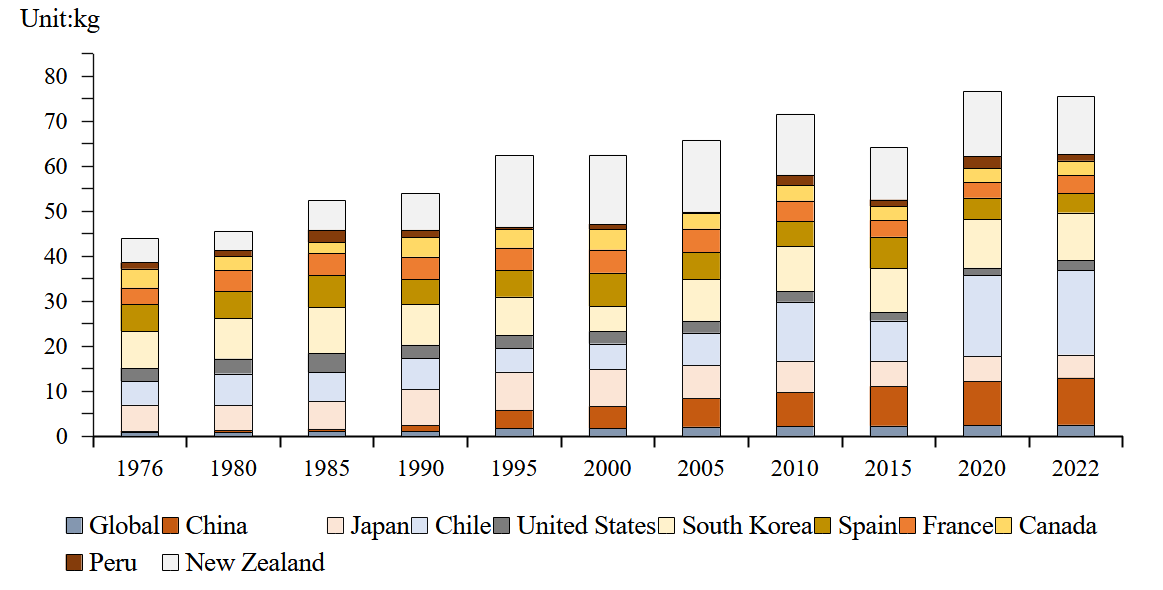
Between 1976 and 2022, global per capita apparent shellfish consumption showed a continuous upward trend, rising from 0.74 kg per person to 2.40 kg per person, with an average annual compound growth rate of 2.53% (see Figure 1). Countries such as Chile, New Zealand, and South Korea exhibited significantly higher per capita consumption levels than the global average, reaching 18.75 kg per person, 12.84 kg per person, and 10.59 kg per person, respectively, in 2022. This phenomenon is closely tied to these countries’ well-established consumption habits and the widespread availability of shellfish in their markets (Lopez et al., 2008).32 For instance, New Zealand has a long-standing shellfish industry with a well-developed supply chain. The industry heavily relies on sustainable development models, leveraging advanced mechanized farming techniques and stringent marine environmental protection policies. As a result, New Zealand’s shellfish products are known for their high quality and are highly sought after in international markets.
From a global supply perspective, the total production of fisheries and aquaculture reached 223 million tons in 2022, with Asian countries contributing over 70% of the total (FAO, 2024).33 China, as a central driver of this growth, is not only the largest producer but also the fastest-growing consumer. Between 1976 and 2022, its per capita consumption rose from 0.30 kg to 10.52 kg, with an annual compound growth rate of 7.9%. This remarkable leap is primarily attributed to breakthroughs in aquaculture techniques and seedling breeding technologies.
In contrast, traditional consumer countries like Japan, the United States, and Spain have experienced a long-term decline in per capita shellfish consumption. This trend can largely be attributed to factors such as the neglect of local species protection, water pollution, illegal fishing, and unfavorable economic conditions (MacKenzie, 2007; German et al., 2015; White, Ruesink, & Trimble, 2009).34–36 For example, Japan’s per capita shellfish consumption peaked at 7.99 kg in 1990, but declined to 5.11 kg by 2022, a reduction of 36.3%. This decline is mainly due to overfishing, which led to the depletion of marine resources (Kyuji et al., 2005),37 the aging population shrinking the consumer base (Ohtake et al., 1998),38 and environmental crises such as the 2011 Fukushima nuclear disaster, which triggered a trust crisis in seafood consumption (International Atomic Energy Agency et al., 2011).39

3.2. Cross-Country Indicator Analysis
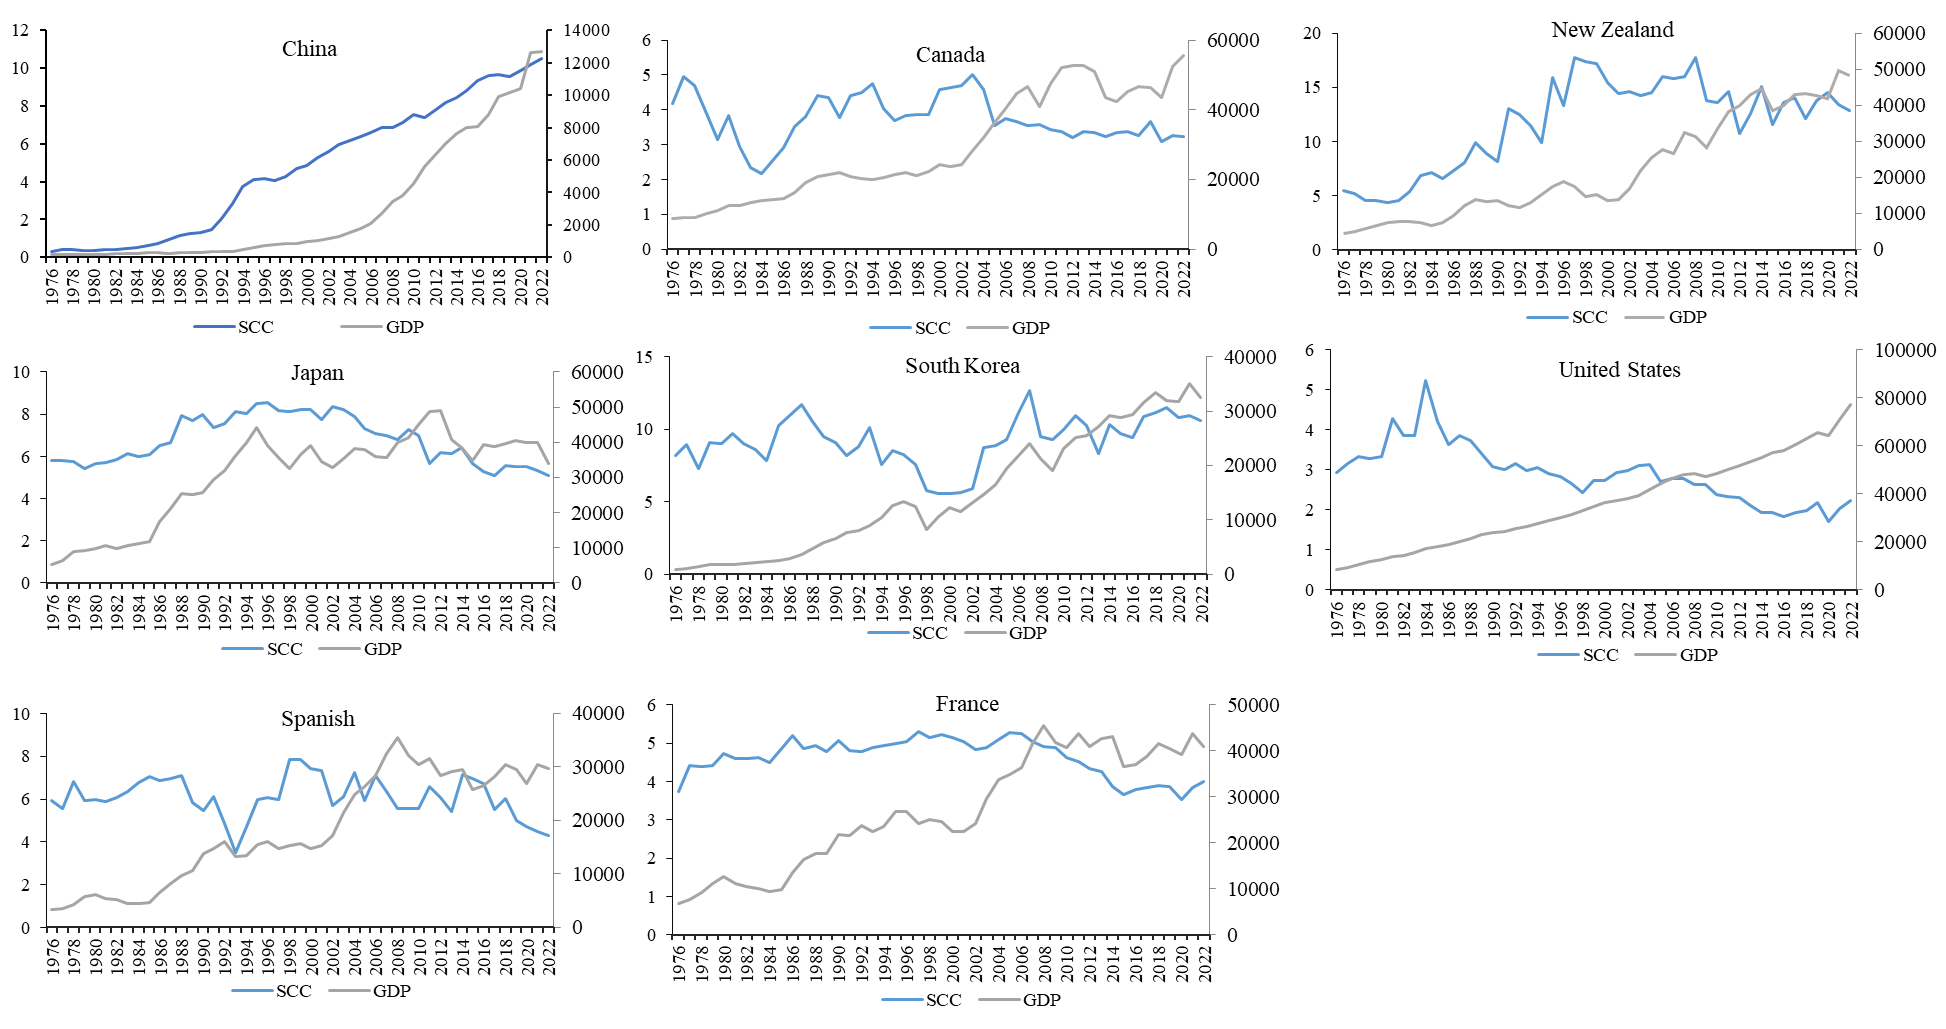
(1) As shown in Figure 2, per capita GDP and apparent shellfish consumption exhibit generally similar trends across countries. However, in several developed economies—such as France, the United States, and Japan and Canada after the year 2000—an inverse trend emerges, with GDP increasing while shellfish consumption declines.

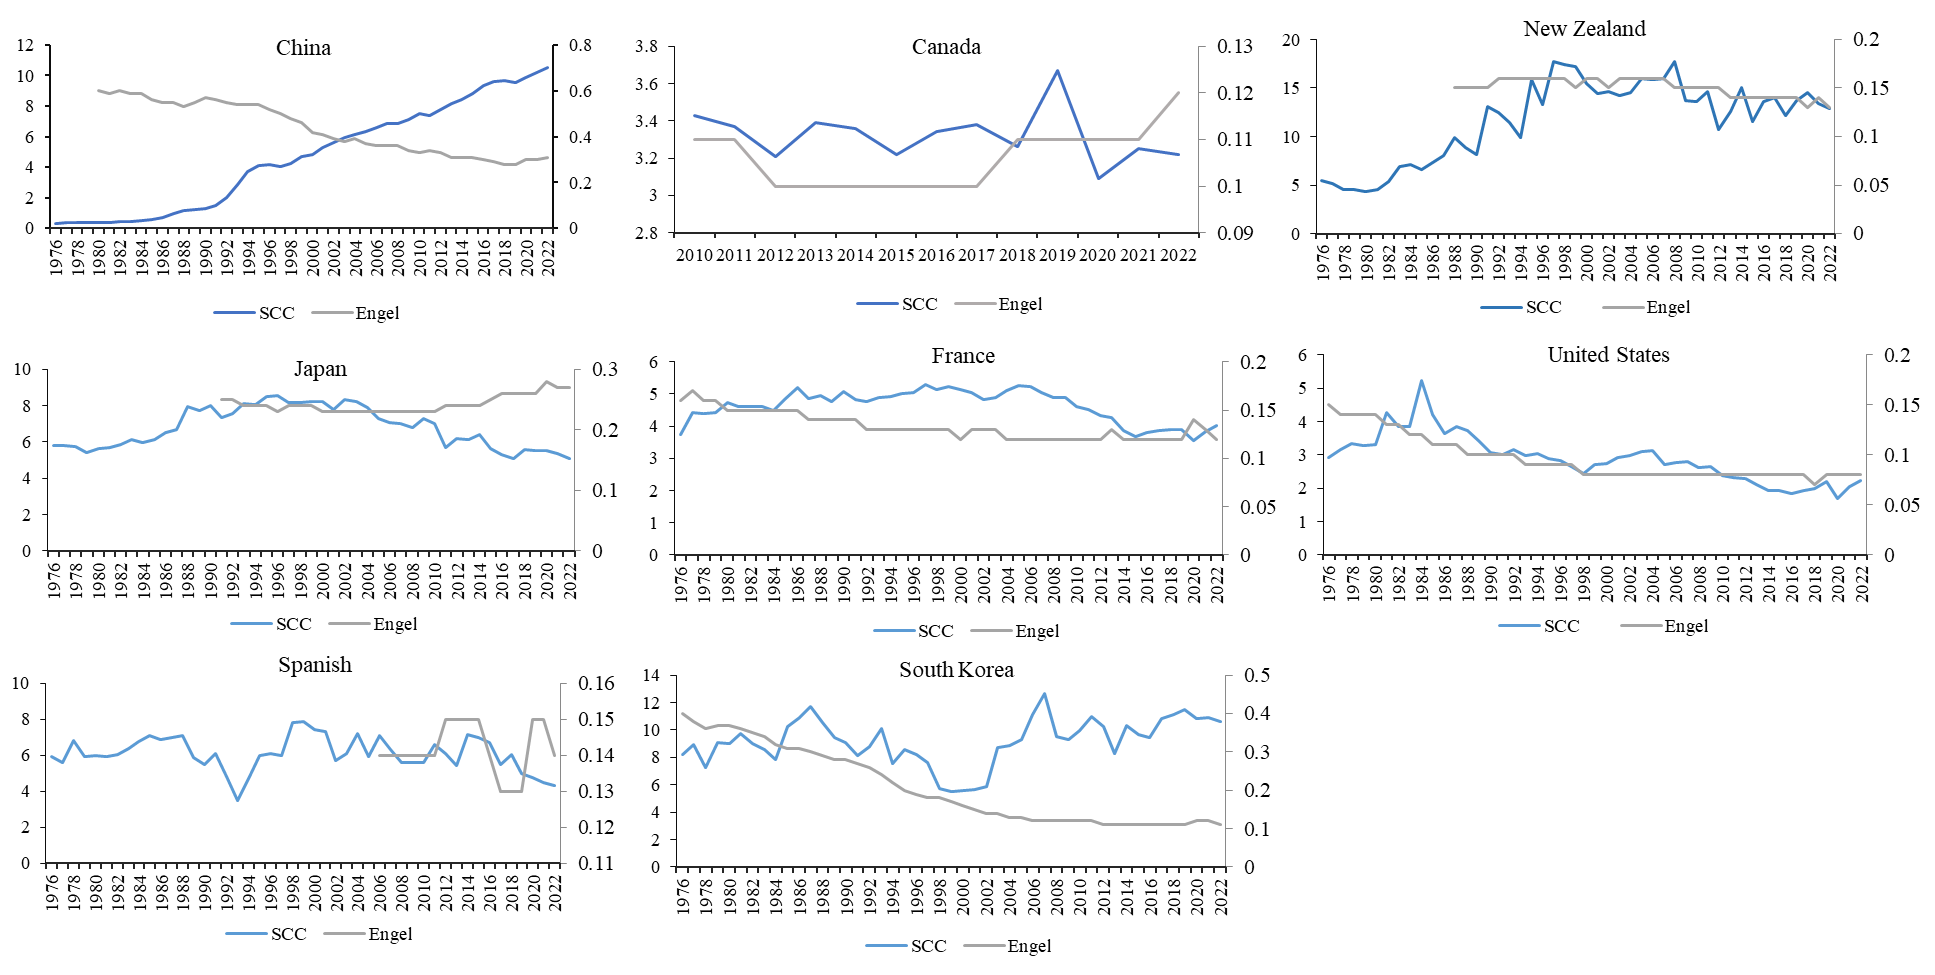
(2) In Figure 3, the relationship between the Engel coefficient and shellfish consumption trends varies notably across countries. In China, Japan, and South Korea, the two indicators tend to move in opposite directions. In contrast, this inverse pattern is less evident in countries such as the United States and France.

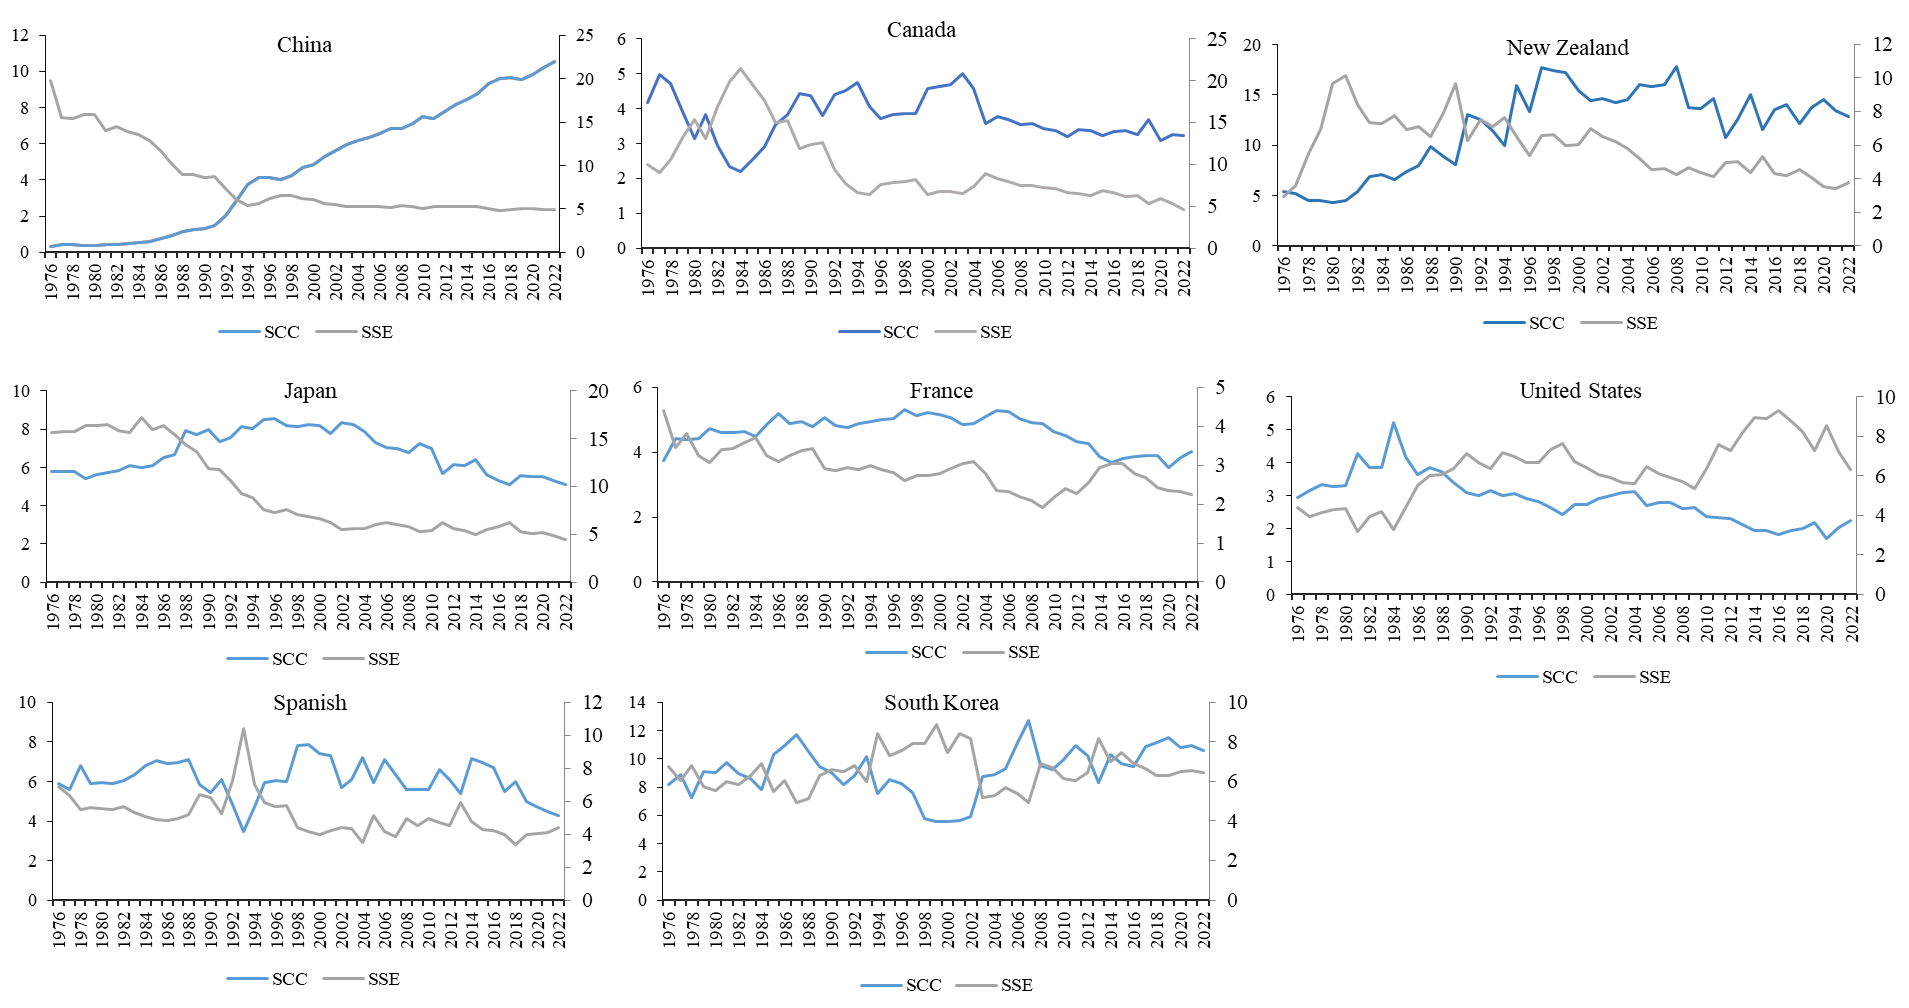
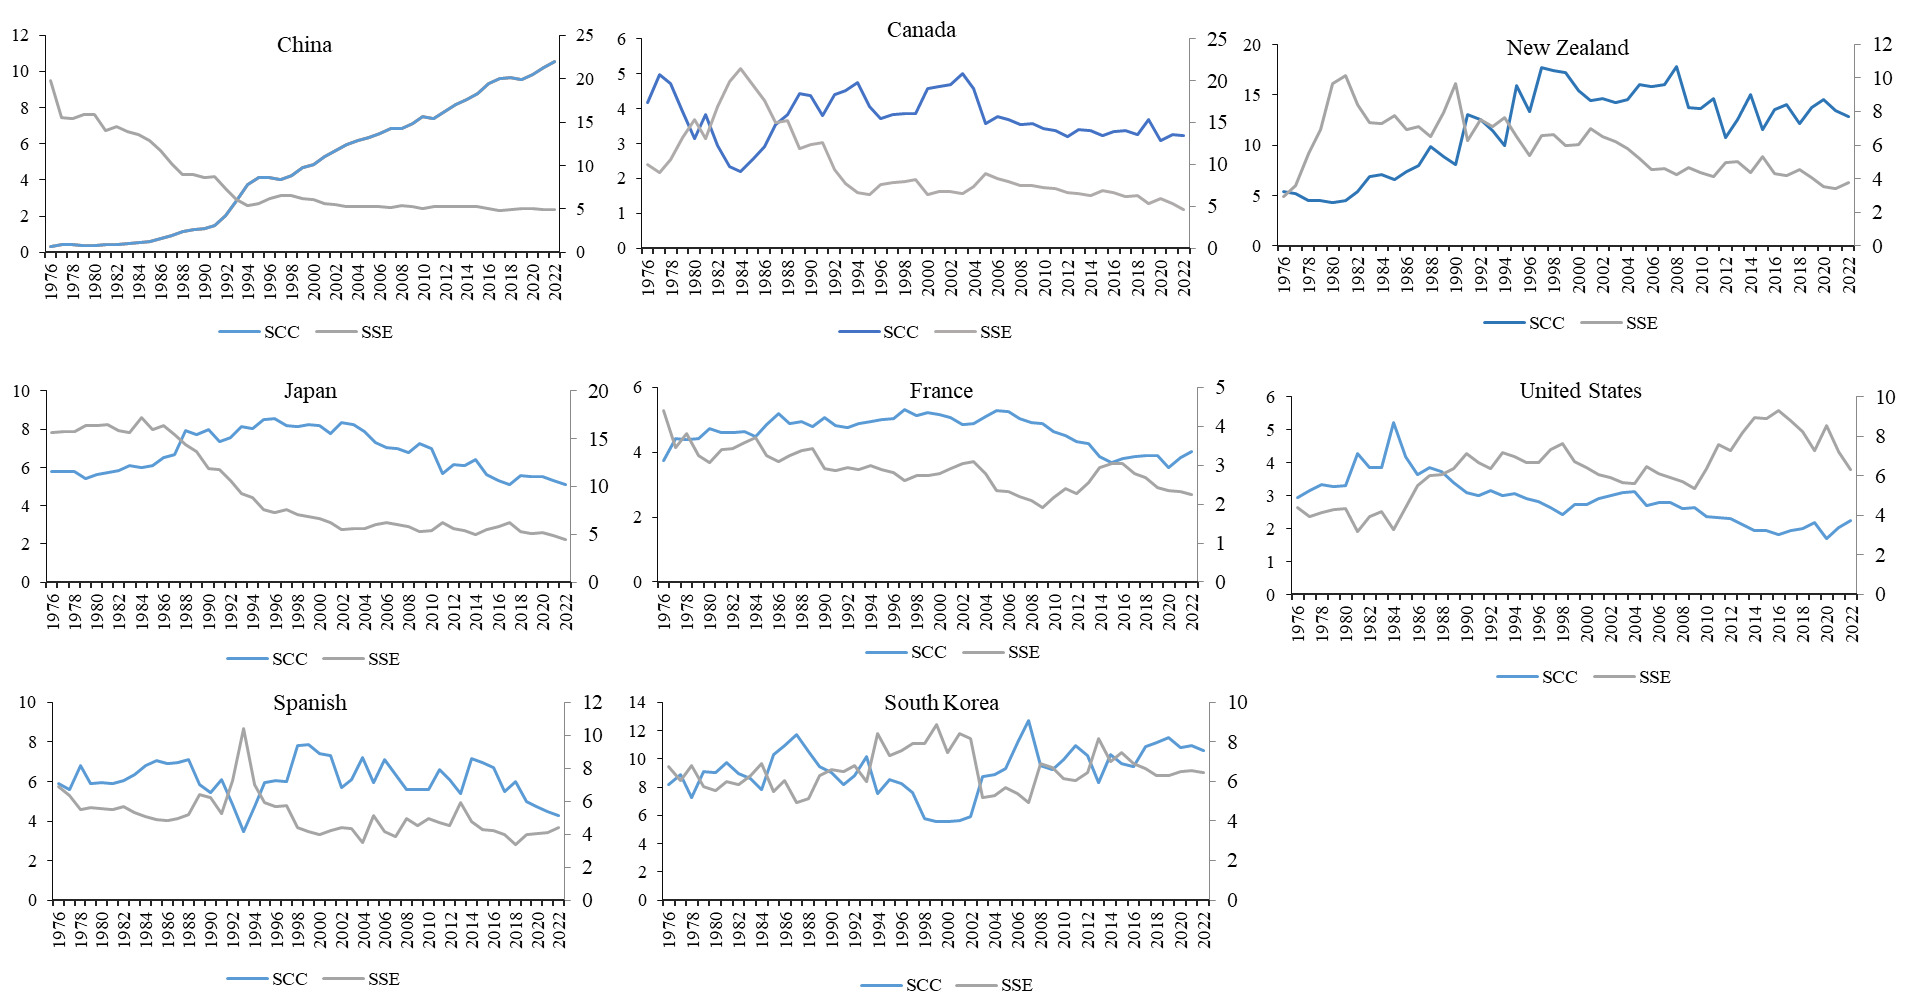
(3) The shellfish substitute index generally shows an inverse correlation with shellfish consumption across countries, as illustrated in Figure 4. Although some relationships are more complex, the overall pattern suggests that an increase in substitute availability tends to suppress shellfish consumption.
(4) As shown in Figure 5, trade openness initially exhibited a consistent upward trend across most countries, positively associated with shellfish consumption. However, in later periods—for example, in the U.S. after entering the 21st century—an opposite trend emerges, where trade openness increases while shellfish consumption declines.

(5) The aging population and shellfish consumption both show rising trends during the early stages of development, but diverge in later periods, as shown in Figure 6.

(6) In Figure 7, greenhouse gas emissions and shellfish consumption appear to move in parallel overall, indicating a generally positive correlation.

Overall, the preliminary analysis suggests that the relationships between shellfish consumption and the examined variables are neither universally positive nor negative. Factors such as per capita GDP and the Engel coefficient exhibit varying effects across different countries and stages of development. Therefore, the subsequent empirical analysis will incorporate regional heterogeneity and period-specific characteristics to further investigate these dynamic relationships.
3.3. Empirical Results
This study uses panel data from eight major shellfish-producing countries over the period 1976–2022 to estimate both the random effects (RE) and fixed effects (FE) model specifications of equation (4). During the model specification and estimation process, a Hausman test was conducted on the panel data regression results for both the RE and FE models presented in Table 2. The test statistic was 7.85, and the null hypothesis was rejected at the 10% significance level. This indicates that the random effects model is not appropriate, and the fixed effects model should be used.
The FE model results show that the model is statistically significant overall. The results confirm Hypotheses 1, 2, and 3, which suggest that per capita GDP in each country has a significant positive impact on shellfish consumption, while the Engel coefficient and the shellfish substitute index both exert significant negative effects on shellfish consumption. Furthermore, the FE2 model results reveal that, among the control variables, fishery trade openness and the aging population exhibit significant negative effects on shellfish consumption, while greenhouse gas emissions show a significant positive effect.
Subsequently, based on the FE2 model, a robustness check was conducted using subsample regression. To verify the reliability of the main conclusions, a phased regression analysis was performed with the year 2000 as the cutoff point (Li, 2005),40 in order to examine whether the shellfish consumption patterns exhibit structural changes across different stages of economic development. The robustness results (see Table 3) show that the effects of per capita GDP, shellfish substitute index, and fishery trade openness on shellfish consumption remained consistent in both the 1976-1999 (W1) and 2000-2022 (W2) periods. Specifically, the shellfish substitute index remained significantly positive at the 1% level, per capita GDP showed varying levels of significance across the two periods, and the Engel coefficient displayed a change in sign between W1 and W2. Among the control variables, fishery trade openness and greenhouse gas emissions consistently exhibited significant negative effects, while the impact of aging showed a positive effect in the W2 period.
The eight major shellfish-producing countries were categorized into two regions: Europe and America (AMEUR) and the Asia-Pacific region (APAC), to conduct a heterogeneity analysis. This analysis aimed to explore whether the fixed effects (FE) model reveals different mechanisms across regions. The results of the heterogeneity analysis (see Table 4) show that the directions of impact for the Engel coefficient and the shellfish substitute index on shellfish consumption remain consistent with the FE model results across both regions. However, per capita GDP and the three control variables exhibited differing effects in the AMEUR region compared to the APAC region.
3.4. Results Analysis
The empirical results show that the directions of the core explanatory variables’ effects are generally consistent with the theoretical expectations presented in Table 1. However, the strength and developmental paths of these effects were influenced by the dual moderating factors of economic development stages and regional heterogeneity. Further analysis reveals significant spatiotemporal heterogeneity in the parameter estimates of control variables, with their economic implications effectively aligning with regional development practices. This study provides a systematic examination of the mechanisms behind these observed phenomena.
Economic Development Level Has a Significant Positive Effect on Per Capita Shellfish Consumption. The impact of economic development primarily manifests in the form of diminishing income elasticity and market saturation. The relationship between per capita GDP and shellfish consumption was nonlinear. In the early stages of economic development, shellfish consumption exhibits strong income elasticity, consistent with Bennett’s Law (Bennett, 1941).41 However, the robustness test results show that as global economic development enters a new phase, food consumption structures become more diversified, and the marginal growth of shellfish consumption slows down, consistent with the Kuznets consumption curve theory (Kuznets, 1955)42 (Dey et al., 2008).43 This phenomenon indicates that in high-income stages, the growth of shellfish consumption stabilizes. Even with continued income growth, shellfish consumption no longer grows exponentially but is constrained by other substitute foods and health preferences. Analysis of the Engel coefficient further reveals how income structure impacts shellfish consumption, reflecting the characteristics of the Engel curve for aquatic products (Han et al., 2019).44 This is in line with Engel’s Law (Engel, 1857),45 which states that as income increases, the share of food expenditures decreases, allowing consumers to spend more on non-essential goods. Given that economic development positively influences shellfish consumption, it is essential for governments to foster policies that promote economic growth while simultaneously supporting sustainable aquaculture practices.
The Shellfish Substitute Index Has a Significant Negative Effect on Per Capita Shellfish Consumption. The shellfish substitute index negatively impacts shellfish consumption. As the production of other aquatic products increases, consumer preferences are more likely to shift, leading to a decrease in shellfish consumption. The market competition for shellfish primarily depends on price and supply stability. Especially when the supply of substitutes is abundant, the marginal growth of shellfish consumption is significantly affected. Compared to species like salmon and tilapia, shellfish have a lower degree of branding in the market. Additionally, in terms of cost, price, and convenience, shellfish still face challenges, especially in Asia and emerging markets where shellfish products are mainly sold in bulk or without brands. This weakens consumer loyalty to shellfish products and reduces market competitiveness. Policies that reduce trade barriers and encourage domestic shellfish production could help ensure that consumers have access to affordable, high-quality shellfish. For example, policies supporting the branding and marketing of shellfish products in developing countries could increase consumer loyalty and demand, particularly in Asia, where shellfish consumption is currently low.
Fishery Trade Openness Has a Significant Negative Effect on Per Capita Shellfish Consumption. Overall, the trade openness of fisheries has a significant negative effect on shellfish consumption, which is influenced by the competitive effects of imported aquatic products, price fluctuations, and consumer quality preferences. This negative impact is particularly pronounced in the Asia-Pacific region. As international markets open up, the import of low-priced farmed fish increases, encouraging consumers to choose cheaper and more readily available substitutes, thus intensifying the competition in the shellfish market. Furthermore, the aquatic products market is highly reliant on global supply chains, and fluctuations in international market prices may affect the relative price of domestic shellfish, thereby influencing consumption patterns. Studies have pointed out that developing countries often export high-quality marine products while importing lower-quality products (Asche et al., 2015),46 and this unequal exchange model may suppress the growth of shellfish consumption in developing countries in the Asia-Pacific region. In contrast, trade openness may stimulate the development of high-end shellfish markets in Europe and the U.S. For the shellfish industry, as trade openness and market competition are key factors, shellfish producers may benefit from developing niche markets and establishing brand loyalty to differentiate their products from other aquatic substitutes.
The Degree of Population Aging Has a Significant Negative Effect on Per Capita Shellfish Consumption. Population aging is another key finding in this study. The impact of population aging on shellfish consumption presents multiple effects and regional differences. According to the Life-Cycle Hypothesis, the consumption patterns of the elderly are influenced by savings tendencies, social security systems, and health factors, with aging having a bidirectional effect on consumption (Wang et al., 2022).47 In the Asia-Pacific region, due to the traditional family care model, the elderly often prioritize basic living expenses, reducing spending on non-essential or higher-priced foods. However, in recent years, the rise of the “silver economy” in the Asia-Pacific region and improvements in social security levels may alter the consumption patterns of the elderly, making them more willing to spend on high-value-added foods. In contrast, the social security systems in high-welfare countries in Europe and the U.S. can increase the disposable income of elderly populations, potentially promoting the consumption of high-quality foods (Börsch-Supan, 1992; Erlandsen & Nymoen, 2008).48,49 However, the consumption patterns of different shellfish products in Europe and the U.S. need further detailed analysis based on specific national systems. To tap into this demographic, the shellfish industry could tailor its product offerings to better meet the needs of older consumers, perhaps by developing easy-to-prepare, value-added shellfish products such as ready-to-eat meals or nutritionally fortified options.
Greenhouse Gas Emissions Have a Significant Positive Effect on Per Capita Shellfish Consumption. The effect of greenhouse gas emissions may be dual. On one hand, it is related to the level of economic development and promotes seafood consumption; on the other hand, it may affect aquaculture and fishing activities through pollution and resource depletion.
Globally, the increase in greenhouse gas emissions is typically accompanied by industrialization and urbanization processes. As the economy develops and residents’ income levels rise, food consumption upgrades, leading to increased demand for aquatic products, which promotes shellfish consumption. Additionally, the development of aquaculture in economically developed regions may further strengthen this relationship. According to the Environmental Kuznets Curve (EKC) theory, pollution may affect fishery resources in low-income stages, while in high-income stages, environmental protection measures and improvements in aquaculture technology may promote the supply and consumption of shellfish. The positive relationship between greenhouse gas emissions and shellfish consumption calls for environmental policies that align with sustainable aquaculture practices. Investments in low-carbon technologies and environmental protections for shellfish farming could help meet the growing demand for shellfish while also reducing the industry’s ecological footprint.
Due to limitations in the availability of data, other potential important influencing factors, such as consumer preferences, cultural habits, and policy interventions, were not included in the empirical analysis. Future research could further expand the sample range and adopt more detailed regional analyses to identify consumption differences across various economic levels and cultural contexts. Moreover, combining consumer behavior surveys and policy evaluations could provide a more comprehensive understanding of the driving factors behind shellfish consumption and market trends, thereby offering more precise support for industry development and policy formulation.
4. Conclusions
This study, based on national-level analysis, explores the key factors influencing shellfish consumption, shedding light on the mechanisms through which economic development, fisheries openness, shellfish substitutes, aging populations, and the greenhouse effect impact shellfish consumption. Overall, as the global economy changes and consumption structures adjust, the growth of shellfish consumption exhibits different dynamic characteristics.
Global shellfish consumption has shown a steady upward trend, with economic development and shifts in consumption patterns serving as positive drivers. However, as consumer demands become more diversified and the supply of other seafood products increases, the competition in the shellfish market intensifies. In developed countries, particularly in Europe and North America, the shellfish market faces a dual challenge of market saturation and socio-economic changes. On one hand, these regions generally grapple with widening social disparities. On the other hand, the segmentation of high-end markets offers growth opportunities for premium shellfish products, especially in the organic and sustainable food sectors.
To adapt to this trend, it is crucial to drive the shellfish industry toward organic and sustainable certifications. Additionally, technological innovation and improved production efficiency are essential. Research and development of low-carbon aquaculture technologies can help reduce costs, enhance resource use efficiency, and promote sustainable industry development. At the same time, it is necessary to strengthen the promotion of shellfish as part of a healthy diet, highlighting its nutritional value and environmental benefits.
In contrast, developing countries show enormous potential for shellfish consumption. As their economies progress to more advanced stages, some developing countries—such as China, a major player in the seafood trade—are expected to see sustained growth in market demand, particularly for high-quality shellfish. Given the imbalance between local supply capacity and demand in these countries, there may be an increased need to import premium shellfish to meet domestic consumption. However, constraints in areas such as supply chain management, food safety standards, and market access may hinder the full realization of this consumption potential. Governments should support the technological upgrading of the shellfish farming industry and promote efficient, environmentally friendly aquaculture models to boost output and improve supply chain efficiency, addressing supply shortages.
Additionally, collaboration with the industry is necessary to advance the branding of shellfish products and expand their promotion. Governments should also optimize import policies to foster a symbiotic relationship between imports and local production. Moreover, to ensure shellfish affordability in low-income regions, policies such as fisheries subsidies and technical support are needed to stabilize market supply, making shellfish more accessible as a source of protein for a wider population.
Global cooperation is key to the development of shellfish consumption and the industry. Trade agreements and supply chain integration in the global shellfish industry should be encouraged, fostering international collaboration and knowledge-sharing, particularly in aquaculture technologies, environmental protection, and resource management. Global climate policies should support low-carbon food consumption, encouraging shellfish farming to play a positive role in mitigating climate change and optimizing the allocation of global resources. Through tailored policy measures, countries can develop their shellfish industries, enhance shellfish consumption, ensure food security, promote nutritional balance, and contribute to achieving sustainable development goals.
Funding
This work was supported by the [Open Project Foundation from Key Laboratory of Freshwater Aquaculture Genetic and Breeding of Zhejiang Province, Zhejiang Institute of Freshwater Fisheries] under Grant [grant number ZJK202206]; and [China Agriculture Research System] under Grant [grant number CARS—49]; and [Key special project of Two Mountains Theory Research Institute of Huzhou University in 2022] under Grant [grant number LSZ2203]; and [Central Public-interest Scientific Institution Basal Research Fund, CAFS] under Grant [grant number 2023XT08 and 2022XT0804].
Authors’ Contributions
XS and ZL designed the research, analyzed the data, and wrote the manuscript. JL and LZ provided statistical analysis support. ZY and SX contributed to the discussion and revision of the manuscript. All authors read and approved the final manuscript.
Disclosure Statement
The authors have no relevant financial or non-financial interests to disclose.