


1. INTRODUCTION
The largemouth bass (Micropterus salmoides) has emerged as a globally significant species in freshwater aquaculture due to its robust adaptability, rapid growth rate (achieving market size within 6–10 months), resistance to diseases, absence of intermuscular bones, and desirable flesh texture.1,2 The sustainable development of the aquaculture industry hinges on the availability of stable, high-quality broodstock. In recent years, largemouth bass (M.salmoides) breeding has focused on selective breeding, hybridization, and sex-controlled breeding. However, prolonged selective breeding has reduced genetic diversity, degraded germplasm resources, and weakened growth rates and disease resistance in domestic improved populations.3,4 Hybridization studies have predominantly targeted crosses between the northern subspecies and Florida subspecies, while research on distant hybridization and heterosis utilization remains scarce.5,6 Thus, sex-controlled breeding has become a pivotal strategy in largemouth bass genetic improvement, highlighting the critical need for research into the regulation of gonadal development. Such research is essential for enhancing broodstock quality and facilitating monosex culture strategies.
Gonadal development in fish involves intricate gene regulatory networks, including master sex-determining genes, gonadal differentiation pathway genes, environmental response genes, and epigenetic regulatory mechanisms.7 Notable examples include DMY (a homolog of dmrt1), which initiates testis development in medaka (Oryzias latipes), and Foxl2, which promotes ovarian differentiation by directly activating cyp19a1a (aromatase), thereby facilitating the conversion of androgens to estrogens.8–10 In silver arowana, a W-chromosome-specific fragment spatially regulates foxl2 through three-dimensional genome architecture. The largemouth bass (M. salmoides) exhibits a female homogametic sex determination system and sexual dimorphism in growth patterns, with females exhibiting significantly faster growth than males before reaching one year of age.11 Although several studies have reported the identification of sex-determining regions and gonad-specific differentially expressed genes in largemouth bass (Micropterus salmoides), the precise mechanism underlying its sex determination remains unclear.
In eukaryotes, Alternative splicing serves as a key regulatory mechanism that drives functional diversification by generating structurally diverse mRNA isoforms from a single pre-mRNA transcript, thereby expanding proteome complexity without increasing gene count.12–14 Compared to the relatively slow evolution of sex-biased gene expression, sex-biased alternative splicing (AS) offers greater plasticity for the rapid evolution of dimorphic traits.15 A prominent example is the “bidirectional switch” mechanism involving alternative first exon (AFE) events in the KIAA1522 gene, which regulates stem cell fate decisions.16 AS also plays a role in multiple biological processes in largemouth bass, potentially contributing to temperature adaptation through dynamic regulation of splice variants such as atp2a1 isoforms IX1 and IX2 during heat stress.17–19 Yet, the regulatory role of AS during gonadal development in this species warrants further investigation.
ONT-based full-length transcriptome sequencing allows for direct sequencing of cDNA molecules without fragmentation, capturing complete transcript sequences from the 5’ end to the poly(A) tail. This approach enables precise characterization of transcript diversity and facilitates the identification of isoforms for genes,including AS, alternative polyadenylation (APA), and fusion genes—overcoming the limitations of short-read sequencing technologies in transcriptome assembly.20 Nanopore sequencing has been widely applied in plant (e.g., Arabidopsis, soybean), microbial (e.g., Ascosphaeraapis), and pathogen research for genome annotation, functional gene analysis, and disease surveillance.21–25
To investigate the molecular mechanisms of gonad differentiation in largemouth bass (M. salmoides) from the perspective of alternative splicing (AS), this study utilized ONT cDNA PCR sequencing to generate high-quality full-length transcriptomes from largemouth bass skeletal muscle, testis, and ovary tissues. These data support comprehensive analyses, including functional annotation of transcripts, prediction of alternative splicing events, identification of long non-coding RNAs (lncRNAs), and detection of transcription factors. Furthermore, comparative analyses of gene expression profiles and AS isoforms across muscle, testis, and ovary tissues were conducted. This research provides a valuable theoretical foundation and data resource for elucidating the molecular mechanisms underlying sex differentiation in largemouth bass.
2. MATERIALS AND METHODS
2.1. ANIMAL MATERIAL AND RNA SAMPLE PREPARATION
One-year-old sexually mature male and female largemouth bass (Micropterus salmoides) were collected from Huzhou, Zhejiang, China. Sex was confirmed through gonadal examination: males exhibited fully developed testes with active spermatogenesis, while females contained mature oocytes with visible yolk deposition in their ovaries. The selection criteria for sexual maturity combined age (1 year) and gonadal developmental status, consistent with species-specific physiological standards. Individuals were randomly chosen from a cultured population to minimize selection bias. Following euthanasia, muscle and gonadal tissues (testis or ovary) were immediately dissected from individuals of each sex. All tissue samples were snap-frozen in liquid nitrogen and stored at −80°C until RNA extraction. Total RNA was extracted using TRIzol reagent (Invitrogen, USA) according to the manufacturer’s instructions. To eliminate potential genomic DNA contamination, the extracted RNA was treated with DNase I (RNase-free, Thermo Fisher Scientific, USA). RNA integrity was assessed using 1% agarose gel electrophoresis, and quantification was performed using a NanoDrop 2000 spectrophotometer (Thermo Fisher Scientific, USA). Only high-quality RNA samples, meeting the criteria of A260/A280 ratios between 1.8 and 2.0 and displaying clear 28S/18S rRNA bands, were used for library construction.
Full-length cDNA libraries were constructed from these high-quality RNA samples using the cDNA-PCR Sequencing Kit V14 (SQK-PCS114, Oxford Nanopore Technologies, Oxford, UK) with 500 ng of total RNA as input. The prepared cDNA-PCR libraries were then loaded onto a PromethION Flow Cell (FLO-PRO114M) and sequenced on a Nanopore PromethION sequencer (Oxford Nanopore Technology, Oxford, UK). Basecalling was performed using Dorado v0.7 -sup (https://github.com/nanoporetech/dorado).
2.2. CDNA READS PREPROCESSING AND FULL-LENGTH TRANSCRIPT SELECTION
Oxford Nanopore Technologies (ONT) cDNA sequencing data were first processed using Pychopper v2.5.0 (https://github.com/nanoporetech/pychopper) with the parameters -Q 7 (minimum mean read quality) and -z 50 (minimum segment length) to identify and orient full-length cDNA reads. Pychopper classified reads into full-length, truncated, or non-cDNA reads based on adapter detection and provided corrected full-length sequences for downstream analysis.
2.3. GENOME ALIGNMENT
Full-length cDNA reads were aligned to the reference genome using Minimap2 v2.28 with parameters optimized for spliced alignment (-ax splice).26 Alignment results were output in BAM format for subsequent transcript model construction.
2.4. TRANSCRIPT MODEL CONSTRUCTION AND QUANTIFICATION
Aligned reads were processed with IsoQuant v3.7.0(https://github.com/ablab/IsoQuant) to reconstruct transcript models.27 IsoQuant corrected read alignments, performed clustering of isoforms, and generated transcript-level quantification (read counts and TPM). The resulting transcript annotation was output in GTF format.
2.5. TRANSCRIPT CLASSIFICATION
To assess transcript novelty, the IsoQuant-derived GTF file was analyzed using SQANTI3 v5.5.1(https://github.com/ConesaLab/SQANTI3).28 SQANTI3 classified each transcript as known or novel (e.g., NIC, NNC) by comparing it with the reference annotation and reported splice junction quality metrics.
2.6. FUNCTIONAL ANNOTATION OF NOVEL TRANSCRIPTS
Novel transcripts identified by SQANTI3 were annotated using EggNOG-mapper v2.1.12(http://eggnog-mapper.embl.de/).29,30 Protein sequences derived from IsoQuant-predicted coding sequences (CDS) were searched against the EggNOG database to assign Gene Ontology (GO) terms, KEGG pathways, and functional descriptions.Novel transcripts lacking coding sequences (CDS) in SQANTI3 results were annotated as long non-coding RNAs (lncRNAs) using CPC2 (v1.1), CPAT (v3.0.5), and PLEK2 (v2.0) tools with default parameters.
2.7. FUNCTIONAL ENRICHMENT ANALYSIS
GO and KEGG pathway enrichment analyses were performed using the clusterProfiler v4.0 R package.31–33Transcripts were translated and searched against the Danio rerio proteome (GRCz11) using BLASTx (E-value ≤ 1E-5, identity ≥ 60%, query cover ≥ 50%); the best-hit zebrafish Entrez ID was assigned to each query. EnrichGO() and enrichKEGG() were run with org. Dr.eg.db v3.16.0 (2023-03-27) and KEGG Release 107.0 (2023-08-17, organism dre), using the set of all detected transcripts that received a zebrafish ortholog as the background universe. P-values were adjusted by the Benjamini–Hochberg method; adjusted p < 0.05 was considered significant.
2.8. ALTERNATIVE SPLICING ANALYSIS
Alternative splicing (AS) events were quantified using SUPPA2 v2.4(https://github.com/comprna/SUPPA) based on the transcript models generated by IsoQuant.34 Isoform-level TPM values were used as input to compute percent spliced-in (PSI) values for each AS event, including exon skipping (SE), alternative 5′/3′ splice sites (A5/A3), mutually exclusive exons (MX), retained introns (RI), and alternative first/last exons (AF/AL).
3. RESULTS
3.1. OVERVIEW OF DATASETS
We performed long-read sequencing (Oxford Nanopore PCR-cDNA) on ovarian/testicular tissues and muscle tissues of female and male largemouth bass (Micropterus salmoides). Long-read sequencing generated 15.07–17.11 Gb of clean data per sample, with post-quality control reads exceeding 10 million sequences per dataset (N50: 1.5–1.8 kb).All cDNA sequencing datasets—including male and female muscle and gonadal tissues—have been deposited in the NCBI database under BioProject accession number PRJNA1303755. Full-length transcript sequences were aligned to the reference genome (ASM1485139v1) with alignment rates exceeding 99% across all tissues, yielding 10 million high-confidence transcripts for male tissues (testis and muscle) and 8 million for female ovarian tissue, thereby establishing a robust dataset for isoform-level analyses (Table 1).35
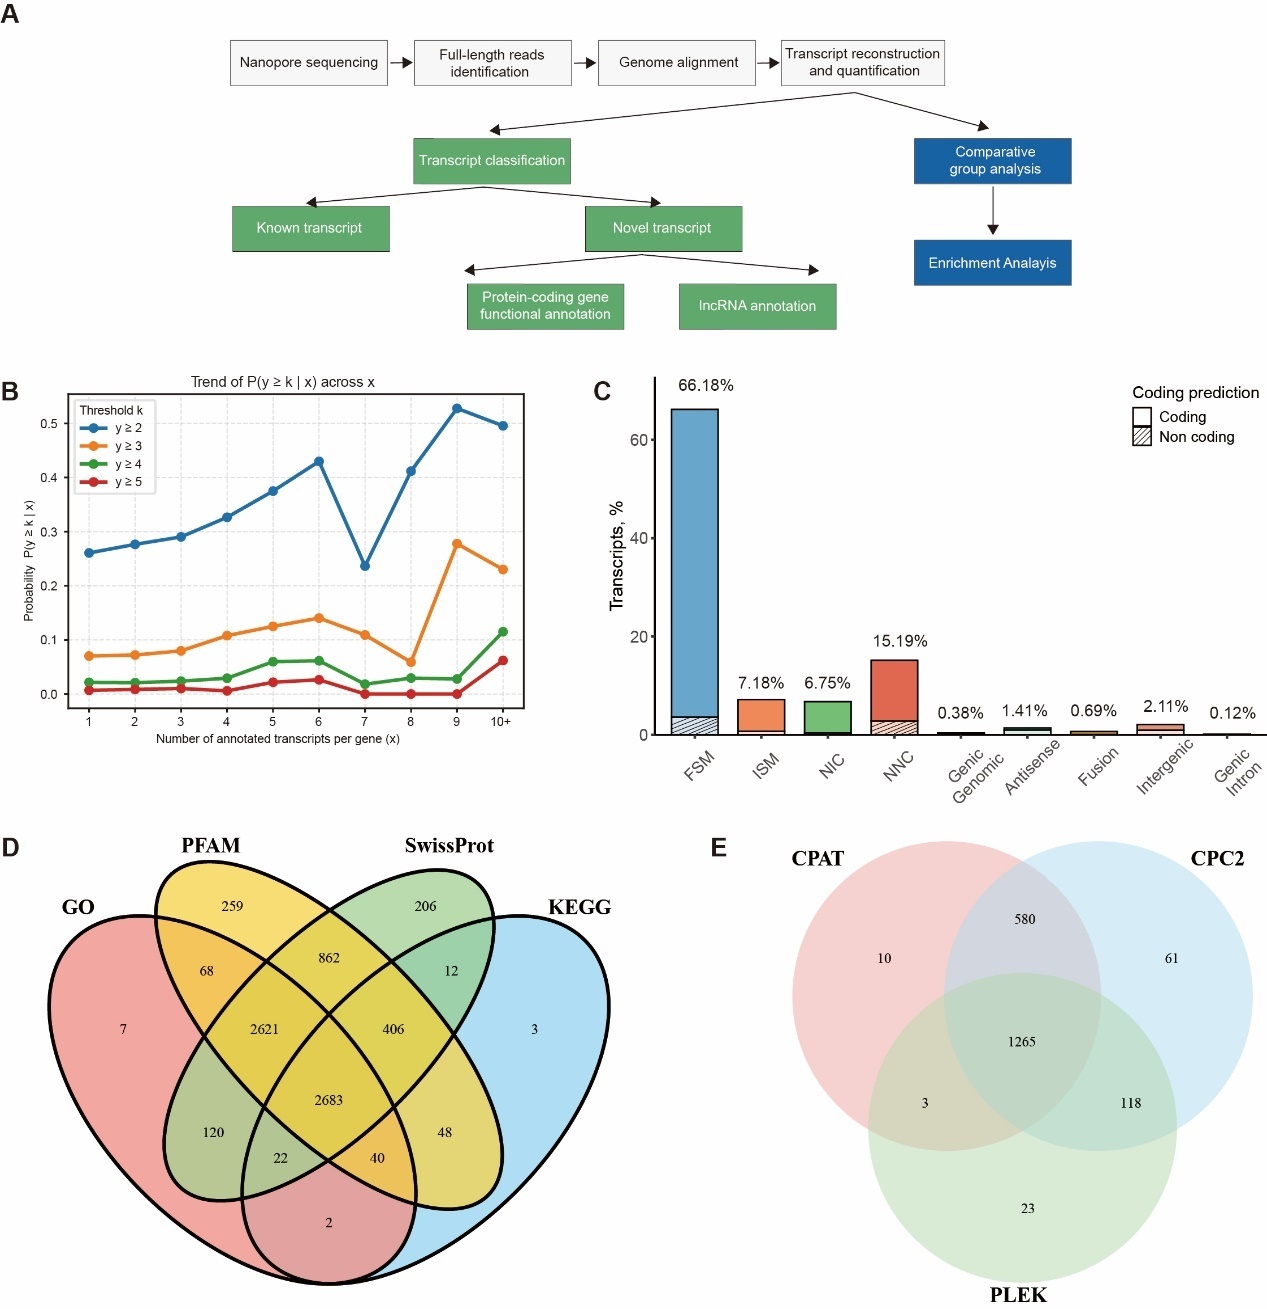
Following full-length sequence deduplication and clustering analysis, a total of 37,788 unique transcripts were obtained, corresponding to 22,273 unique genes, including 10,065 novel transcripts (Figure 1A). Using the same method, we evaluated the sequencing saturation by randomly sampling sequencing reads. The results showed that our datasets had basically reached the level of isoform saturation and could be used for transcript quantification analysis. In most cases, we quantified only one typically annotated transcript per gene, whereas genes harboring a large number of annotated transcripts were found to produce more novel isoforms (Figure 1B). Compared to other novel transcript categories, the Novel Not Coding (NNC) group exhibited a significantly higher proportion of non-coding transcripts, suggesting that NNC-classified transcripts are more likely to represent long non-coding RNAs (Figure 1C). This observation aligns with the genomic distribution patterns of long non-coding RNAs, which are typically located in intergenic regions, intronic regions, or on antisense strands.36 Novel transcripts were classified into two categories comprising protein-coding genes and long non-coding RNAs (lncRNAs), based on protein-coding potential prediction. Results demonstrated that among protein-coding transcripts, 92.03% (7,359/7,996) were annotated with at least one functional domain through the GO, KEGG, SwissPro or Pfam databases, with 93.55% (6,884/7,359) of these supported by at least two databases (Figure 1D). In contrast, for non-coding lncRNA predictions, 99.57% (2,060/2,069) of transcripts were identified as lncRNAs by at least one of the PLEK2, CPAT, or CPC2 tools, and 61.14% (1,265/2,069) exhibited consistent predictions across all three tools (Figure 1E).

3.2. COMPARISON OF TRANSCRIPT CATEGORY BETWEEN GONADAL TISSUES AND MUSCLE
By comparing the unique transcripts expressed in each individual sample, we distinguished gonad-shared and tissue-specific transcript expression. Among the four samples analyzed, the testis exhibited the highest transcriptional output with 33,269 expressed transcripts, followed by the ovary with 30,585 transcripts. In comparison with muscle tissue, the testis and ovary shared 3,986 transcripts, while the testis contained 1,258 unique transcripts and the ovary harbored 728 unique transcripts (Figure 2A).
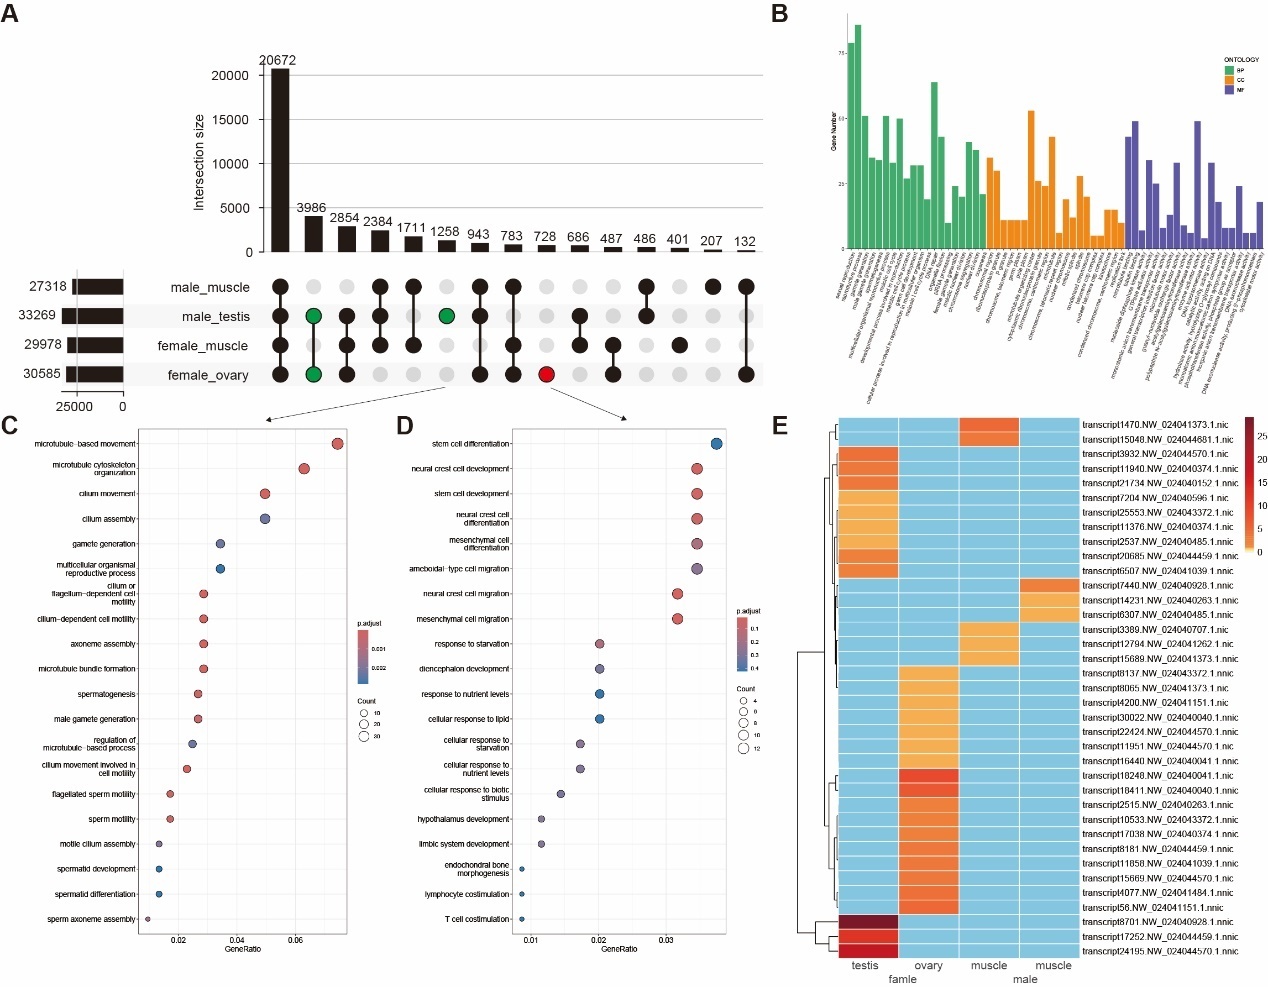
GO and KEGG enrichment analyses revealed significant functional divergence between gonadal (ovary/testis) and muscle-expressed transcripts. In the Biological Process (BP) category, the gonads were enriched in core reproductive pathways, including reproductive process (GO:0022414), sexual reproduction (GO:0019953), gamete generation (GO:0007276), and meiotic cell cycle (GO:0051321), which are central to germ cell development and meiosis. Cellular Component (CC) analysis highlighted gonadal-specific enrichment in chromosomal regions (GO:0098687), condensed chromosomes (GO:0000779), spindle structures (GO:0005819), and microtubule organization (GO:0005874), facilitating precise genetic material segregation. For Molecular Function (MF), differential expression in the gonads was characterized by elevated microtubule and tubulin binding activity (GO:0008017 and GO:0015631) and enzyme activator activity (GO:0008047), directly linked to cell division, morphogenesis , and high enzymatic reaction demands (Figure 2B). KEGG enrichment further identified significant gonadal enrichment in pathways including GnRH signaling (KO04912), TGF-beta signaling (ko04350), steroid hormone biosynthesis (ko00140), FoxO signaling (ko04068), steroid biosynthesis (ko00100), estrogen signaling (ko04915), Wnt signaling (ko04310), and MAPK signaling (KO04010) (Figure 2B).
Testis-specific transcripts were highly enriched in spermatogenesis (GO:0007283), male gamete generation (GO:0048232), and microtubule-based movement (GO:0007018), where structural components such as cilium (GO:0005929),sperm flagellum (GO:0036126), axoneme (GO:0005930), and sperm flagellum (GO:0036126) provide the mechanical basis for motility. The coordinated regulation of microtubule and tubulin binding activity (GO:0008017 and GO:0015631) and calcium ion sensor activity (GO:0061891) underpins the structural integrity and functional dynamics of sperm (Figure 2C). In contrast, although ovarian-specific transcripts exhibit moderate enrichment in fundamental reproductive processes such as meiotic nuclear division (GO:1903046), reproductive processes (GO:0019953), and Wnt signaling pathway (GO:0022414), their predominant functional roles converge on stem cell differentiation, neural crest cell development, and stress-response pathways (Figure 2D). At the cellular component level, these transcripts are predominantly localized to Golgi membranes, trans-Golgi networks, and apical plasma membranes, which underpin protein secretion and yolk deposition essential for oocyte maturation. Molecular function analyses highlight the synergistic coordination between active transmembrane transporter activities and signaling modules. This integration ensures nutrient acquisition and metabolic homeostasis for oocytes within hypoxic follicular fluid microenvironments.
We also identified 32 novel isoforms exhibiting exclusive tissue-specific expression, which belonged to two categories NIC (novel isoforms with a new combination of known splice sites) and NNC (novel isoforms containing at least one new splicing site). Notably, the number of novel isoforms uniquely expressed in gonadal tissues (testis/ovary) was significantly higher than those in muscle tissue, suggesting isoform diversity in reproductive systems (Figure 2E).
3.3. COMPARISON OF TRANSCRIPT EXPRESSION PATTERNS BETWEEN OVARY AND TESTIS
By directly comparing transcriptome expression differences between testes and ovaries, a total of 14,112 differentially expressed transcripts were identified. Among these, 7,398 genes were upregulated in testes relative to ovaries, and 6,714 genes were downregulated (Figure 3A). The background noise from ubiquitously expressed transcripts was further reduced by using respective muscle tissues as controls in multi-group comparisons, thereby narrowing the scope of differentially expressed genes. This refinement narrowed the analysis to 3,335 up-regulated (corresponding to 2,104 genes) and 3,329 down-regulated transcripts (corresponding to 1,963 genes), enabling a focused investigation of gonad-specific regulatory networks (Figures 3B,3C). To validate our findings, we cross-referenced our results with published studies focusing on differentially expressed genes (DEGs) in largemouth bass gonads. Genes that were documented in at least two independent studies exhibited consistent patterns of expression variation. Notably, all 17 gonad-related genes identified in Wang et al. research,37 with the exception of Ifng, showed expression trends that matched our data.

Gene Ontology (GO) enrichment analysis revealed that testis-specific genes cluster into four core biological processes. First, cilium and axoneme-related pathways, including cilium organization (GO:0044782), cilium assembly (GO:0060271), and axoneme assembly (GO:0035082), underpin sperm tail structural formation and function. Second, microtubule dynamics - associated functions (e.g., microtubule - based movement [GO:0007018] and microtubule cytoskeleton organization (GO:0000226) support sperm morphogenesis (e.g., head shaping, flagellar bending) and intracellular transport (e.g., intraflagellar transport). Third, reproductive and meiotic processes, such as male gamete generation (GO:0048232), spermatogenesis (GO:0007283), and meiotic cell cycle (GO:0051321), reflect the testis’ role in stem cell amplification, meiosis, and spermiogenesis. Fourth, DNA repair (GO:0006281) is enriched due to frequent recombination and replication stress during spermatogenesis, ensuring genetic stability (Figure 3D).
KEGG pathway analysis elucidated key molecular mechanisms with motor proteins (Ko:04184) driving flagellar movement, endocytosis (Ko:04144) facilitating sperm capacitation through membrane protein recycling, and the cell cycle pathway (Ko:04110) governing mitosis-meiosis transitions. DNA repair pathways including nucleotide excision repair (Ko:03420) and homologous recombination (Ko:03440) ensured efficient DNA damage response, while ATP-dependent chromatin remodeling (Ko:05202) mediated epigenetic reprogramming. Notably, nucleocytoplasmic transport (Ko:03013) coordinated stage-specific gene expression by regulating transcription factor nuclear localization (Figure 3E). In contrast to the testis, pathway enrichment analysis related to gonad development in the ovary did not reach statistical significance and could only be identified by lowering the significance threshold (Figure 3E).
3.4. CHARACTERIZATION OF AS EVENTS AND KEY GENES IN GONADAL TISSUES
Alternative splicing (AS) serves as a pivotal mechanism driving proteome diversification in eukaryotes, allowing organisms to maximize functional complexity through dynamic regulation of transcript isoforms. It has become apparent that alternative splicing has important physiological functions in different developmental processes.38Accumulating evidence demonstrates that AS orchestrates critical biological processes in teleosts, including immune responses, stress adaptation, and sexual differentiation.37,39–43 Compared to short-read sequencing, long-read sequencing demonstrates unparalleled advantages in resolving complex AS landscapes, owing to its ability to unambiguously capture full-length transcript isoforms.44 Long-read sequencing analysis of ovarian and testicular tissues enables the identification of AS events in genes governing sex determination and differentiation.
A total of 3,763 alternative splicing (AS) events were identified in the testis, with the dominant types being alternative first exons (AF) (28.17%) and skipping exon (SE) (26.76%), followed by alternative 3′splice sites (A3) (18.26%) and alternative 5′splice sites (A5) (17.94%). The ovary had 3,551 AS events, showing a highly similar AS type proportion pattern (AF 29.09%, SE 26.16%, A3 and A5 each 18.02%), while retained intron (RI) and mutually exclusive exons (MX) accounted for small proportions in both gonads. Overall, the proportion of each AS event type showed no obvious difference across all four tissues (testis, ovary, male muscle, female muscle), but the number of AS events in gonads was higher than in the corresponding muscle tissues. Notably, under the same sequencing data conditions, there was a significant difference in the number of AS events between female and male muscle tissues. Female muscle had 3,256 AS events, 13.5% more than the 2,886 AS events in male muscle, indicating inconsistent AS events between the two muscle types (Figure 4A). In testicular transcriptomic analysis, we identified 581 genes exhibiting multi-isoform expression, compared to 787 genes in ovarian tissues. The lower number in testis resulted from the exclusion of homologous gene interference and our stringent focus on differentially expressed transcripts. These isoforms were grouped into three expression categories based on intragenic trends, which included predominant upregulation or downregulation of a single isoform, balanced expression changes across all isoforms, and divergent trends among isoforms. The proportional distribution in testis was 39.6%, 49.1%, and 11.4%, while in the ovary, the corresponding values were 32.7%, 49.6%, and 17.8% (Figure 4B). Our data revealed that approximately half of the genes with multi-isoform expression in gonadal tissues exhibited either predominant upregulation or downregulation of a single isoform and divergent trends among isoforms.This suggests that alternative splicing may play a critical role in tissue-specific transcript studies.
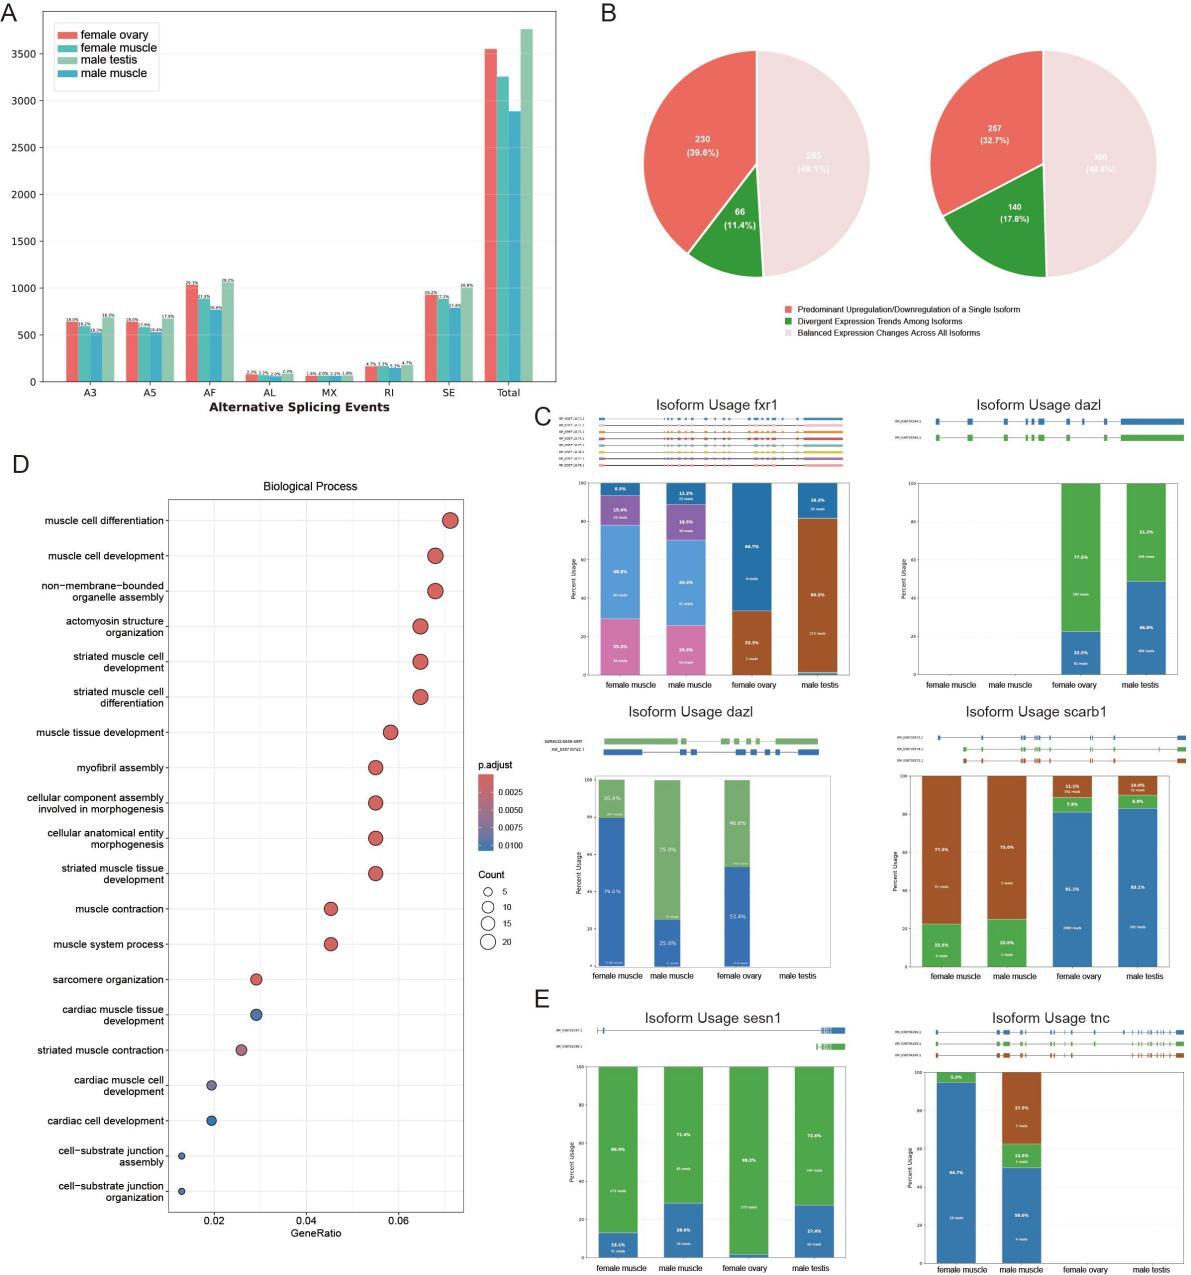
However, the enrichment analysis revealed limited pathway associations specific to gonadal development, suggesting that alternative splicing (AS) may represent a pan-tissue phenomenon. Among the biological processes (BP) investigated, fxr1 and dazl were specifically expressed and enriched in spermatogenesis (GO:0007283) and gamete generation (GO:0007276) in testicular tissues. In contrast, zp3d.2 and scarb1 exhibited specific enrichment in female gamete generation (GO:0007292) and sexual reproduction (GO:0019953) within ovarian tissues. The fxr1 gene spans 11,897 base pairs, contains 19 exons, and produces eight alternatively spliced isoforms. It exhibits gonad-biased expression, being absent in the ovary but detectable in the testis and muscle tissues, with testis-specific transcriptional dominance. Tissue-specific isoform divergence is observed among these tissues, as muscle shows balanced expression of four transcript variants while the testis displays predominant upregulation of a novel isoform. A similar splicing-dependent regulatory pattern is seen in the dazl gene. Additionally, an additional isoform of the zp3d, 2 gene was identified, and it is caused by retention of the first intron and a lengthened 3’UTR. Both isoforms are expressed in a balanced manner in the testis, whereas the ovary preferentially upregulates the intron-retained transcript. Parallel expansion of isoform diversity is also found in scarb1, as the gonads express a novel gonad-specific isoform that is absent in muscle, and this isoform shows ovarian-dominant expression (Figure 4C).
Analysis of muscle-specific differential transcripts revealed 733 significantly divergent transcripts corresponding to 413 genes. In Gene Ontology Biological Process (GOBP) enrichment analysis, differentially expressed genes showed strong enrichment in multiple muscle-related terms. As illustrated, key terms including muscle cell differentiation, muscle cell development, non-membrane-bounded organelle assembly, and actomyosin structure organization exhibited high gene-ratio values and low adjusted p-values, indicating statistically significant enrichment. Striated muscle-associated terms, such as striated muscle cell development and striated muscle cell differentiation, were also prominently enriched (Figure 4D). Comparative DEGs analysis revealed that among the 413 genes, only 32 were significantly downregulated, 89 upregulated considerably, while 291 showed non-significant expression differences. For instance, the sesn1 gene, previously reported in rainbow trout to demonstrate coordinated chromatin remodeling in upstream regulatory regions and transcriptional activation under cortisol-induced skeletal muscle stress, produces two alternatively spliced isoforms through exon 1/2 selection. Female muscle exhibited elevated expression of the exon 2-containing transcript, contrasting with male expression patterns. Similarly, the Troponin C (TnC) gene generates three distinct isoforms via exon 11/12 differential splicing. While all three isoforms were detectable in male muscle, female muscle displayed predominant expression of a single transcript. As a member of the EF-hand superfamily, TnC additionally mediates specialized antimicrobial and antiviral immune functions (Figure 4E). Collectively, these findings establish alternative splicing-driven transcript diversification as a central mechanism shaping sexual dimorphism in muscle development and functional adaptation.
4. DISCUSSION
A recent investigation employing identical long-read sequencing across 88 human tissues revealed over 70,000 previously unannotated transcript isoforms, which exhibit superior tissue-clustering resolution and enhanced specificity in capturing tissue-specific expression patterns.45 In this study, we employed ONT cDNA-PCR sequencing to generate high-quality full-length transcriptomes from largemouth bass (Micropterus salmoides) gonadal (testis and ovary) and muscle tissues, identifying 10,065 novel transcripts and a wealth of alternative splicing (AS) events. Similar to studies in Artemia, Eriocheir carinicauda, and Scylla paramamosain, which utilized single-molecule sequencing to identify sex-related genes and pathways, our ONT-based approach resolved intricate AS events and novel isoforms that short-read technologies would miss. This is particularly evident in the detection of tissue-specific novel isoforms (e.g., 32 exclusive to gonads), emphasizing the utility of long-read sequencing in elucidating post-transcriptional regulation during gonadal development. To reconcile experimental costs with data robustness, we prioritized sequencing depth over biological replicates to achieve transcriptome saturation, and cross-dataset validation confirmed the reliability of core expression trends. Currently, most long-read transcriptome studies adopt a similar approach. This strategy, however, conflates biological signals with individual-specific variations, necessitating methodological refinements. Future experimental designs should incorporate biological replicates from multiple individuals when feasible to isolate population-level patterns. Multi-omics verification, such as qRT-PCR validation or proteomic correlation analysis, strengthens confidence in candidate transcripts that are unaffected by individual variability. Integrating available data from public databases for comparative analysis provides context for distinguishing true biological effects from individual noise. The systematic inclusion of donor metadata (e.g., genetic background and physiological status) in analytical models further enables the quantification and adjustment of inter-individual confounding factors. Collectively, these measures will enhance the precision of transcriptome interpretation while maintaining fiscal pragmatism.
Comparative analysis with published bass gonad studies revealed conserved gene expression profiles and pathway enrichment patterns. Gonadal GO terms implicated core reproductive mechanisms, including reproductive process (GO:0022414), sexual reproduction (GO:0019953), gamete generation (GO:0007276), and meiotic cell cycle (GO:0051321). KEGG pathway analysis further confirmed significant enrichment in GnRH signaling (ko04912), TGF-β signaling (ko04350), steroid hormone biosynthesis (ko00140), FoxO signaling (ko04068), steroid biosynthesis (ko00100), estrogen signaling (ko04915), Wnt signaling (ko04310), and MAPK signaling (ko04010). Testicular tissues exhibited pronounced enrichment across spermatogenesis-related pathways, while ovarian samples showed moderate core reproductive pathway activation coupled with specialization in stem cell differentiation, stress response, ovarian steroidogenesis, protein digestion/absorption, and fatty acid elongation. To summarize, testis and ovary gene expression patterns exhibit pronounced functional divergence. The testis optimizes gene networks for efficient sperm production, encompassing structural formation, motility, and genetic stability, whereas the ovary prioritizes oocyte nutrient storage and maintenance of meiotic arrest. Comparative alternative splicing analysis across four biological samples revealed elevated splicing event frequencies in both ovarian and testicular tissues under isoform-proportion-aligned conditions, driving enhanced transcriptomic complexity through increased isoform diversification. The prevalence of sex-biased AS events in gonadal tissues, marked by 581 multi-isoform genes in testes and 787 in ovaries, underscores AS as a pivotal regulatory mechanism in sex differentiation.46 Notably, key developmental regulators include fxr1, dazl, zp3d.2, sp1, hsd17b1, scarb1, spaca4l, nrg2a,lipeb, and gpx4b exhibited both differential transcript usage (DTU) and differential transcript expression (DTE) between sexes, implying that their isoform diversity may orchestrate functional specialization in testes or ovaries. In zebrafish, fxrl expression is detected in the brain and testis, whereas studies in other fish species remain limited.47,48 The dazl gene has been reported to not only promote cystoblast divisions and meiotic entry but also play a critical role in germline stem cell establishment and fertility.49 The zp3d.2 gene is a tandem duplicate of zp3d. In fish gonads, the functional role of zp3 is primarily attributed to its encoded ZP3 protein, which plays critical roles in oocyte formation, fertilization processes, and oocyte maturation.50 The sp1 gene functions as a transcription factor broadly involved in transcriptional regulation. For instance, SP1 directly interacts with β-catenin in the Wnt signaling pathway, playing a critical role in signal transduction.51 A critical factor in ovarian differentiation is the Hsd17b1 gene, which encodes the enzyme Hsd17b1. This enzyme catalyzes the conversion of estrone to estradiol-17β—a key step in estrogen synthesis—and this process is essential for the development of female gonads and gonadal differentiation.52 The SCARB1 gene is associated with the ovarian steroidogenesis pathway. In zebrafish, loss of SCARB1 leads to reduced reproductive capacity, suggesting that SCARB1 may play a role in ovarian steroidogenesis.53 SPACA4l remains uncharacterized. Its homolog SPACA4, functionally analogous to the teleost fertilization factor Bouncer, acts as a critical sperm protein required for zona pellucida penetration during mammalian fertilization.54 NRG2a is a member of the I-set domain-containing protein family and the Neuregulin family, gene groups widely recognized for their roles in cellular signaling and growth regulation.55 The Lipea gene has been implicated in lipid storage through cavefish studies.56 The Wnt/β-catenin signaling pathway plays a critical role in axial patterning during embryogenesis and adult tissue homeostasis, with GPX4 functioning as an inhibitor of this pathway.57 No prior studies have investigated transcript isoforms of these genes. However, our results demonstrate highly significant differential transcript usage (DTU) and expression (DTE), strongly supporting their candidacy for further research on gonadal development and differentiation.
5. CONCLUSION
In this study, we employed Oxford Nanopore Technology to generate full-length transcriptomes from testis, ovary, and muscle tissue of salmon. We identified 37,788 unique transcripts corresponding to 22,273 genes, including 10,065 novel transcripts. A total of 3,763 and 3,551 alternative splicing (AS) events were detected in testis and ovary, respectively. Exon skipping (SE) and alternative first exon (AF) predominated as major AS types, with gonadal tissues exhibiting higher AS complexity than muscle, while female muscle samples showed elevated AS frequency compared to males. These events implicated 581 multi-isoform genes in the testis and 787 genes in the ovary. Key sex determination/differentiation genes, including testis-specific fxr1 and dazl, and ovary-specific zp3 and scarb1, demonstrated differential transcript usage (DTU) and differential expression (DTE). These genes generated isoforms harboring distinct functional domains and tissue-specific regulatory signatures. Furthermore, reproductive process genes (sp1, hsd17b1, spaca4l, nrg2a, lipeb, and gpx4b) displayed gonad-biased AS patterns. These findings underscore alternative splicing as a critical modulator of transcriptomic diversity during gonadal development and provide novel insights into post-transcriptional regulatory mechanisms underlying teleost sexual differentiation.
Acknowledgments
This work was financially supported by Basic Public Welfare Research Program of Zhejiang Province (LGN22C190024), Major Science and Technology Programs for Agriculture (Aquaculture) New Variety Selection of Zhejiang Province (2021C02069-2) and Zhejiang Provincial Financial Special Project (2025CZZX02).
Authors’ contribution
Investigation: Shili Liu (Equal), Qinghui Meng (Equal). Writing – original draft: Shili Liu (Lead). Formal Analysis: Shili Liu (Lead). Funding acquisition: Shili Liu (Lead). Methodology: Shun Cheng (Equal), Jianbo Zheng (Equal). Data curation: Wenping Jiang (Equal), Meili Chi (Equal). Validation: Chao Zhu (Lead). Writing – review & editing: Miao Peng (Equal), Fei Li (Equal). Conceptualization: Fei Li (Lead). Resources: Fei Li (Lead). Supervision: Fei Li (Lead). Visualization: Qinghui Meng (Lead). Project administration: Qinghui Meng (Lead).
Competing interest – COPE
No competing interests were disclosed.
Ethical Conduct Approval – IACUC
This study was approved by the Ethics Committee of Laboratory Animal Center of Zhejiang Institute of Freshwater Fisheries. The animal protocols were approved by the Institutional Animal Care and Use Committee (IACUC) of the Zhejiang Institute of Freshwater Fisheries. The animal study was reviewed and approved according to the guidelines of the Animal Experiment Committee, Zhejiang Institute of Freshwater Fishery (ZIFF20241006).
Informed Consent Statement
All authors and institutions have confirmed this manuscript for publication.
Data Availability Statement
All are available upon reasonable request.