Introduction
In 1985, China’s fisheries established a development strategy focused on “Aquaculture as the primary method,” leading to the rapid rise and leapfrogging development of the aquaculture industry.1 Today, aquaculture has become an important component of China’s agricultural sector, providing a solid foundation for national food security and serving as one of the key drivers of rural economic growth.2 Industrial clustering, as a typical phenomenon of industrial layout, is one of the trends in industrial development and evolution. It plays an increasingly crucial role in optimizing resource allocation efficiency, promoting local and national economic growth, and enhancing international competitiveness.3 China is a big aquaculture country, and the agglomeration of the aquaculture industry is becoming more and more obvious, which promotes the development of the aquaculture industry. Based on this, the “14th Five-Year National Fishery Development Plan” clearly proposes to promote the agglomeration of aquaculture industry as one of the main tasks, and points out that it is necessary to speed up the optimization and upgrading of industries, develop advantageous industrial agglomeration areas, and strengthen the aquaculture industry by creating aquatic advantageous industrial agglomeration areas, aquaculture demonstration areas, modern industrial parks and industrial strong towns. During the ‘14th Five-Year Plan’ period, the focus of the work on agriculture, rural areas, and farmers has shifted to comprehensively promoting rural revitalization, and the fishery has entered a critical stage of accelerating high-quality development and realizing modernization. Improving quality and efficiency is a key issue in the development of aquaculture. At the same time, the aquaculture industry is facing problems and challenges such as supply-side structural contradictions, resource and environmental constraints, and rising production costs.4 In this context, it is of great significance to study the agglomeration of China’s aquaculture industry, analyze its agglomeration level, change trend, and formation mechanism, so as to promote the sustainable development of China’s aquaculture industry.
Since the 1930s, the spatial distribution of agriculture has begun to exhibit significant geographic clustering characteristics, and by the 1980s, this phenomenon accelerated.5 With the rapid advancement of agricultural scale and specialization, the spatial pattern of agricultural development in China has continually evolved, gradually forming several distinct industrial clusters and block production areas.6 Most research findings indicate that there is an industrial clustering phenomenon in China’s agriculture, with significant differences in the clustering levels of various crops.7–9 Some scholars have also studied the phenomenon of aquaculture industry agglomeration and believe that there is industrial agglomeration in China’s aquaculture industry.10 In examining the mechanisms behind the formation of industrial clusters, scholars believe that agricultural industrial clustering relies on a variety of internal and external factors and is the result of their interactions. Agricultural clustering is mainly influenced by factors such as natural resource endowments,11,12 technological development levels,13,14 human capital,15,16 consumer demand,17,18 transportation costs for agricultural products,19,20 and the external environment.21,22
Through the combing of literature, the current research on the agglomeration of the aquaculture industry mainly focuses on the qualitative description of the agglomeration level and influencing factors of the aquaculture industry and lacks the theoretical discussion and quantitative analysis of the formation mechanism. At the same time, with the continuous development of the forward and backward industries of the aquaculture industry and the extension of the aquaculture industry chain, the industrial correlation degree also has an important impact on the aquaculture industry agglomeration, and plays an increasingly important role in the development of the aquaculture industry agglomeration, which has not been involved in the existing research. This study attempts to apply the general theory of industrial agglomeration to the aquaculture industry. Based on the relevant theories of industrial agglomeration, combined with the characteristics of the aquaculture industry, the industrial correlation degree is incorporated into the factors affecting the agglomeration of the aquaculture industry, and the theoretical model of the formation mechanism of the aquaculture industry agglomeration is constructed. The location entropy and Geodetector method are used to explore the agglomeration level and formation mechanism of China’s aquaculture industry. This has expanded the research perspective of industrial agglomeration to a certain extent, further enriched the research content of aquaculture industry agglomeration, and has a certain marginal contribution to the research of industrial agglomeration. Furthermore, this study enhances the understanding of spatial agglomeration patterns in China’s aquaculture industry. The findings provide valuable insights for policymakers to maximize agglomeration effects while maintaining stable total aquaculture production areas. Specifically, our results can help improve production efficiency, boost output growth, and ultimately promote sustainable development of the aquaculture sector.
Construction of Theoretical Model
Based on the basic theory of industrial agglomeration, previous research results on industrial agglomeration, and the particularity of the aquaculture industry, this paper constructs a theoretical model of the formation mechanism of aquaculture industry agglomeration, which provides a theoretical basis for subsequent empirical research.
The Formation Basis of Aquaculture Industry Agglomeration: Comparative Advantage
The Heckscher-Ohlin factor endowment theory posits that the unique resource endowments of different regions affect the cost of production factors, leading to variations in production costs between regions. This results in the formation of comparative advantages that incentivize industrial clustering.23 The aquaculture industry relies on local water resources, climate, and other natural resources and conditions. Initially, different aquaculture species can only be produced in their respective ecologically suitable areas.24 Therefore, the comparative advantage formed by the difference in fishery natural resource endowment between regions is an important factor and basic condition for the agglomeration and evolution of the aquaculture industry.
The Endogenous Driving Force of Aquaculture Industry Agglomeration: External Economy
In industrial clustering theory, external economies are considered the core driving force behind industrial clustering and are crucial factors when analyzing the phenomenon of industrial clustering. For those clustering phenomena that cannot be solely explained by natural resource endowments, the influence of externalities is often at play.7 Therefore, the external economy constitutes the endogenous driving force of aquaculture industry agglomeration. Externalities include technical externalities and financial externalities.
Technological Externality
Technological externalities refer to externalities arising from knowledge spillovers, technological spillovers, and human capital spillovers. The spillover of knowledge, technology, and human capital helps reduce business costs and increase production efficiency, thereby attracting the clustering of talent, capital, and enterprises.7 The factors contributing to technological externalities include human capital and the level of production technology: (1) Human Capital: As a vital carrier of knowledge and technology, the mobility of human capital increases the likelihood of knowledge spillovers, which helps reduce production costs and improve production efficiency.25 The aquaculture industry is a labor-intensive industry, and an ample supply of labor resources is a crucial condition for its development26; (2) Level of Production Technology: Given a certain level of technology, the clustering capacity of each region has an upper limit due to constraints such as resource availability.27 Advancements in aquaculture technology not only enhance the clustering capacity of a region but also create a more favorable environment for industrial clustering.
Financial Externality
Financial externality refers to the positive external effect of production activities, which establishes forward and backward linkages in space and improves production efficiency by optimizing material exchange among economic entities.28 It includes factors such as factor flow, local market demand, and forward and backward linkages of industries. These financial externalities are the key driving forces of industrial agglomeration and endogenous interaction.29 Urbanization and transportation are conducive to the flow of factors and are important financial externalities affecting industrial agglomeration.7 Therefore, the financial externality factors in this study include urbanization level, transportation cost, market demand, and industrial correlation. (1) Level of Urbanization: The process of urbanization enhances the per capita land resources and the commercialization rate of agricultural products in rural areas, prompting a transition from traditional small-scale operations to modernized practices. Urbanization essentially represents a stage of spatial clustering of factors and industries.7 With the rise of specialized aquaculture operators, cooperatives, and leading industrial enterprises, the aquaculture industry is undergoing deepened developments characterized by intensification, regionalization, specialization, and industrialization; (2) Transportation Costs: Krugman emphasizes in his new economic geography theory that transportation costs are a core factor determining industrial concentration.30 Most aquatic products are perishable and difficult to store, resulting in relatively high transportation costs, which further impacts the economic activities related to their spatial distribution; (3) Market Demand: Sufficient market demand provides developmental space for industrial clustering. An increase in market demand for aquatic products incentivizes aquaculture farmers or enterprises to expand their production scale, promoting the scaling and specialization of the aquaculture industry, thereby facilitating its clustering.31 (4) Industrial correlation: The upstream components of the aquaculture industry chain include seedlings, aquaculture feed, medications, and farming tools; the midstream comprises aquaculture activities, mainly involving the farming of fish, shrimp, crabs, shellfish, algae, and ornamental fish; the downstream consists of processing and distribution of aquatic products. In specific regions, the tighter the forward and backward linkages among clustered enterprises, the more significant the positive external effects generated, thereby attracting the clustering of more related industries.32
Exogenous Thrust of Aquaculture Industry Agglomeration: Institutional Policy Environment
In the theory of industrial agglomeration, institutions, policies, and other factors are regarded as exogenous variables that affect industrial agglomeration.33 Fair, reasonable and high-quality institutional policies provide a good development environment for promoting industrial agglomeration. The institutional policy environment is the exogenous thrust of aquaculture industry agglomeration.
This study specifically examines the impact of institutional and policy environment factors on aquaculture clustering from two aspects: the degree of government intervention and the level of openness to external markets. (1) Degree of Government Intervention: Fiscal policies such as subsidies, interest subsidies, and rewards are important tools for the government to guide industrial restructuring and optimize industrial layout. These fiscal and tax policies significantly influence industrial clustering30; (2) Level of Openness to External Markets: Foreign trade is a crucial factor affecting the industrial clustering of a country or region.24 Regions with a higher degree of openness to external markets tend to have closer trade relations with other countries, which helps expand the market for aquatic products. An increase in demand size can promote the scaling and specialization of the aquaculture industry, thereby fostering its clustering.7
In summary, the agglomeration of the aquaculture industry is the result of the joint action of comparative advantage, external economic and institutional policy environment. Comparative advantage is the formation basis of aquaculture industry agglomeration, external economy is the endogenous driving force of aquaculture industry agglomeration, and institutional policy environment is the exogenous thrust of aquaculture industry agglomeration. The comparative advantage formed by the spatial distribution difference of resource endowment is the basic condition for the agglomeration of the aquaculture industry. Technological externality and financial externality promote the further agglomeration of the aquaculture industry from within the industry. External environmental factors such as government intervention and opening up, play an important role in promoting industrial agglomeration.
Methods
Data Sources
The data used in this study is sourced from the “China Fisheries Statistical Yearbook” and the “China Statistical Yearbook” for the years 2007 to 2023. Some missing data have been supplemented using interpolation methods. Given the availability of data, the research focuses on 30 provinces, municipalities, and autonomous regions in China, excluding Tibet Autonomous Region, Hong Kong Special Administrative Region, Macao Special Administrative Region and Taiwan Province.
Research Methodology
Location Quotient (LQ)
The Location Quotient is an economic indicator used to measure the relative concentration of a particular economic activity within a specific region. It was first introduced by Haggett in 1965.34 The specific formula for the Location Quotient is as follows:
\[ Q_i=\frac{E_i / E_t}{A_i / A_t} \tag{1}\]
Where Qi represents the agglomeration degree of aquaculture industry in region i; Ei is the aquaculture output value of region i; Et is the total national aquaculture output value; Ai is the total output value of agriculture, forestry, animal husbandry, and fishery in region i; and At is the total national output value of agriculture, forestry, animal husbandry, and fishery. A value of Qi greater than 1, and the larger the value, the higher the concentration of aquaculture industry in that region.
Geodetector
The Geodetector method, proposed by Wang and Xu in 2017, is a statistical method primarily used to study spatial differentiation and its causes.35 This method not only detects the degree of influence of various factors but also analyzes the interactions among multiple influencing factors. A significant advantage of the Geodetector method is that it can reveal the relationship between driving forces and geographic phenomena without requiring any linear assumptions. Its computational processes and results are not affected by multicollinearity, a problem that is often challenging to avoid in spatial econometric models. The core idea of this method is based on the following hypothesis: if an independent variable has a significant effect on a dependent variable, then the spatial distribution of the independent and dependent variables should show similarities, meaning they should have a high degree of spatial match. Furthermore, the stronger the influence of the independent variable on the dependent variable, the higher the degree of spatial distribution match.
The Geodetector model includes four detectors: differentiation and factor detection, interaction detection, ecological detection, and risk zone detection. Based on the research content of this paper, the main influencing factors and the interaction of each influencing factor affecting the agglomeration of China 's aquaculture industry are analyzed by selecting the differentiation and factor detection and interaction detection. The Geodetector method has been successfully applied in various fisheries studies, demonstrating its robustness for spatial pattern analysis in aquaculture systems. Notably, Gou et al. employed this method to examine spatial patterns and influencing factors of aquaculture in Sichuan Province,36 while Yan and Shen effectively identified key determinants of marine aquaculture output in China.37 Most recently, Ma et al. utilized Geodetector to analyze carbon sequestration mechanisms in shellfish and algae cultivation systems in Fujian Province.38
Differentiation and Factor Detection: This involves detecting the spatial differentiation of the dependent variable and examining to what extent the independent variables explain the spatial differentiation of the dependent variable, measured by the q value. The specific formula is as follows:
\[ q=1-\frac{\sum_{h=1}^L N_h \sigma_h^2}{N \sigma^2}=1-\frac{S S W}{S S T}\tag{2} \]
\[ S S W=\sum_{h=1}^L N_h \sigma_h^2, S S T=N \sigma^2\tag{3} \]
In the formula, q represents the degree of spatial differentiation explanation of the factor, with a value range of [0, 1]. A larger q value indicates a greater explanatory power of the independent variable on the dependent variable, while a smaller q value indicates the opposite. The q value signifies that the independent variable explains 100 × q% of the dependent variable. h represents the stratification of the dependent or independent variable, where h=1, …, L; Nh and N denote the counts in stratum h and the entire region, respectively; and σ2 are the variances of the dependent variable in stratum h and the entire region, respectively; and SSW and SST represent the sum of within-group variances and the total variance of the entire region, respectively.
Interaction Detection: This process identifies whether the pairwise interaction between different independent variables will increase or decrease their explanatory power on the dependent variable, or whether the impact of these independent variables on the dependent variable is mutually independent. The types of interaction are shown in the table below (Table 1).
Results
Calculation Results of Aquaculture Industry Agglomeration Levels
From the perspective of the agglomeration level of the national aquaculture industry, the average agglomeration degree of the national aquaculture industry from 2006 to 2022 is 0.88. From the perspective of the development trend, the agglomeration degree of the aquaculture industry in 2006-2022 showed a slow downward trend as a whole. By comparing the agglomeration degree of aquaculture industry in different regions, it can be seen that there are 12 regions with an average aquaculture industry agglomeration degree of more than 1 in various regions of China from 2006 to 2022, namely Tianjin, Shandong, Liaoning, Jiangsu, Shanghai, Zhejiang, Fujian, Jiangxi, Anhui, Hubei, Hainan and Guangdong. The agglomeration trend of aquaculture industry in these regions is obvious. By comparing the trend of aquaculture industry agglomeration in different regions, it can be seen that the agglomeration level of aquaculture industry in Hubei Province, Shandong Province and other regions shows an upward trend as a whole, while the agglomeration level of aquaculture industry in Beijing, Shanghai and other regions shows a downward trend as a whole (Table 2).
Analysis of the empirical results of the formation mechanism of aquaculture industry Agglomeration
Variable Selection
According to the theoretical analysis of the formation mechanism of aquaculture industry agglomeration and reading a lot of literature,39,40 the influencing factors and specific indicators of aquaculture industry agglomeration are shown in table 3.
Results of Differentiation and Factor Detection
In this study, the industrial agglomeration degree of aquaculture industry is taken as the dependent variable, and the nine influencing factors of comparative advantage, external economy and institutional policy environment are taken as the independent variables. The Geodetector model is employed to assess the impact of these factors on the agglomeration of the aquaculture industry in China. The analysis focuses on the formation mechanism of aquaculture industry agglomeration at four time points: 2006, 2011, 2016, and 2022. Through the four-year detection results, the dynamic drivers of each influencing factor are displayed, exploring their stability and dynamic changes over time. Since the Geodetector method requires independent variables to be categorical, the natural breaks method in ArcGIS 10.2 software is used to classify the independent variables into five categories, converting them into categorical variables. Then, Excel Geodetector software is utilized to obtain the differentiation and factor detection results, as well as the interaction detection results.
From the q-values and significance of different influencing factors during the same period, the main influencing factors for aquaculture industry agglomeration in 2006 are ranked as follows: X7 > X9 > X3 > X2. In 2011, the ranking is X9 > X3 > X4 > X7 > X8 > X5. In 2016, the main influencing factors are ranked as X7 > X9 > X8 > X3. In 2022, the ranking is X7 > X2 > X3 > X4 > X1 > X8. At the four selected time points, industry correlation (X7) and production technology level (X3) are both significant, with their q-values ranking among the top four relative to other factors. Industry correlation (X7) has the highest impact on aquaculture industry agglomeration, with an average explanatory power of 66.9% over four years, peaking at 82.3%. The production technology level (X3) has the second highest impact, with an average explanatory power of 54.6%, peaking at 66.9% (Table 4). It is evident that industry correlation (X7) and production technology level (X3) are influential factors with high explanatory power and stable performance regarding aquaculture industry agglomeration.
Analyzing the trend of q-value changes for the same influencing factors over different periods from 2006 to 2022, it is observed that the q-values for natural resource endowment (X1) and market demand (X6) show an upward trend. The q-values for human capital (X2) and industry correlation (X7) initially decrease and then increase, while the q-values for production technology level (X3) and degree of openness (X9) exhibit a downward trend. The q-values for urbanization level (X4) show a fluctuating trend of rising, then falling, and then rising again, while the q-values for transportation costs (X5) and government intervention (X8) initially rise and then fall (Table 4).
Interaction Detection Results
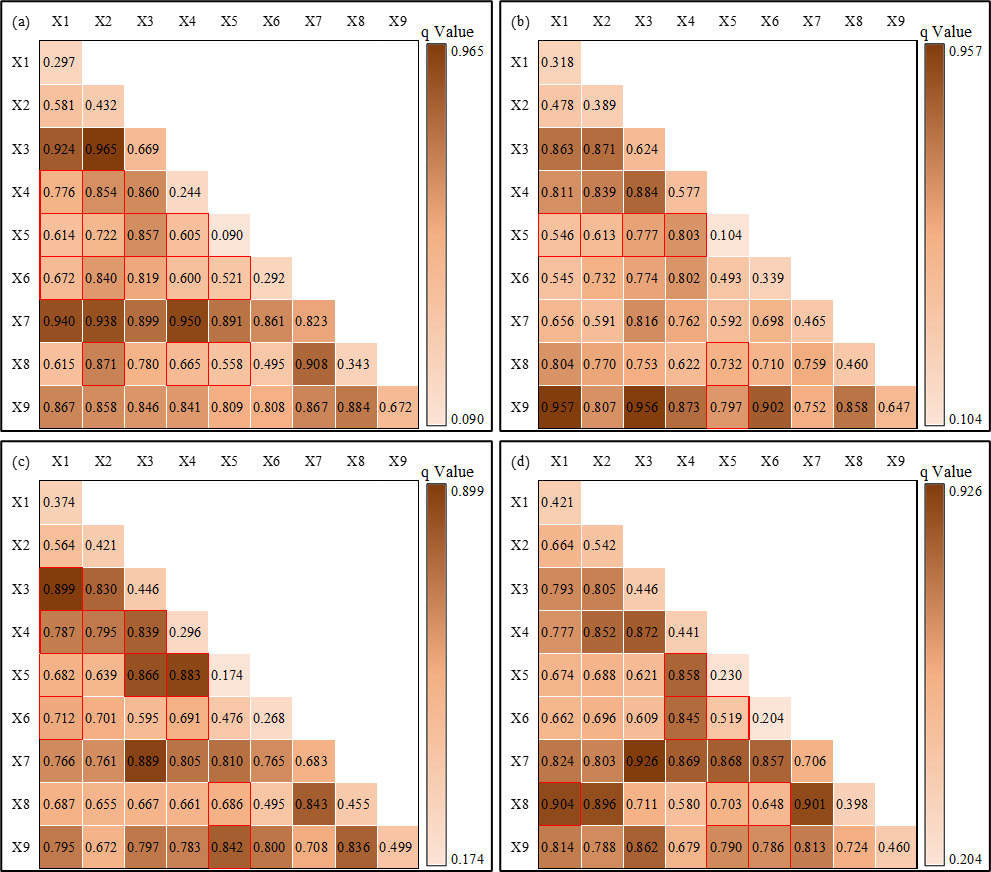
Based on the single-factor detection, interaction detection was employed to identify the interactions among different influencing factors, specifically to determine whether the combined effects of the nine factors enhance or weaken their explanatory power regarding the agglomeration of the aquaculture industry. The results indicate that under the joint action of pairs of factors, the detection of interactions among the nine single-factor detections each year yields 36 types of interaction results, all of which demonstrate either enhanced or nonlinear enhancement phenomena for the dual factors. This means that the explanatory power of the dual factors is significantly greater than that of the single factors (Figure 1).

Based on the interaction detection results of different influencing factors across years shown in Figure 2, the top three ranked interactions are summarized in Table 5. In 2006, the top three interactions were X2∩X3, X4∩X7, and X1∩X7. In 2011, the top three interactions were X1∩X9, X3∩X9, and X5∩X9. In 2016, the top three interactions were X1∩X3, X3∩X7, and X4∩X6. In 2022, the top three interactions were X3∩X7, X1∩X8, and X7∩X8 (Table 5). Among the 12 dominant interactions from 2006 to 2022, five involved the interaction of production technology level (X3) with other factors, and five involved the interaction of industrial relevance (X7) with other factors. This indicates that the interaction of production technology level and industrial relevance with other factors significantly enhances the explanatory power regarding the agglomeration of the aquaculture industry. Additionally, all 12 dominant interactions had q-values greater than 0.88, with the highest value being 0.965, indicating that the explanatory power of these 12 dominant interactions for the agglomeration of the aquaculture industry exceeds 88%, with the strongest explanatory power being 96.5%.
Based on the above analysis, it is evident that each factor not only independently influences the agglomeration of the aquaculture industry but that the interactions between various factors have an even stronger impact on this agglomeration. In other words, the spatial differentiation of aquaculture industry agglomeration in China is the result of the combined effects of multiple factors. Moreover, the influence of each factor on the agglomeration of the aquaculture industry changes over time, which also contributes to the complexity of the industry’s agglomeration.
Discussion and Conclusions
This study attempts to apply general theories of industrial agglomeration to the aquaculture industry. Based on relevant theories of industrial agglomeration and the characteristics of the aquaculture sector, a theoretical model regarding the mechanisms of agglomeration in aquaculture was constructed. Using location entropy and Geodetector methods, the research explores the level of agglomeration and its formation mechanisms in China’s aquaculture industry. The findings indicate the following:
The aquaculture industry in China exhibits a phenomenon of industrial agglomeration; however, the degree of industrial agglomeration is not high, and the overall trend of agglomeration is showing a weakening tendency.
This conclusion aligns with the research results of Li et al. and Yao et al.9,10 The reasons for this can be attributed to two main factors. On one hand, influenced by natural resource endowments, there is indeed industrial agglomeration in the aquaculture industry. Natural resource endowment forms the basis for the production and spatial layout of the aquaculture industry; the spatial distribution and combination of water resources and natural climatic conditions directly affect the production layout and inter-regional division of labor in aquaculture. On the other hand, in recent years, the government has mandated reasonable planning for aquaculture production to address issues such as the decline of fishery resources and the degradation of aquatic ecosystems. This involves scientifically delineating prohibited farming zones, restricted farming zones, and designated farming zones to achieve overall planning and coordinated development of aquaculture areas, leading to a reduction in the aquaculture area. From 2016 to 2022, the total area of aquaculture in China decreased by 14.84%, resulting in an overall weakening trend in the level of agglomeration in the aquaculture industry.
There are significant regional differences in the level of agglomeration in the aquaculture industry in our country.
China’s vast expanse exhibits significant regional differences in natural resource conditions for fisheries, where the endowment of regional fishery resources determines the price levels of production factors in aquaculture. This, in turn, leads to differences in production costs across regions and creates comparative advantages. Under the “rational economic man” hypothesis, aquaculturists or enterprises tend to follow the principle of comparative advantage in selecting aquaculture species and regions. Driven by lower costs, production in the aquaculture industry tends to shift and concentrate in areas with production advantages to gain stronger market competitiveness, resulting in substantial regional disparities in the level of agglomeration in China’s aquaculture industry.
From 2006 to 2022, there are 12 regions in China with an average aquaculture industry agglomeration degree of more than 1, and the aquaculture industry agglomeration trend in these regions is obvious. The reason is that these areas are located in the coastal areas of China and the Yangtze River Basin. Due to the abundant fishery natural resources, relatively perfect fishery infrastructure, and a high level of aquaculture technology, these areas have formed the main production areas of aquaculture. The agglomeration level of the aquaculture industry in Hubei Province, Shandong Province, and other regions shows an upward trend as a whole. This is mainly because Hubei Province is the main aquaculture producing area in China’s inland areas. Hubei Province is known as the ‘Thousand Lakes Province’. The Yangtze River and the largest tributary, the Hanjiang River, cross the provincial border, and the fishery natural resource endowment is rich. Shandong Province is the main aquaculture producing area in China’s coastal areas, bordering the Bohai Sea and the Yellow Sea, and the coastal fishery resources are rich. The agglomeration level of the aquaculture industry in Beijing, Shanghai, and other regions shows a downward trend as a whole. This is mainly because Beijing and Shanghai are megacities. With the improvement of urbanization level, the crowding-out effect of urban construction is gradually increasing, the cost of labor and resource utilization is increasing, and the aquaculture industry is gradually declining.
The agglomeration of the aquaculture industry is the result of the combined effects of comparative advantage, external economies, and the institutional and policy environment. The impact of these factors on the agglomeration of the aquaculture industry may change over time. Among the external economic factors, industrial linkage and production technology levels are highly explanatory and stable factors influencing the agglomeration of the aquaculture industry.
From 2006 to 2022, industrial relevance had the highest impact on aquaculture industry agglomeration, and recent trends show an overall increase in its explanatory power. This is primarily because upstream and downstream enterprises in the aquaculture industry tend to migrate to agglomerated regions to reduce transportation, service, and other costs, prompting more aquaculture businesses to cluster in these areas for lower costs. For example, in Guangdong Province, which has a high level of aquaculture industry agglomeration, numerous enterprises in seed production, feed, seafood processing, and trading markets exist, such as Guangdong Haida Group Co., Ltd., Guangdong Hengxing Group Co., Ltd., and Zhanjiang Guolian Aquatic Products Development Co., Ltd. The high level of forward and backward industrial development promotes the agglomeration of the aquaculture industry in Guangdong.
From 2006 to 2022, the impact of production technology levels on aquaculture industry agglomeration was second only to industrial relevance. The development and advancement of production technology enhance the utilization rates of production factors by aqua-culturists and enterprises, increase production efficiency, and lower production costs, making it more attractive for other farmers and enterprises to cluster. For instance, in Fujian Province, which has the highest level of aquaculture industry agglomeration, the yield per hectare reached 25 tons in 2022. Fujian also hosts 6% of the nation’s aquaculture technology promotion institutions and 4% of the promotion personnel. However, the trend in explanatory power for production technology levels from 2006 to 2022 shows an overall decline. This is primarily because the influence of production technology levels on aquaculture industry agglomeration has already been realized, and the research and promotion of aquaculture technology require time. The growth rates of aquaculture industry agglomeration levels in Hubei Province from 2006 to 2011, 2011 to 2016, and 2016 to 2022 were 7.4%, 10.4%, and 12.4%, respectively, while the growth rates of yield per hectare reached 19.2%, 28.4%, and 46.3%. This indicates that the development speed of aquaculture technology levels in Hubei Province has significantly outpaced the development level of aquaculture industry agglomeration.
This study also has some limitations. First, due to the availability of data and the difficulty of quantification, the selection of individual influencing factor indicators needs to be further improved. Second, this study uses the panel data of provincial-level administrative regions for investigation. The analysis of provincial-level administrative regions as research objects is often macro, and the specific guidance of the research results on micro-regions may be limited. In the future, micro-regions such as municipal and county-level can be studied on the basis of data availability. Third, there are many aquaculture models and many aquaculture varieties. Different aquaculture models and aquaculture varieties may have different formation mechanisms of industrial agglomeration due to different aquaculture technology levels, aquaculture environments, and other factors. Therefore, it is necessary to carry out a comprehensive study on the formation mechanism of industrial agglomeration of specific breeding models and breeding varieties in the future, which is more conducive to optimizing the industrial layout of aquaculture.
Acknowledgments
This study was supported and financed by the Ministry of Agriculture of People’s Republic of China through the China Agriculture Research System, grant number CARS-48, and Scientific Research Foundation for Doctoral Studies of Lishui University, grant number QDSK112025011.
Authors’ Contribution
Conceptualization: Chen Sun, Hongtao Jin, Shiwei Xu, Bin Che, Haiqing Zhang; Methodology: Chen Sun, Hongtao Jin, Shiwei Xu, Bin Che, Haiqing Zhang; Writing - original draft preparation: Jing Wang, Chen Sun; Writing - review and editing: Jing Wang, Chen Sun, Hongtao Jin, Shiwei Xu, Bin Che, Haiqing Zhang; Funding acquisition: Hongtao Jin, Jing Wang; Supervision: Chen Sun, Hongtao Jin, Shiwei Xu, Bin Che, Haiqing Zhang; Data curation: Jing Wang; Software: Jing Wang.
Competing of Interest – COPE
No competing interests were disclosed.
Ethical Conduct Approval – IACUC
This study did not involve any experimental research on animals or plants.
Informed Consent Statement
All authors and institutions have confirmed this manuscript for publication.
Data Availability Statement
All are available upon reasonable request.