


Introduction
Organisms develop diverse morphological characteristics in different environments as a result of long-term adaptation.1 This relationship between morphological variability and the environment is a key area of biological research. Otolith morphology, in particular, is widely used for comparative studies among different stocks of aquatic animals. For instance, multivariate morphometrics have been employed to analyze the shape indices of lapillus and asteriscus from nine populations of Schizothorax o’connori, revealing distinct stock differentiation.1 Similarly, otolith shape indices have been used to identify species and validate the existence of Coilia brachygnathus.2 These studies highlight the significance of otolith morphology in understanding environmental adaptation and population dynamics. Both genetic and environmental factors influence otolith morphology.3,4 Fish living in similar aquatic environments often exhibit homogenized otolith morphology due to shared ecological conditions.5–7 Conversely, in hydrologically distinct environments, otoliths often display significant morphological variation, potentially due to differences in water temperature, flow velocity, and habitat complexity.8–10 Otoliths not only record fish age but also retain ecological information reflecting the environmental conditions experienced throughout their life history.11 Otolith shape analysis, encompassing morphometric, traditional morphological, and geometric morphometric approaches, has been widely employed to identify nursery grounds, delineate fish stocks, and reconstruct life history patterns. Among the three otolith types, sagittae are often preferred in such studies due to their larger size, clear shape features, and accessibility.12 The integration of otolith size and shape indices has been shown to enhance the resolution of stock discrimination.
Big-eye Mandarin Fish (Siniperca kneri, Garman, 1912) is an economically significant, carnivorous freshwater fish endemic to China and widely distributed in the Xijiang River. Over the past few decades, the construction of large-scale hydropower and water conservancy projects along the Xijiang River has profoundly altered river connectivity and flow regimes, leading to reduced water levels, altered current velocities, and habitat fragmentation in the downstream reaches. These changes have caused a sharp decline in fishery resources, including the wild populations of S. kneri, which face significant pressure from both habitat degradation and overfishing. Although ecological restoration measures, such as the implementation and optimization of fish passage facilities, have been gradually introduced in recent years, their long-term effectiveness remains under evaluation.13 In this context, understanding how dam-induced habitat changes affect the population structure of S. kneri is crucial.14 Specifically, it is essential to determine whether geographical isolation caused by river fragmentation has led to population differentiation and whether there is ongoing gene flow between upstream and downstream groups.15–17 Maintaining the functional connectivity of the river through effective ecological corridors may help mitigate complete stock isolation.
Previous research on S. kneri has predominantly centered on reproductive biology, feeding ecology, and morphological variation.18 With a limited focus on stock delineation influenced by river regulation. To address this gap, we conducted an otolith shape analysis of S. kneri from multiple sites in the middle and upper reaches of the Xijiang River. By integrating morphological data with environmental context, this study aims to assess potential population differentiation resulting from dam-induced habitat changes, evaluate the spatial structure of fish stocks in relation to ecological connectivity, and provide a scientific basis for future conservation and fisheries management strategies.19
Materials and Methods
Study area and sample collection
Fish were captured by local fishermen using gillnets in the middle and upper reaches of the Xijiang River in November 2022 (Figure 1). Efforts were made to ensure that fish obtained from each location were from the same age/cohort by selecting individuals with similar lengths. The fish were stored in ice before being transported to the laboratory for processing. Each sample was measured for length (L, 0.01 cm) and weight (W, 0.1 g). Sagittal otoliths were then extracted using plastic forceps, washed, and cleaned in distilled water before being dried. Only sagittae with no damage or crystallization were used in this study. Age determination was based on the analysis of sagittae, which were read twice by experienced readers. If the two readings differed, a third reading was performed to ensure consistency. The coefficient of variation (CV) was calculated to assess the precision of age readings. Detailed information on the age, CV, sample size, and length-weight data from the three sampling sites is provided in Table 1.
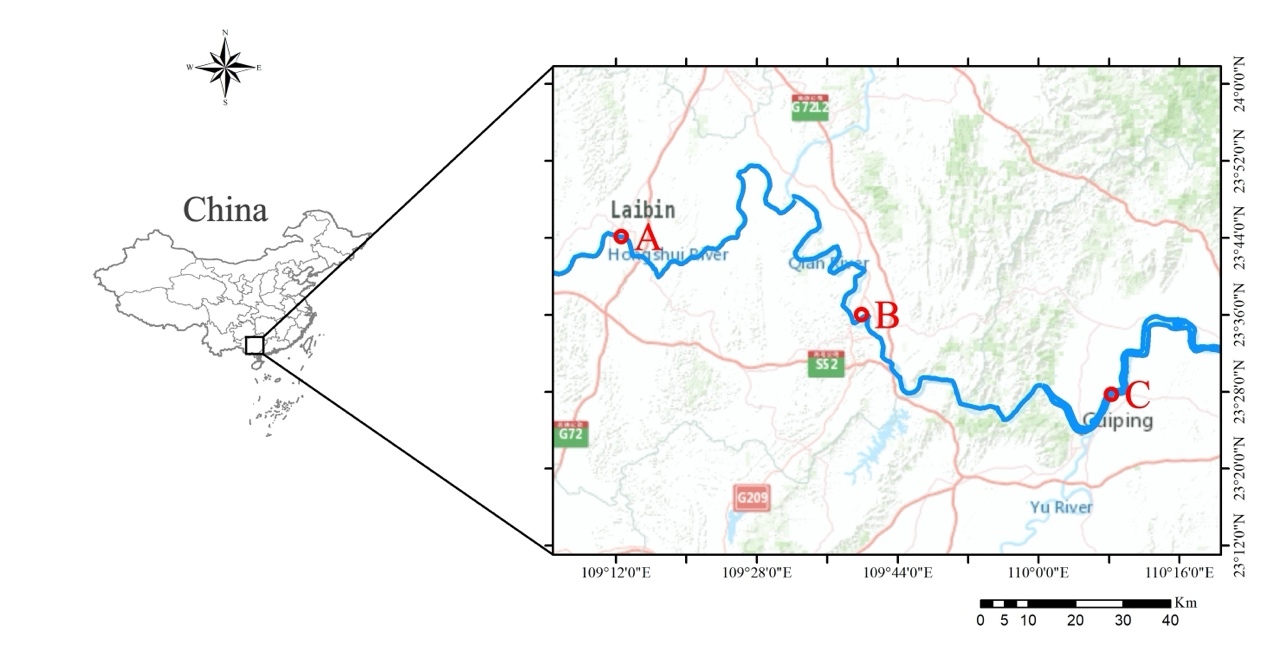
Image acquisition
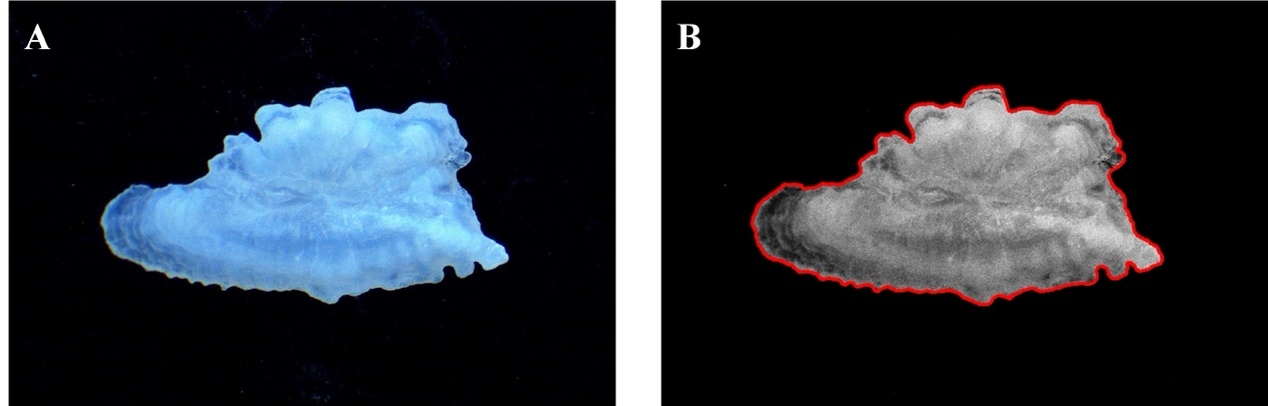
Left sagittae were placed with the distal surface down, showing the sulcus up and the rostrum pointing to the right. Digital images of otoliths were captured using a stereomicroscope (Motic SM171, Motic, China) with a digital camera (Moticam S6, Motic, China). Images were captured at a resolution of 1280 × 1024 pixels and saved as TIFF files. To ensure accurate measurements, a scale bar was included in each image for subsequent calibration (scaling). High-contrast digital images were obtained using reflected light against a dark background.
Otolith morphometry
Otolith shape indices were calculated for each sagitta using digital images processed with Image-Pro Plus software. The otolith outline was automatically extracted by converting the image to a binary format through thresholding, effectively separating the bright otolith from the dark background. As a critical quality control step, each automatically generated outline was visually inspected and manually corrected or excluded if it was inaccurately traced due to imaging artifacts or uneven lighting, thereby ensuring the reliability of the morphological data. Morphometric measurements, including otolith area (A), perimeter (P), feret length (FL), feret width (FW), maximum feret length (Fmax), minimum feret length (Fmin), maximum radius (Rmax), and minimum radius (Rmin), were used to calculate eight shape indices: roundness (RO), format-factor (FO), circularity (CI), rectangularity (RE), ellipticity (EL), radius ratio (RA), feret ratio (FE), and aspect ratio (AS) (Table 2).
Statistical analysis
All statistical analyses were performed using R (V.4.2.2) and SPSS (V.26.0), with a significance level (α) of 0.05. Data are presented as Mean ± Standard Deviation (Mean ± SD). Allometric correction: Otolith shape is often correlated with fish size (allometry). To ensure that observed differences were due to group effects rather than fish length, we corrected all eight shape indices for allometry. A linear regression was performed for each shape index against length (L). The standardized residuals from these regressions, which represent size-independent shape variation, were used for all subsequent statistical analyses.
Shape Index Analysis: The normality and homogeneity of variances for the size-corrected shape index residuals were checked using the Shapiro-Wilk and Levene’s tests, respectively. For data meeting parametric assumptions, a one-way analysis of variance (ANOVA) was used. For data that did not meet these assumptions, a non-parametric Kruskal-Wallis H test was employed. To control the false discovery rate (FDR) arising from multiple comparisons across the eight indices, the Benjamini-Hochberg (BH) procedure was applied to all p-values. Principal Components Analysis (PCA) was used to reduce the dimensionality of the shape indices and visualize overall morphological patterns. A linear discriminant analysis (LDA) was performed to assess the classification success among the three sites. To obtain a robust estimate of classification accuracy, a leave-one-out cross-validation (LOOCV) was conducted.
Elliptic Fourier Analysis (EFA): The ShapeR package in R was used to perform EFA. Otolith outlines were extracted and normalized to be invariant to size, rotation, and starting point. The outlines were described using 12 harmonics, which were found to reconstruct the otolith contour with over 98% accuracy. A canonical analysis of principal coordinates (CAP) was applied to the matrix of Fourier coefficients to visualize the morphological differentiation among the three sites, and its significance was tested using a permutation test with the vegan package.21,22
Results
Shape index analysis
ANOVA and Kruskal-Wallis H test on Size-Corrected Indices
All analyses were performed on the size-corrected residuals of the eight shape indices. After applying the Benjamini-Hochberg FDR correction, no shape index showed a significant difference among the three sites (all adjusted p-values > 0.05) (Table 3). The results indicate that once the effect of fish length is removed, there is no detectable difference in otolith shape indices among the populations from sites A, B, and C.
Principal components analysis (PCA)
Principal components analysis of the eight size-corrected otolith shape indices showed that the first two principal components had eigenvalues greater than 1, explaining a cumulative 75.2% of the total variance (Table 4). A scatter plot of the first two principal components (Figure 3) shows extensive overlap among the individuals from the three sites, indicating a lack of clear separation based on overall otolith shape.
_and_the_outline_photograph_.jpeg)

Discriminant Analysis with Cross-Validation
Linear discriminant analysis was performed on the size-corrected shape indices. The overall raw classification rate was 61.1%. However, a more robust leave-one-out cross-validation (LOOCV) yielded an overall accuracy of 55.6% (Table 5), which is only slightly better than the random classification rate for the three groups (33.3%).23 The confusion matrix details the classification results, showing high misclassification rates for all groups, particularly for group B. The scatter plot of the first two canonical discriminant functions (Figure 4) further illustrates the extensive overlap among the three groups, confirming the low discriminatory power of otolith shape indices.

Elliptic Fourier Analysis
Permutation Test on Fourier Coefficients
A permutation test based on the full set of Fourier coefficients found no significant overall difference in otolith shape among the three sites (F-value = 0.747, p = 0.746) Table 6, confirming the results from the shape indices.
Mean Shape Reconstruction and CAP Analysis
Using an Elliptic Fourier Descriptor (EFD) analysis with 12 harmonics, the reconstruction of the average otolith shape for each group showed no visually discernible differences (Figure 5). The canonical analysis of principal coordinates (CAP) also failed to separate the three sites (Figure 6). The plot of the first two canonical axes, which together explained 100% of the variation among the predefined groups, showed that the mean canonical values for each site were clustered near the origin with overlapping standard errors. This result reinforces the conclusion of high morphological similarity among the three populations.


Discussion
Otolith Shape as an Indicator of Stock Structure
The present study, using both traditional shape indices and elliptic Fourier analysis, found no significant evidence of stock differentiation for S. kneri among three sites in the Xijiang River. After rigorously correcting for allometric effects, which can confound shape comparisons, all statistical tests pointed towards a phenotypically homogeneous population. The low cross-validated classification accuracy (55.6%) from the discriminant analysis further underscores the extensive morphological overlap. This lack of differentiation suggests a high degree of connectivity among the sampled populations. This finding could be attributed to several factors. Firstly, the hydrological conditions and key environmental variables (e.g., temperature, flow regime) might be relatively uniform across the study reach, leading to similar otolith growth patterns. Secondly, and perhaps more importantly, functional ecological corridors may persist despite river regulation.8,19,21,24,25 The presence of adequate fish passage facilities could facilitate movement and gene flow between upstream and downstream sections, preventing the genetic and morphological isolation that often results from dam construction.
Study Limitations and Future Directions
Several limitations of this study must be acknowledged, as suggested by the peer review process. First, the sample sizes for each site (n = 14 to 23) are relatively small and unbalanced. This may have limited the statistical power to detect subtle morphological differences if they exist. Future studies should aim for larger and more balanced sampling designs, ideally informed by an a priori power analysis. Second, our inference that homogeneous conditions contribute to the lack of differentiation is speculative without direct, site-specific environmental data (e.g., temperature profiles, flow velocity, water chemistry). Correlating environmental variables with otolith morphology would provide more substantial evidence. Finally, while otolith shape is a valuable tool, it may not be sensitive enough to detect recent or cryptic population structure. Therefore, we strongly recommend that future research on S. kneri in the Xijiang River incorporate more direct methods for assessing connectivity (such as otolith microchemistry26–29 to reconstruct migratory histories and population genetics (e.g., microsatellites or SNP analysis) to quantify gene flow and population structure directly.
Effects of Dam Construction and River Connectivity
Large-scale water conservancy projects are known to fragment aquatic habitats and potentially lead to the isolation of fish stocks. Otolith morphology can serve as a sensitive indicator of such divergence. Contrary to expectations, our results did not reveal distinct otolith shapes between populations upstream and downstream of dams. This suggests that, at present, river fragmentation has not led to detectable phenotypic divergence in the otoliths of S. kneri.20,30 One plausible explanation is that the time since dam construction has been insufficient for morphological differences to evolve and become fixed. Alternatively, as mentioned, the fish passage facilities in place may be successfully mitigating the barrier effect, allowing for sufficient individual exchange to maintain a single, interbreeding population. However, it is crucial to interpret this finding with caution. Otolith shape reflects an integration of both genetic and environmental influences throughout a fish’s life, and the absence of shape difference does not definitively rule out underlying genetic structuring or demographic independence.
Conclusion
This study employed otolith shape analysis to evaluate the stock structure of Siniperca kneri (Garman, 1912) in a dam-regulated section of the Xijiang River. After correcting for size-related effects, our results consistently showed no significant morphological differentiation among the three sampled populations. This suggests the presence of a single phenotypic stock, possibly maintained by ongoing ecological connectivity through effective fish passage systems and relatively homogeneous environmental conditions. However, given the limitations of our sample size and the absence of direct environmental data, these conclusions should be considered preliminary. This study provides a valuable baseline but also underscores the critical need for a multidisciplinary approach, integrating genetic and microchemical analyses, to definitively assess population structure and inform robust conservation and management strategies for this economically important species.
Acknowledgments
The authors extend their sincere gratitude for the technical assistance rendered by the Fishery Resources and Protection Laboratory of the College of Fisheries at Southwest University
Funding statement
This research was sponsored by the Natural Science Foundation of Chongqing, China (No. CSTB2025NSCQ-GPX0485).
Authors’ Contribution
Weijie Cui: Writing – review & editing, Conceptualization, editing, Writing – original draft, Software. Zhongtang He: Writing – review & editing, Conceptualization. Fengling Zhang: Data curation, Software, Formal analysis. Li Xu: Writing – review & editing, Resources. Yang Zhou: Writing – review & editing, Supervision, Resources, Conceptualization. Shengqi Su: Writing – review & editing, Methodology. Tao He: Writing – review & editing, Writing – original draft, Software, Methodology, Formal analysis, Data curation, Conceptualization.
Competing of Interest – COPE
The authors declare that they have no known competing financial interests or personal relationships that could have appeared to influence the work reported in this paper.
Ethical Conduct Approval – IACUC
No approval of research ethics committees was required for this study as the fish samples were collected from the commercial catches of the fishers.
Informed Consent Statement
All authors and institutions have confirmed this manuscript for publication.
Data Availability Statement
The data that support the findings of this study are available from the corresponding author upon reasonable request.