
Introduction
Triplophysa hsutschouensis, a freshwater fish endemic to China, is classified under the order Cypriniformes, family Cobitidae, and genus Triplophysa. It is a small benthic fish species found uniquely in the northeastern Tibetan Plateau,1 primarily inhabiting the Hexi Corridor region of Gansu Province, including areas such as Jiuquan and the Heihe River basin. Notably, it is the only species within its genus characterized by a relatively simple evolutionary history.1 Additionally, it serves as an economically significant fish in the region.2 However, research on T. hsutschouensis has been relatively limited. Previous studies have mainly focused on taxonomy, morphology, resources assessment, geographical distribution,2–4 and mitochondrial DNA (mtDNA) genetic markers.5 Feng et al.1 explored the evolutionary history of the Triplophysa robuesta (Cobitoidea) complex, which encompasses T. hsutschouensis, using multilocus analyses and coalescent simulations. Chen et al.3 evaluated the current suitable habitats of T. hsutschouensis and predicted changes in habitat distribution by 2050 and 2070.3 Despite these efforts, no studies have reported on microsatellite molecular markers for this species to date. Further research into this area is therefore necessary.
Microsatellites, or simple sequence repeats (SSR),6 are molecular markers that emerged in the late 1980s. Based on the polymerase chain reaction (PCR) technique, SSR markers offer several advantages, including high polymorphism, abundant repeat sequences, ease of operation, and high co-dominance.7,8 These characteristics have made SSRs a widely favored tool among researchers for studying genetic diversity of species. As theoretical research has deepened, experimental techniques have improved, and data analysis software has become more refined, SSR technology has matured and found extensively application in genetic diversity and genetic structure studies of various species, such as Triplophysa yarkandensis,9 Schizothorax biddulphi,10 Pelodiscus sinensis,11 and Lateolabrax maculatus.12
Restriction site-associated DNA sequencing (RAD-Seq) is a method where genomic DNA is digested using restriction enzymes, followed by high-throughput sequencing of the resulting fragments. RAD-Seq offers several advantages over other sequencing technologies. It simplifies the genome by focusing on restriction enzyme-digested fragments and does not require a reference genome, making it suitable for genotyping. Due to these benefits, RAD-Seq has been widely used in various fields, including molecular marker development, genetic diversity analysis, functional gene identification, and germplasm evaluation across different species.13–18
Assessing species’ genetic diversity is crucial for managing and conserving fishery resources and advancing genetic theory. Higher genetic diversity enhances a species’ evolutionary potential and adaptation to environmental changes.19 Our previous study examined T. hsutschouensis single nucleotide polymorphism (SNP) markers via RAD-Seq.20 However, SSR and SNP marker development has systematic differences across multiple levels. Using the same biological samples, this study developed SSR markers through RAD-Seq to evaluate T. hsutschouensis. genetic resources. Specifically, we analyzed the genetic diversity of T. hsutschouensis population in the Gansu Province’s Shule River basin (Ganqing section). The goal was to offer scientific guidance for conserving and developing wild T. hsutschouensis resources and to effectively assess its germplasm status.
Materials and Methods
Information on the sequenced samples
The Shule River, part of the Hexi River system, has likely undergone multiple exchanges with formerly separated rivers due to the Tibetan Plateau’s uplift, which has complicated local river systems.1 Between October 2019 and September 2021, 46 T. hsutschouensis individuals were collected from the Ganqing section of the Shule River basin in Gansu Province (96°57’42.62" E, 39°33’16.55" N). Results therefore represent within-population diversity; geographic generalization awaits multi-locality sampling. Sample collection details are shown in Figure 1a. After morphological identification (Fig. 1b), muscle and fin tissues from T. hsutschouensis were collected and preserved in 95% alcohol for later use.
_sampling_site_of_*t._hsutschouensis*._the_sampling_site_map_was_created_in_qgis_(v.jpeg)
DNA extraction and preservation
We used the Ezup Column Animal Genomic DNA Extraction Kit from Sangon Biotech (Shanghai) Co., Ltd., following the manual’s instruction to extract DNA from the samples. The integrity of the extracted DNA was verified using 1% agarose gel electrophoresis. DNA samples with an A260/280 ratio between 1.8 to 2.0 were considered acceptable. The extracted DNA was stored at -20°C for subsequent use.
RAD-Seq of DNA samples
We randomly selected six samples (denoted as J1, J2, J3, J4, J5 and J6) from all T. hsutschouensis samples for SSR development via RAD-Seq. Genomic DNA from each sample was digested with EcoRI, and an adapter (P1) containing forward amplification and Illumina sequencing primer sites, as well as a 6 bp nucleotide barcode for sample identification, was ligated to the fragment’s compatible ends. The adapter-ligated fragments were pooled, randomly sheared, and size-selected. DNA was then ligated to a second adapter (P2), a Y adapter with divergent ends. For detailed RAD sequencing methods, refer to Emerson et al.21 Finally, fragments of 200 bp to 400 bp and 400 bp to 600 bp were collected for library construction. We used a Qubit2.0 kit to analyze library quality. Agilent 2100 to check the insert size after dilution the library to 1 ng/µL, and Q-PCR to detect library effective concentration (aim for > 2nM) when the insert size was appropriate. All steps ensured quality.
Development of SSR markers
Using the Illumina HiSeq PE150 platforma, we employed paired-end sequencing to develop SSR markers for T. hsutschouensis. The SSR Search software was employed to identify microsatellite loci. In this process, a minimum sequencing volume of 1.5 Gb was set, and the search was conducted according to specific criteria. Specifically, the search criteria required repeat units of 2-6 bases with ≥ 5 repetitions, and PCR product lengths of 100-400 bp. Primer Premier 5.0 software22 designed primers with lengths of 18 bp to 35 bp and Tm values of 46°C to 60°C, ensuring a maximum Tm difference of 5°C between forward and reverse primers. All primer synthesis and Short Tandem Repeat (STR) genotyping were completed by Sangon Biotech (Shanghai) Co., Ltd. synthesized the primers and conducted STR genotyping to enable subsequent sample detection.
Preliminary screening of SSR loci and PCR amplification
We collected 46 T. hsutschouensis individuals from the Ganqing section of the Shule River basin in Gansu Province and conducted PCR amplification using 67 synthesized primer pairs. Through gradient temperature experiments, we optimized conditions to select SSR primers that could stably amplify target fragments visible via agarose gel electrophoresis. The 30 µL PCR reaction included 14 µL Premix Taq (2 × Taq Plus MasterMix, CWBIO), 1 µL DNA template, 1 µL forward primer (10 pmol/µL), 1 µL reverse primer (10 pmol/µL), and 13 µL sterile deionized water. The PCR program involved initial denaturation at 94°C for 5 min; denaturation at 94°C for 45 s, annealing for 30 s at gradient temperatures, and extension at 72°C for 45 s over 32 cycles; final extension at 72°C for 7 min. Capillary electrophoresis (Seq100) was used to analyze the PCR products and identify polymorphic primers.
Genetic diversity analysis
Fluorescently labeled primers, marked with FAM at the 5’ end of the forward primer, were synthesized for stable amplification and polymorphism detection. These primers were used to conduct PCR amplification of T. hsutschouensis individuals. The amplified products were sequenced by Sangon Biotech (Shanghai) Co., Ltd., and the resulting sequences were analyzed to assess the genetic polymorphism of T. hsutschouensis in the Shule River basin of Gansu Province.
Data analysis
Data were converted to software-compatible formats using CONVERT 1.31. Preliminary data processing and genotyping were done with Genemarker® (v1.95 Demo). Genotyping relied on SSR locus fragment lengths. The number of alleles (Na), observed heterozygosity (Ho), expected heterozygosity (He), polymorphism information content (PIC), and the P-values representing deviations from Hardy-Weinberg equilibrium (HWE) were calculated using Cervus 3.0.23
Results
Sequencing results analysis
After removing the low-quality reads, we obtained 14,610,309,600 bp of clean base data. Each sample had over 1,909,844,100 bp of clean base. Q20 values ranged from 96.98 to 97.78%, Q30 values from 91.51 to 93.26%, and GC content from 39.51 to 40.28% (Table 1), indicating the data were suitable for subsequent biological information analysis. Enzymatic digestion validation showed that while all six samples (J1–J6) were acceptable, only J3 was free of gel pore impurities, with the other five samples showing slight contamination (Table S1). Thus, we only utilized RAD-seq data from J3 for SSR development.
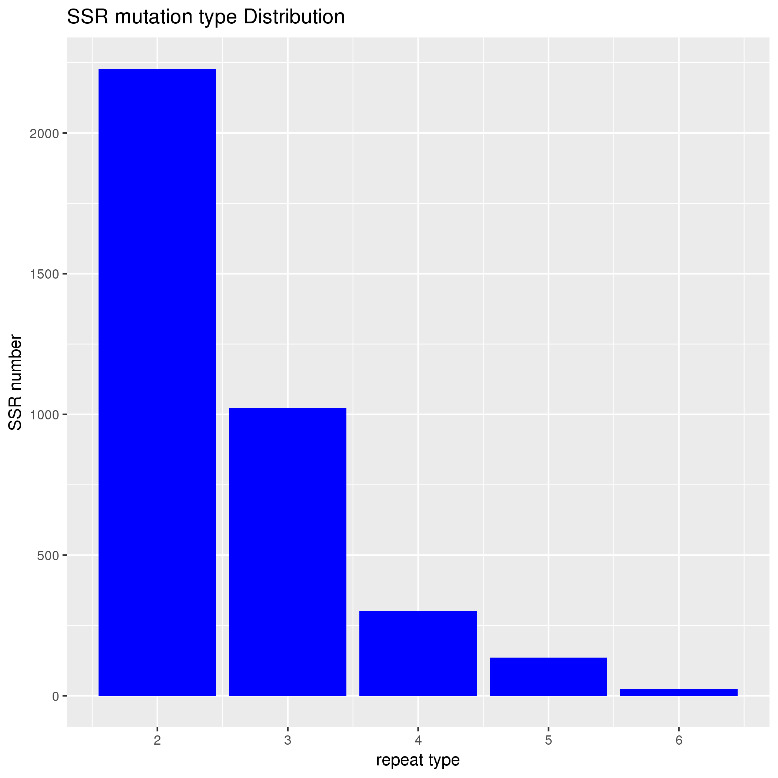
The histogram depicting SSR mutation type distribution reveals a notable pattern (Fig. 2). SSRs with repeat units of two bases are the most predominant, number over 2000. Those with a repeat type of 3 are the second most abundant, with just under 1000. There is a sharp decline in numbers from repeat types 4 to 6, indicating that SSR mutation types with lower repeat types are significantly more common in the dataset.

Microsatellite loci and primer information
Based on the settings, 67 pairs of primers were successfully designed and synthesized (Table S2). Using the genomic DNA of T. hsutschouensis as the template, 18 polymorphic primer pairs (Table 2) were selected from the 67 SSR primers designed in this study. Specifically, after an initial analysis via capillary electrophoresis, we identified 18 primers with high polymorphism information content.
SSR locus diversity analysis
Eighteen highly polymorphic SSR primers were used to amplify DNA from 46 individuals of T. hsutschouensis, and the amplification results were analyzed to obtain information on SSR genetic diversity (Table 3). The number of alleles (Na) in T. hsutschouensis ranged from 2 to 16, with the most polymorphic locus, SSRJ65, possessing 16 alleles. Among the 18 SSR loci, the effective number of alleles (Ne) varied from 1.293 to 8.672, the observed heterozygosity (Ho) ranged from 0.261 to 0.957, the expected heterozygosity (He) ranged from 0.227 to 0.885, and the polymorphism information content (PIC) ranged from 0.201 to 0.874. The average Na and Ne were 7.056 and 3.540, respectively, with an average Ho of 0.609 and an average He of 0.639. The average PIC value was 0.595. Among the 18 polymorphic SSR loci developed, five loci (27.8%) showed significant deviations from HWE after Bonferroni correction (P < 0.001). The remaining 13 loci (72.2%) conformed to HWE expectations (P > 0.05), indicating no significant population-level genetic disturbances at these markers.
Discussion
Genetic diversity is crucial for the evolution and adaptation of organisms. Population genetic diversity enhances adaptability to environmental changes, while reduced diversity threatens animal populations in fluctuating environments.24 To assess genetic diversity, key indicators like Na, Ho, and PIC are used.25 High values of Na, Ho, He, and PIC suggest rich allelic resources and greater genetic variation. Typically, a closer effective-to-observed allele count ratio indicates a more even allele distribution.26 PIC is crucial for evaluating SSR locus diversity, with values above 0.5 indicating high polymorphism, values between 0.25 and 0.5 indicating moderate polymorphism, and values below 0.25 indicating low polymorphism.27 PIC evaluation offers precise insights into SSR locus diversity levels.
High-throughput sequencing has proven to be an effective strategy for developing genetic studies, microsatellite markers, and conducting genetic studies in aquatic species. For instance, Zhang et al.28 sequenced the genome of Sinogastromyzon sichangensis and identified 29 polymorphic SSR loci, which showed high polymorphism with an average PIC value of 0.859. Similarly, Li et al.29 25 SSR loci were isolated from Acipenser dabryanus using the same technology, with an average PIC of 0.727, highlighting their utility in population genetic analyses. These studies demonstrate that high-throughput sequencing is a robust technique for developing SSR markers across divergent fish species. In this study, we used RAD-Seq technology to develop SSR markers for T. hsutschouensis. Among the 67 designed SSR primer pairs (for repeat units of 2-6 bases), 18 loci (26.9%) showed polymorphic amplification. The average Na and PIC values were 7.056 and 0.595, respectively, which are generally in line with the ranges reported for A. dabryanus (Na = 7.2, PIC > 0.5) and S. sichangensis (Na = 14.5, PIC = 0.859). The relatively lower average PIC values in our study may be due to differences in repeat motif composition or population genetic structure. Notably, locus SSRJ65 exhibited exceptional polymorphism with 16 alleles and a PIC value of 0.847, surpassing the maximum values reported in the aforementioned studies. The observed heterozygosity patterns (Ho = 0.609, He = 0.639) indicate moderate genetic diversity within the sampled population. This difference in heterozygosity levels compared to S. sichangensis (Ho = 0.620, He = 0.882), may be due to the specific ecological constraints of T. hsutschouensis. Compared to prior T. hsutschouensis studies using SNP markers,20 this study’s SSR markers provided comprehensive polymorphism parameters, including Na and Ne.
In our panel of 18 loci, the mean PIC was 0.595, indicating overall moderate informativeness. Fourteen loci met the conventional ‘high polymorphism’ threshold (PIC > 0.50), whereas four loci showed PIC ≤ 0.50 (Table 3). Accordingly, downstream applications should prioritize the higher-PIC markers, while the lower-PIC loci may still be helpful for diversity baselines or cross-population transferability tests. In addition, five of the 18 microsatellite loci (27.8%) showed deviations from the Hardy-Weinberg equilibrium. These deviations could be due to null alleles, population substructure, selective forces, or genotyping errors. It is essential to note that, despite these deviations, the loci in question still provide valuable insights into the genetic diversity and structure of T. hsutschouensis populations. Future research should investigate these deviations further, potentially using MICRO-CHECKER to assess null alleles and calculating FIS to gain a better understanding of population genetics. Moreover, we recommend that these loci be validated in future research before they are applied to specific applications such as population genetics or conservation management.
This study confirms that RAD-Seq technology is effective for developing polymorphic markers via SSRs, complementing SNP marker research and advancing genetic studies. These markers highlight RAD-Seq’s efficiency in SSR development and offer essential tools for future conservation genomics of this ecologically vulnerable species. To enhance transregional conservation efforts, future studies should focus on genome-wide validation of these markers and extend their application to nearby populations.
Acknowledgments
This work was supported by a grant from the Project of Investigation on Fishery Resources and Environment of Northwest China. The project was also funded by the Sichuan Freshwater Fish Innovation Team Construction Project of China Agriculture Research System (SCCXTD-2025-15) and the Technology Program of Sichuan Academy of Agricultural Sciences (1+9KJGG004).
Authors’ Contribution
Conceptualization: Ya Liu, Qiang Li; Data curation: Hangyu Lin; Formal Analysis: Ya Liu; Funding acquisition: Qiang Li; Investigation: Ya Liu, Qiang Li; Methodology: Ya Liu, Zhongmeng Zhao; Project administration: Qiang Li; Resources: Zhongmeng Zhao, Qiang Li;
Software: Han Zhao, Hongyu Ke; Supervision: Jue Lin; Validation: Ya Liu; Visualization: Hangyu Lin; Writing – original draft: Ya Liu; Writing – review & editing: Hangyu Lin, Shengqi Su.
Competing Interest – COPE
No competing interests were disclosed.
Ethical Conduct Approval – IACUC
All animal handling procedures in the current study were approved by the Institutional Animal Care and Use Committee of the Fisheries Research Institute, Sichuan Academy of Agricultural Sciences in Chengdu, China (Approval No.: 20190416001A). All experiments were conducted in accordance with the committee’s approved guidelines.
Informed Consent Statement
All authors and institutions have confirmed this manuscript for publication.
Data Availability Statement
All are available upon reasonable request.