


Introduction
Frozen seawater shrimp exporting from Vietnam in 2024 ranked third in the world’ exports.1 Most of exported products came from shrimp farming, in which two main species Litopenaeus vannamei and Penaeus monodon of shrimps were cultured in aquaculture ponds in most of coastal provinces in Vietnam.2 The shrimp culture contributed not only to provide the local requirement but also to export of shrimp production in Vietnam. There are many problems that can affect the health and productivity of farmed shrimp including diseases.3 According to the report by journal of Vietnamese seafood from Department of Animal Health - Ministry of Agriculture and Rural Development, Vietnam, the total area of brackish water shrimp farming affected in 2023 was more than 21 thousand hectares (ha) in which about 17 thousand ha infected due to the environment and 155 ha the sources of disease is unknown. In 2024, the infected shrimp farming area was more than 4 thousand hectares, a decrease compared to 2023 but still accounted for 19% of the total shrimp farming area.4 Antibiotics were always used instead of disease prevention and treatment measures in the way of thinking of shrimp farmers.5
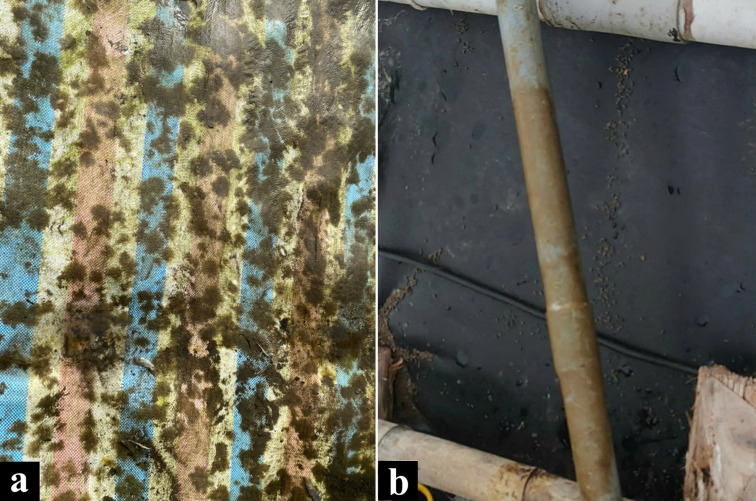
In recent years, a new suspected pathogen infecting shrimp has been documented and reported by shrimp farmers, they named coin fungus or dog-foot fungus by Vietnamese shrimp farmers. The coin fungus was considered to be a lichen-like organism, or a combination of filamentous fungi and photosynthetic organisms due to their morphological characteristics. They had a very strong fishy smell, scaly, branch-shaped or in a bunch of threads, often clinging to the tarpaulin at lower 20~30 cm from the water surface or to the equipment in the pond and developed rapidly (figure 1; Microbelift). Depending on the nutritional level, they had different sizes, making lichen-like organism treatment complicated.

The signs for detecting the lichen-like organism are: 1, through the pond environment such as: fishy smell of water; various color the lichen-like green, white, yellow, or brown; scaly shape or branched tree shape or a bunch of fibers clinging to the bottom, the banks of the pond or any objects and tools in the shrimp pond. 2, through the signs of shrimp health: loose, broken intestines; a flat body, stunted and more severe is white feces disease or fall to the bottom due to eating this organism.
Although they have not been exactly identified, the colony form of lichen-like could create an ideal shelter for many parasitic organisms that would be harmful to shrimp.6 Disease outbreaks in shrimp aquaculture, especially in intensive culture systems such as distributed ponds, became increasingly severe and economically expensive in recent times.7 Identified pathogens included bacteria, fungi, and parasites that thrive well in poor water quality and adverse environmental conditions. Amongst bacterial diseases, Acute Hepatic Venous Valve Disease (AHPND), also known as Early Mortality Syndrome (EMS), had been widely reported in Vietnam, Thailand, and China, mostly caused by Vibrio spp. Similarly, Necrotic Liver Disease (NHP), often associated with the bacterium Hepatobacter penaei, induced mass mortality at elevated salinities and temperatures, was typically marked by reduced appetite, stunted growth, and pale livers.8,9 Vibriosis reduced growth rate, lethargy, obscured of muscles as well as emptiness in gut of shrimps.10 Furthermore, fusariosis - a disease related to Fusarium spp. was informed as a fungal-induced disease. They were not only affecting the tissue but also made the lesion on the cephalothorax and abdomen of shrimps.11 Larval mycosis, the other fungal disease which affect the early periods like eggs, larvae and post-larvae of shrimps,12 brought serious lost for aquaculture shrimp because of the regeneration of new batch for shrimp cultivation will not be possible.
Up to date, no scientific publication related to the identification of above lichen-like samples which recognized by Vietnamese farmer from their shrimp ponds. This lichen-like sample was considered a potentially cause of disease in shrimp by the attraction to shrimp as a food with its inherent fishy smell. While the presence of this biological complex was always accompanied with visible damage to shrimp cultured, they need to be studied. Since their structure could be a diverse community, separating them for identification may not cover their entire ecosystem. Therefore, this study used next-generation sequencing - a modern molecular biology technique as a tool to resolve this community structure. Shotgun metagenomics sequencing was applied to analyze the diversity of organisms in the lichen-like samples in shrimp ponds in Vietnam. Our report is preliminary results for the analyzing the potential suspect in shrimp’s aquaculture problem.
Materials and Methods
Lichen-like samples collection and materials
The lichen-like samples were collected at a shrimp farm (20.758013990204127, 106.74954873659055) at Duong Kinh district, Hai Phong City, Vietnam after finishing the unsuccessful shrimp farming periods (mark at M01; figure 1a) and another shrimp farm (8.767226500193557, 105.01684276862352) at Ca Mau province, Vietnam during the shrimp farming process which clearly observed the plaque appear on the water tube in the pond (mark at NM1E2, figure 1b). The sample collected was identified as a nearly round shape, accumulated to either the tarpaulin near the bottom of the pond after finishing the culture of shrimps (M01) or the tools and facilities floating inside the shrimp ponds (NM1E2). Sample was kept frozen at -80oC before extracting total DNA.
DNA extraction
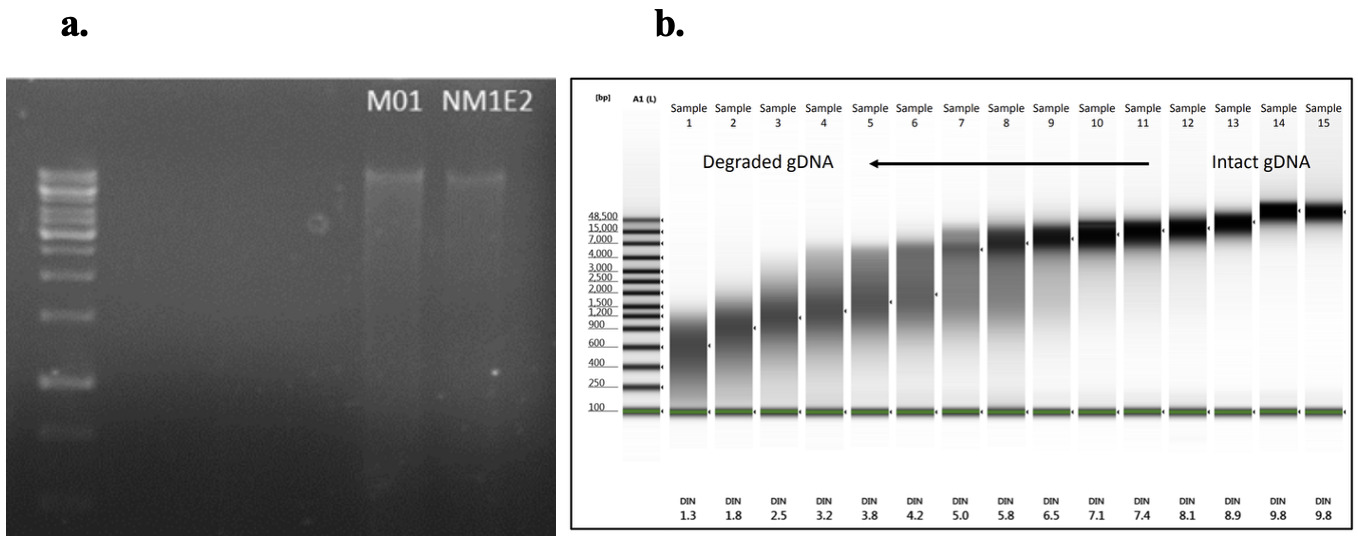
Total genomic DNA was extracted using the QIAamp DNA kits for DNA extraction (Qiagen, Germany), following the manufacturers’ protocols. DNA purity and concentration were measured by spectrophotometer (NanoDrop 2000, Thermo Scientific) and the integrity was assessed 0.8% agarose gel electrophoresis. Quality of DNA (DIN) had been checked prior sending to sequencing according to Marcus et al., Agilent Technologies (figure 2).
_and_dna_integrity_nu.png)
DNA sequencing and data analysis
The total DNA of samples were sent for metagenomic DNA sequencing in Novogene Co., Ltd. under shotgun metagenomic sequencing contract ID H401SC24125304. DNA extraction and library construction were performed with Illumina-compatible methods, followed by paired-end sequencing on the Nova X Plus platform (2 × 150 bp). The steps of data analysis are following procedure:
Bioinformatics Pipeline
In order to maintain the integrity and fidelity of the sequencing output, raw reads derived from the Illumina NovaSeq PE150 platform were submitted to quality control using FastQC v0.11.9 (https://www.bioinformatics.babraham.ac.uk/projects/fastqc/). The parameters (table 1) were carefully examined to determine whether the reads had sufficient quality for downstream metagenomic analysis:
Given that all FastQC reports indicated consistently high-quality reads across these key metrics, no additional trimming or filtering was required, and the raw reads were retained for downstream analyses including taxonomic classification, assembly, and functional annotation.
For taxonomic profiling, high-quality reads were classified against the NCBI RefSeq database (March 2025 release) using Kraken2 v2.1.2,13,14 with default settings. Species-level abundance estimations were refined using Bracken v2.6.2.13
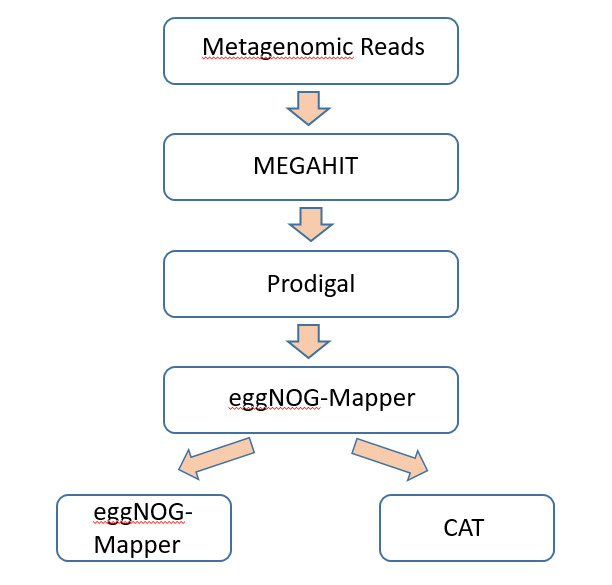
Metagenomic reads were assembled with MEGAHIT v1.2.9, which employs a de Bruijn graph-based approach that was tailored for complicated communities. Low-frequency k-mers that occurred only once were discarded (–min-count 2), and contigs less than 200 bp in length were discarded for ensuring quality.
Assembly quality was assessed with QUAST v5.2.0, showing number of contigs, assembly size, N50/N90 (continuity), L50/L90 (efficiency), GC content, and auN (cumulative contiguity). Contigs of length > 1,000 bp were used for downstream analysis.
Functional annotation: Open reading frames (ORFs) were also predicted from contigs using Prodigal v2.6.3 in metagenomic mode and translated protein sequences were also annotated with eggNOG-mapper v2.1.9 against the eggNOG v5.0 database to yield KEGG pathways, EC numbers, and functional categories (figure 3).

Taxonomic classification was performed using CAT (Contig Annotation Tool) with DIAMOND alignment against the NCBI NR database. Consensus was only attributed if >50% of ORFs on a contig shared the same lineage, thus making it more authentic and preventing horizontal gene transfer mistakes.
Targeted Read Mapping: To confirm key taxa, high-quality reads were mapped against reference genomes of Fusarium oxysporum, Vibrio campbellii, and Vibrio alginolyticus using Bowtie2 v2.5.2 in very-sensitive mode. Mapping statistics and genome coverage offered evidence of their presence.
Statistical Analysis
Alpha diversity indices, including Shannon, Simpson, and Chao1, were calculated to assess microbial diversity within samples using the scikit-bio Python package. Chao1 Index was a non-parametric index that used to estimate the richness of species in a community with consideration of the abundance of rare taxa. The singletons (species occurring once) and doubletons (species occurring twice) were employed by the estimator to extrapolate the number of unobserved species.15 Shannon Diversity Index expressed the quantifying richness (number of species present) and evenness (distribution of abundances among species) in a community.16 It responded to small taxa and indicated how evenly individuals were distributed among species. Larger values indicated more diverse and evenly-balanced communities; Simpson Diversity Index was the probability of two randomly selected individuals in a sample belonging to the same species,17 The Simpson index were more sensitive to dominant taxa and less sensitive to rare species compared to the Shannon index. (Table 5)
For taxonomic abundance analysis, raw abundance data were log-transformed (log₁₀[x+1e-9]) and subsequently standardized using z-score normalization to allow cross-sample comparisons. Heatmaps were constructed based on z-scores to visualize the distribution patterns of key bacterial and fungal genera across environments.
All statistical analyses and visualizations were performed using Python (v3.10) libraries, including seaborn, scikit-bio, and matplotlib. Statistical significance was set at p < 0.05 unless otherwise indicated.
Results and Discussion
DNA Extraction
Genomic DNA extracted from both lichen-like samples (M01 and MM1E2) demonstrated high quality and suitability for downstream next-generation sequencing applications. The DNA concentrations were 94.1 ng/µL for M01 and 40.1 ng/µL for MM1E2, exceeding the minimum input requirements for library preparation protocols (table 2 and 3). Purity ratios were within or near ideal ranges, with A260/280 values of 1.95 for M01 and 2.14 for MM1E2, suggesting minimal protein contamination. The A260/230 ratios were 1.52 for M01 and 1.9 for MM1E2, indicating low levels of residual salts and organic contaminants. Notably, the DNA Integrity Numbers (DIN) of 6.5 for M01 and 7.4 for MM1E2 confirmed that both DNA samples were sufficient quality for shotgun metagenomic sequencing (figure 2).
Sequencing analysis
Shotgun metagenomic sequencing was performed using the Illumina NovaSeq 6000 platform with a paired-end 150 bp (PE150) strategy. The sequencing yielded 64,954,792 raw reads (9.7 Gb) in M01 and 55,135,332 raw reads (8.4 Gb) in NM1E2. Quality filtering and preprocessing resulted in high effective read retention, with 97.68% and 98.24% of reads retained for M01 and NM1E2, respectively. The sequencing error rate was consistently low at 0.01% for both samples (Table 4).
Base quality metrics were high, with Q20 values exceeding 97% (97.89% for M01 and 98.77% for NM1E2, respectively), and Q30 scores of 94.25% for M01 and 96.37% for NM1E2, indicating that the majority of bases were of high accuracy. Notably, GC content differed between the two samples, with M01 exhibiting a higher GC percentage (62.41%) than NM1E2 (42.60%), which reflected underlying differences in microbial community structure or metagenomic DNA composition. Collectively, these quality metrics demonstrated that the sequencing data were high fidelity and suitable for comprehensive downstream metagenomic analyses.
Diversity indices
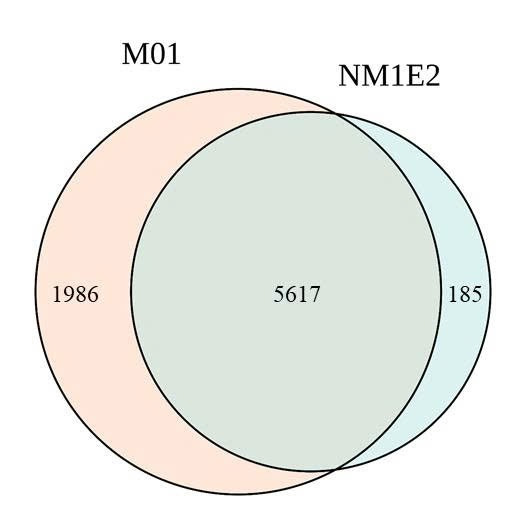
A total of 34.4 million and 28.0 million read pairs were selected from the M01 and NM1E2, respectively, for analyze diversity in samples. Taxonomic analysis identified 7,603 species in M01 and 5,802 species in NM1E2, of which 5,617 species were shared between the two samples (Fig. 4, table 5). These demonstrated the presence of a substantial core microbiome while also highlighting niche-specific species. The Alpha diversity indices showed differences between the two microbial communities. The M01 sample exhibited greater richness and diversity, with higher Shannon (6.640) and Chao (8068) than the NM1E2 with Shannon (4.011) and Chao1 (6479), respectively. Thus the M01 sample representatived a more complex and evenly distributed community. Similarly, the Simpson index (0.985 vs. 0.932) suggested higher species evenness in M01 (Table 5).
Taxonomy profiles
Bacterial community – composition of the main Phylum
Taxonomic profiling was conducted using Kraken2 for initial classification, followed by Bracken to refine abundance estimates based on assigned reads. In total, 16.19% and 16.12% of the reads were successfully classified up to the genus level in samples M01 and NM1E2, respectively. Relative abundance values were calculated as the proportion of classified reads assigned to each taxon.
At the phylum level, six dominant bacterial phyla were identified across both samples: Proteobacteria, Actinobacteria, Bacteroidetes, Chordata, Cyanobacteria, Firmicutes (Fig. 5). Among these, Proteobacteria consistently represented the most abundant phylum in both samples, ranging from 9.34% in M01 to 12.98% in NM1E2.
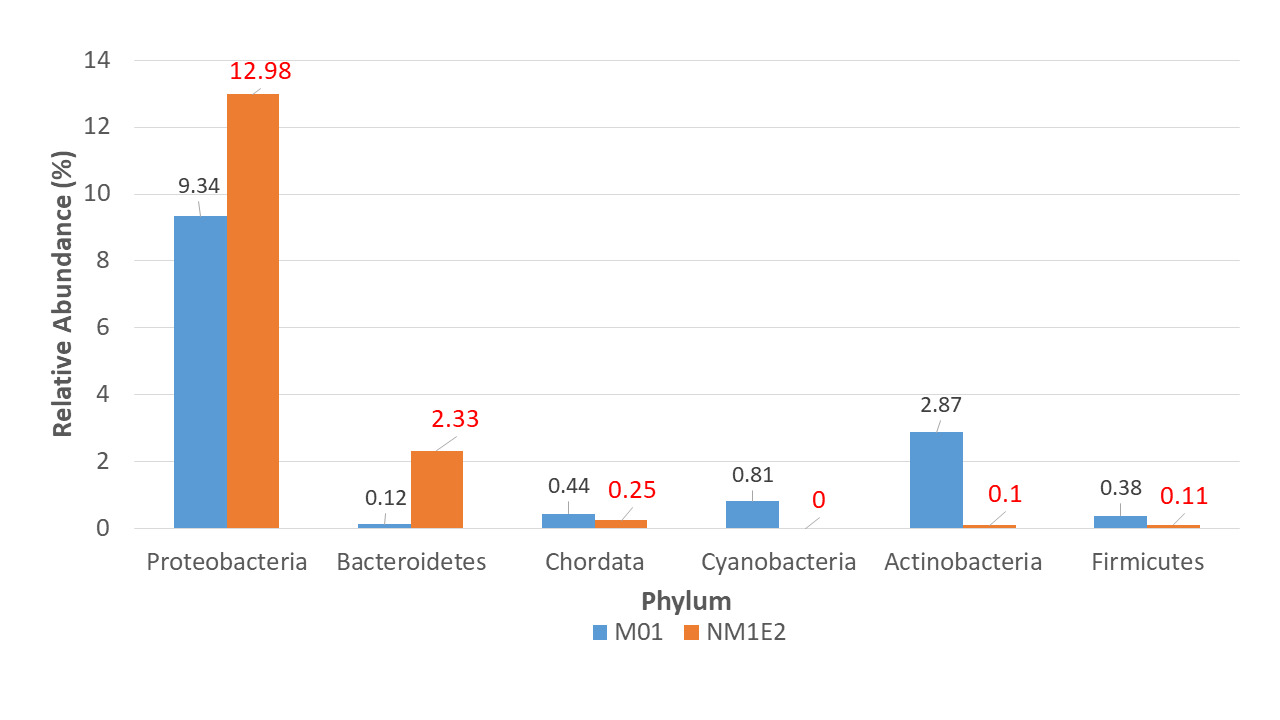
The significant presence of Bacteroidetes in sample NM1E2, mainly due to the genus Flavobacteria (0.25%, supplementary document 2), could be associated with the accumulation of organic matter and potential disease risk in aquaculture environments.18 In contrast, Actinobacteria were dominant in M01, reflecting a microbiota specific to environments rich in organic matter and with an ability to participate in the decomposition and recycling of nutrients. This result consistent with the description of Goodfellow et al.,19 where Actinobacteria accounted for more than 10% of the total sediment microbiota. The result suggested that the change in microenvironmental conditions – from a potentially eutrophic state in NM1E2 to a more organically active state in M01 – might have a direct impact on microbial community structure and thus on livestock health.
Gammaproteobacteria Composition
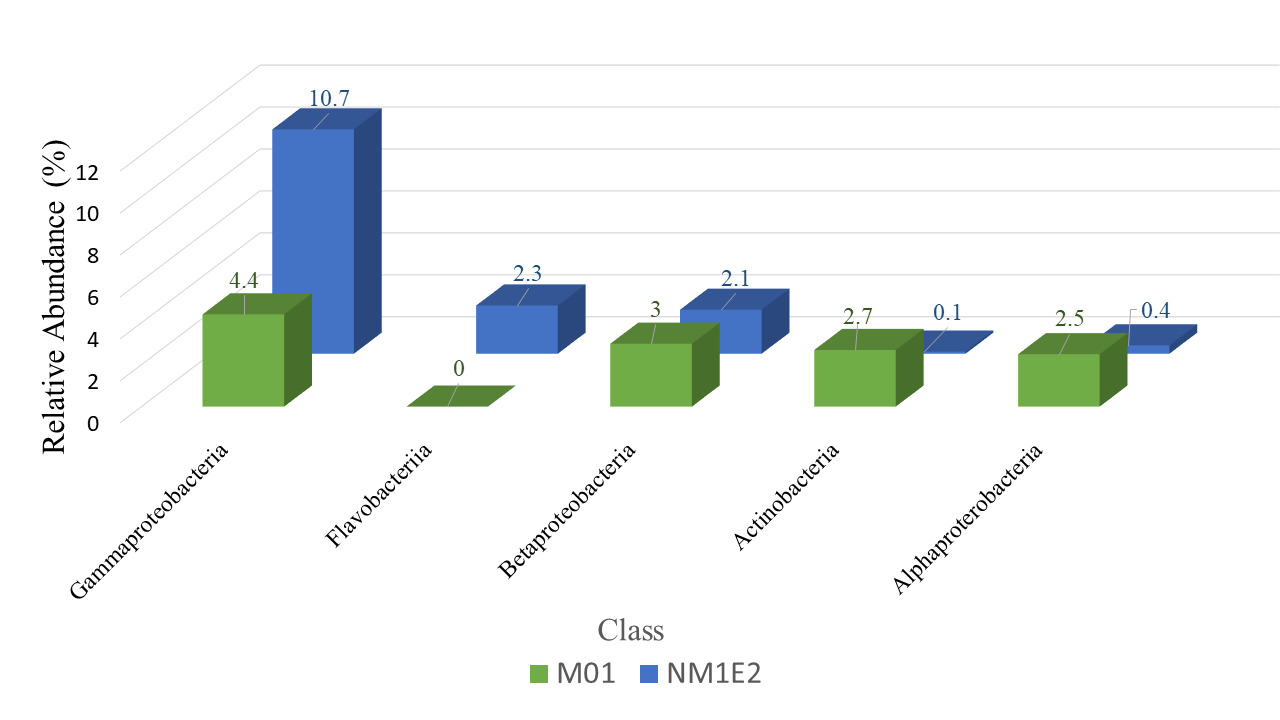
At the class level, taxonomic comparison between the two samples revealed distinct shifts in microbial composition (Fig. 6). The class Gammaproteobacteria, a major subgroup within the phylum Proteobacteria, exhibited a substantial increase in relative abundance from 4.4% in sample M01 to 10.7% in NM1E2. This result suggested a possible expansion of taxa within this class in NM1E2.

In contrast, other classes within Proteobacteria which were often associated with environmentally stable or mutualistic bacterial groups, such as Alphaproteobacteria (~2.5% in M01 vs. ~0.4% in NM1E2) and Betaproteobacteria (~3% in M01 vs. 2.1% in NM1E2), were relatively more abundant in M01. The decrease of these classes in NM1E2 would reflect ecological disruption of the sample (Pini et ral., 2011, Kaushik et al.20).
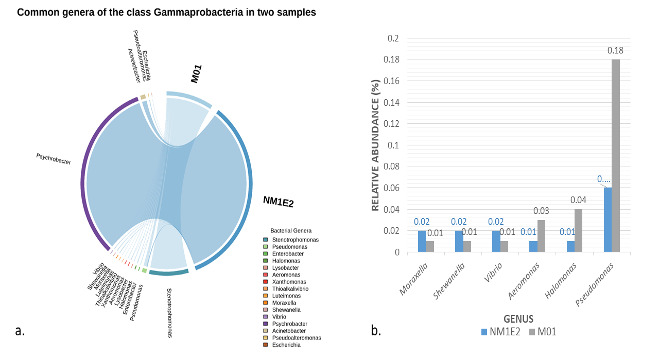
Further analysis in the Gammaproteobacteria – major subgroup in phylum Proteobacteria (Fig. 6), six genera had been consistently detected in both samples (Fig. 7), although the proportions varied. Among them, Pseudomonas was the most abundant (0.18% in M01 vs. 0.06% in NM1E2). Pseudomonas species had been known for their ability to degrade a wide range of organic matter, from PAHs, hydrocarbons to plastics, thanks to their rich oxidative enzyme network and their ability to form protective biofilms, which help them survive in polluted and organic-rich environments. They were also active in the phosphorus cycle (P-accumulators), supporting nutrient processing in aquatic systems.21,22
_and_relative.png)
The remaining genera such as Halomonas, Aeromonas, Vibrio, Shewanella, and Moraxella, although presented at low levels (0.01–0.04%) (Fig.7b), all had important ecological roles. Shewanella metabolized metals such as manganese, iron, uranium, etc., contributed to geochemical cycles, and helped reduce toxicity in mud ecosystems23; Vibrio and Aeromonas often related with diseases in aquatic animals and were presented in large numbers in waters rich in organic matter or showing signs of pollution; Moraxella also noted to be present in the process of hydrocarbon decomposition; Halomonas specialized in high salinity environments.24,25
The functional diversity of these genera such as organic matter decomposition, nutrient cycling, metal toxicity reduction and pathogenicity, allowed Gammaproteobacteria to become the dominant microbial group in aquaculture mud environments. The predominance of Pseudomonas in M01 would reflect a more organic humus-rich environment, which encouraging the growth of species with efficient biodegradation and nutrient cycling capabilities. Meanwhile, the lower abundance in NM1E2, where organic matter was less concentrated, still maintained the presence of genera necessary for microbial ecosystem balance.
Despite their low relative abundances, the presence of Aeromonas and Vibrio in both samples raised attention, as these genera were widely recognized as potential pathogens in shrimp aquaculture systems.26,27 Their detection within the lichen-like biofilm sample (NM1E2) surged questions regarding the possible role of such substrates as reservoirs or vectors for opportunistic bacteria.
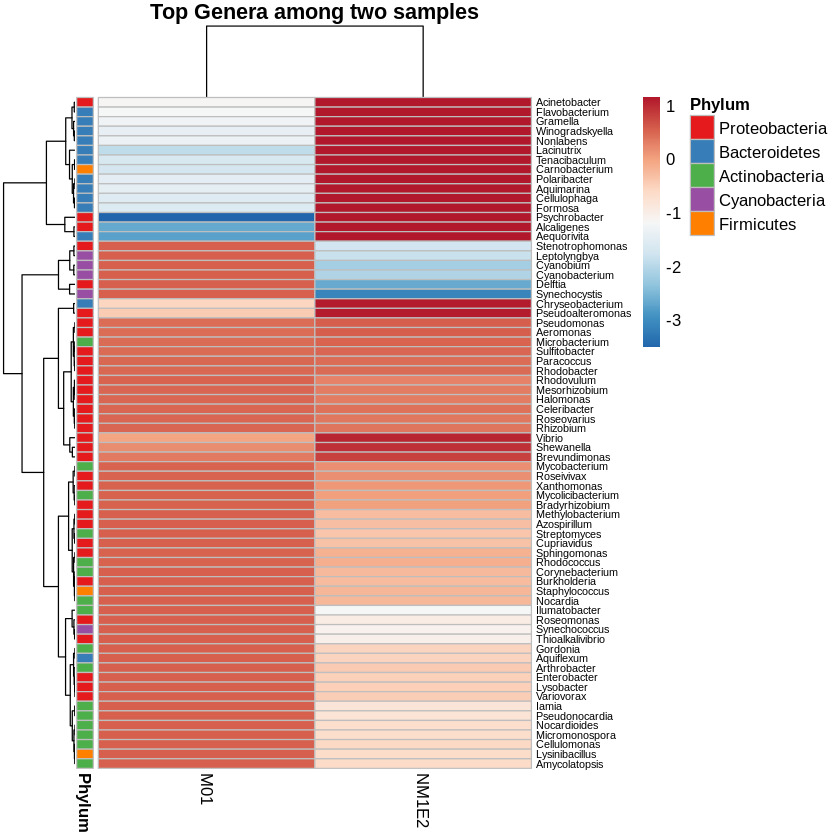
Differential Taxonomic Distribution Revealed by Heatmap Analysis
To assess the variation in bacterial community composition between samples, a heatmap of the top genera based on log-transformed and Z-score standardized relative abundance data were generated. This transformation was performed across rows (i.e., within genera), allowing visualization of deviations relative to each genus’s average across samples. Hierarchical clustering was applied to both taxa and samples to reveal compositional relationships. Genera were annotated by phylum to provide taxonomic context (Fig. 8).

To identify genera of particular interest, we applied a threshold on the standardized abundance scores, selecting taxa with values exceeding -0.5 in at least one sample. Based on this criterion, two genera Aeromonas and Vibrio were retained for further species-level investigation. These genera were known to contain multiple species of relevance to shrimp aquaculture, prompting focused downstream analysis.
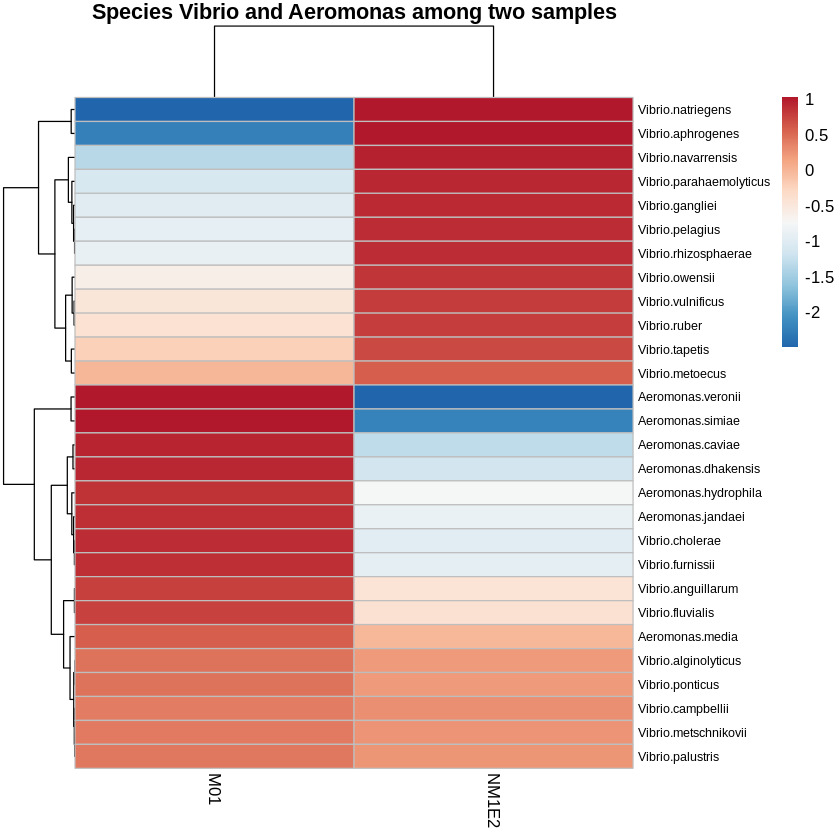
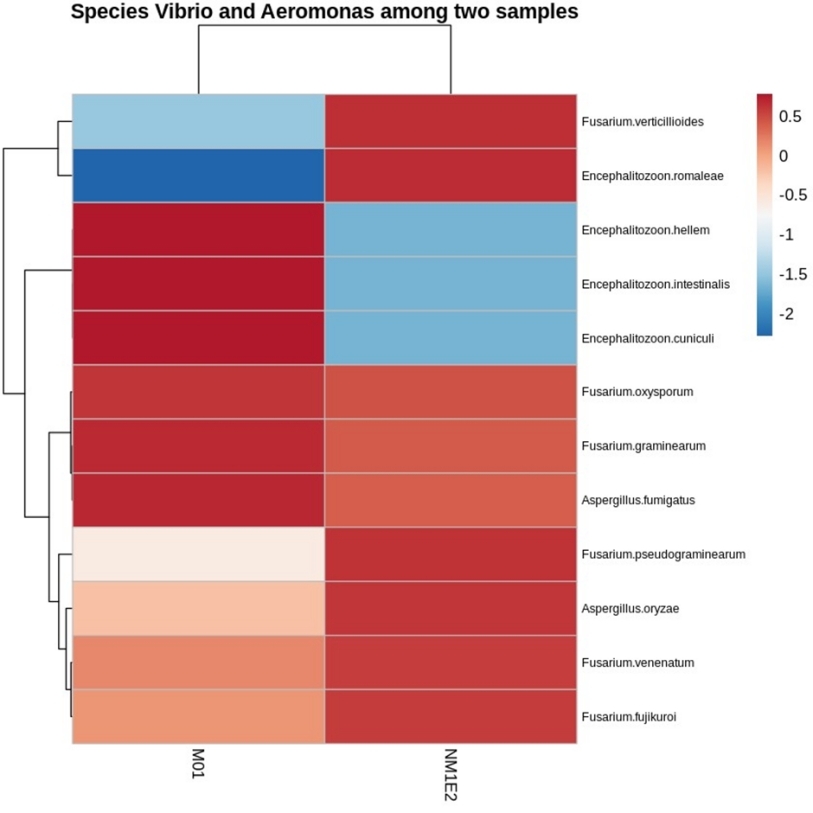
Vibrio and Aeromonas - potential candidates for shrimp pathogens
From the genus-level taxonomic heatmap (Fig. 9), species-level refinement was performed to identify potential pathogenic taxa (Z-score >-0.5) present within both samples collected from shrimp aquaculture ponds exhibiting disease signs. This approach yielded several candidate species of interest: Vibrio alginolyticus, V. campbellii, V. metschnikovii, V. metoecus, V. ponticus, V. palustris, Aeromonas media, V. vulnificus, V. ruber, V. tapetis, V. anguillarum, and V. fluvialis.

Among these, V. alginolyticus and V. campbellii were well-understand shrimp pathogens, frequently implicated in vibriosis and larval mortality.26,27 Aeromonas media, although primarily accompanying with freshwater environments, had been reported as an opportunistic pathogen under stress-inducing conditions. The remaining Vibrio species - V. metschnikovii, V. metoecus, V. ponticus, and V. palustris - were not commonly regarded as primary pathogens in shrimp, but their detection in our samples suggested potential ecological or opportunistic roles that merit further investigation.
While abundance-based screening alone could not establish pathogenicity, the use of a Z-score normalization strategy enabled the identification of relatively enriched taxa across both suspected sources. These findings supported the hypothesis that lichen-like biofilm aggregated in shrimp ponds might serve as reservoirs for bacteria of pathogenic potential, providing a focused list of candidates for downstream validation of virulence factors and functional gene content.
Fungus community - Composition of the main Phylum
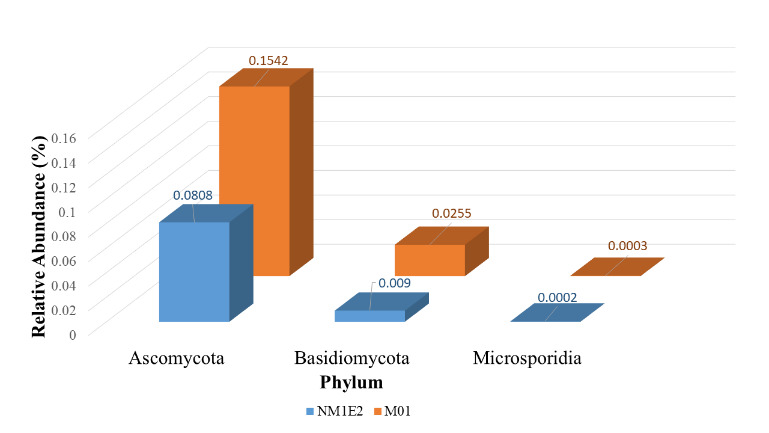
In addition to bacterial taxonomic profiling, fungal communities were analyzed separately to investigate their potential involvement in the composition and ecological function of the lichen-like samples from shrimp ponds. Taxonomic classification at the phylum level revealed that both samples were dominated by members of the phylum Ascomycota, comprising 0.1542% in M01 and 0.0808% in NM1E2 of classified reads, respectively (Fig. 10). Ascomycota was the largest fungal phylum and included most known lichen-forming fungi, as well as numerous saprotrophic and opportunistically pathogenic species.28,29
_and_(nm1e2)._the_ascomycota_p.png)
The second most abundant phylum was Basidiomycota, with lower relative abundances of 0.0255% in M01 and 0.0090% in NM1E2. Additionally, low levels of Microsporidia (0.0033% in M01; 0.0012% in NM1E2) were detected. Microsporidia were obligate intracellular fungi, had been known to infect aquatic invertebrates, including crustaceans such as shrimp.30
The predominance of Ascomycota across both suspected lichen-like samples supported the hypothesis that they would involve lichenized fungal components. Given their ecological relevance and potential opportunistic behavior, Ascomycota was selected for further taxonomic resolution at the genus and species levels to explore possible links to shrimp health deterioration.
To identify fungal genera with potential biological relevance in the suspected lichen-like samples, standardized abundance data (Z-score) were examined across both samples. A threshold of -0.5 was applied to retain genera with relatively elevated standardized abundance in at least one sample. Based on this criterion, three genera - Fusarium, Encephalitozoon, and Aspergillus - were identified as candidates of interest due to their relative enrichment in the fungal community (Fig. 11).
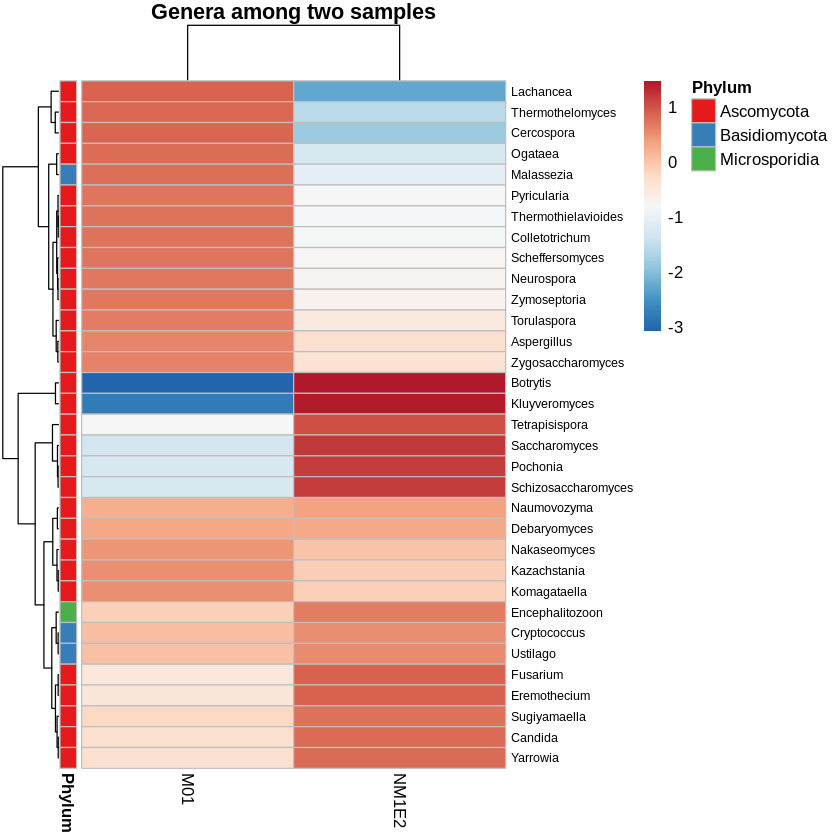
Fusarium had been known that they linked to infections in shrimp and other aquatic organisms. Particularly, F. solani had been implicated in soft tissue necrosis and shell disease in crustaceans. Aspergillus, although more commonly associated with terrestrial hosts, had also been detected in diseased shrimp and hatchery environments, suggesting a possible opportunistic role under stress or poor water conditions.29
Encephalitozoon belonged to the Microsporidia, a group of obligate intracellular fungal-related pathogens, and had been linked to chronic infections in shrimp, including growth retardation and hepatopancreatic lesions.30 The consistent detection and elevated abundance of these genera in both sediment and biofilm samples suggested a potential ecological role, either as opportunistic pathogens or as part of dysbiotic microbial communities connected with shrimp health deterioration.
Fusarium oxysporum with Potential Implications for Shrimp Health
Fungal species-level profiling revealed multiple taxa with elevated standardized abundance in both environmental samples, particularly within the genera Fusarium, Aspergillus, and Encephalitozoon (Fig. 12). Among these, Fusarium oxysporum was consistently detected with high standardized abundance across both samples, meeting the pre-defined selection threshold (Z-score > -0.5).
.jpeg)
F. oxysporum was best known as a plant pathogen but had also been reported in aquatic environments and would linked with diseases in shrimp. Several studies detected Fusarium spp., including F. oxysporum, in shrimp exhibiting soft tissue necrosis, exoskeletal lesions, and reduced immune responses.29 The detection of F. oxysporum in our samples raised concern over its potential role as an opportunistic pathogen or indicator of dysbiosis.
Although the presence of F. oxysporum was not in itself sufficient to conclude its pathogenic role, the presence of other prominent fungi such as Aspergillus fumigatus and Encephalitozoon spp. under regular frequency suggested that the fungal component of the pond sludge microbiota deserved greater investigation regarding shrimp health. These fungal genera had also been shown in the past to be ubiquitous in aquaculture environments. For example, Fusarium, Aspergillus, and Penicillium were common fungal genera in shrimp pond water and sludge samples, with some of them being capable of toxin or extracellular enzyme production that could affect the animals. In addition, A. fumigatus had been identified to be the fungi able to trigger immune responses or tissue damage in aquatic animals, especially in conditions where environment were unstable.31 Alternatively, Encephalitozoon spp. belonging to the microsporidia group had been identified in pathology cases of shrimp and other crustaceans.32
Combined with the results of the present study, it suggested that fungal members in microbial community would play a more important role in shrimp pond pathology than ever thought before.
Comparative genome assembly, pathogen distribution, and functional potential
Shotgun metagenomic assembly statistics highlighted the apparent structural differences between M01 and NM1E2 microbial populations. M01 generated 492,199 contigs of size ≥500 bp with an assembly length of ~593.7 Mbp, while 44,080 contigs and ~58.6 Mbp for NM1E2, suggested higher microbial diversity and genomic complexity in the sediment. In contrast, NM1E2 had greater assembly continuity, a greater N50 (1,584 bp vs. 1,364 bp), greatly greater auN (37,093 vs. 7,015.7), and a largest contig size of 688,721 bp (vs. 422,112 bp for M01) (Table 6). GC content between samples differed sharply (62.65% for M01 vs. 48.33% for NM1E2), consistent with the dominance of GC-rich sediment-dwelling bacteria in M01 and lower-GC species such as Vibrio spp. and fungi in NM1E2. Both assemblies contained no ambiguous bases, which guaranteed high downstream data quality analysis.
Bowtie2 read mapping to reference genomes revealed niche-specialized pathogen relative increase in proportion (Table 7). Vibrio alginolyticus experienced nearly comprehensive genome coverage (>99.9%) in both samples but was drastically more abundant in NM1E2, with chromosome 2 reaching ~80× coverage compared to 18.35× in M01. Similarly, Vibrio campbellii was concentrated in NM1E2 (75.28× for chromosome 1 and 40.11× for chromosome 2) over M01 (17.34× and 10.30×, respectively), and low-copy plasmids were present only in NM1E2, suggested carriage of mobile virulence or resistance determinants. Alternatively, Fusarium oxysporum was highly enriched in M01 with broad coverage over 14 of 18 chromosomes—particularly accessory chromosomes CP128286.1 (183.69×), CP128294.1 (174.44×), and CP128297.1 (318.29×)—and NM1E2 exhibited lower coverage over five chromosomes. These resutls supported ecological segregation of pathogens wherein Vibrio spp. possess biofilm-like aggregates and F. oxysporum dominate sediment.
Functional annotation of Vibrio-associated contigs revealed prominent features related to virulence, adaptation, and genome plasticity. Some Mu-like prophage genes (gp28, gp29, gpT, Mu DNA-binding protein, phage virion morphogenesis proteins) were identified that indicate active lysogenic phage elements with a potential for horizontal gene transfer and enhanced pathogenicity. Motility-associated genes, including flagellar hook protein FlgE and hook-associated scaffolding proteins, were detected—in line with surface colonization behavior in V. alginolyticus and V. campbellii. Stress adaptation genes such as Na⁺/H⁺ antiporters (osmoregulation), universal stress proteins, and DNA repair enzymes were present, suggesting tolerance under changing pond conditions. As a whole, the findings suggested that dominant Vibrio populations in NM1E2 had genetic traits that could augment persistence, pathogenicity, and adaptation within aquaculture systems, and F. oxysporum was a common sediment-borne fungal pathogen.
Conclusion
Our study revealed a rich microbial population in lichen-like samples which collected from disease shrimp farms. The difference in ratio of taxa in each sample due to the position of sampling but they had quite similar types of microoganism. There was dominance of Vibrio species—majorly V. alginolyticus and V. campbelli—in sample collected at floating tool and facilities inside shrimp ponds (NM1E1). The sample collected near the bottom of the pond after finishing the shrimp culture (M01) revealed dense enrichments of F. oxysporum, a fungus that would linked with aquatic animal diseases. Its frequent presence along with other opportunistic fungi such as Aspergillus and Encephalitozoon suggested a potential though under-researched role of the fungal community in the deterioration of shrimp health. These findings highlighted the need for additional functional and histopathological research to establish the viability of both bacterial and fungal elements to disease in aquaculture systems.
Future studies should expand the number of analyzed samples and include shrimp aquaculture ponds from diverse geographic regions across Vietnam to capture broader microbial variability and environmental influences. Additionally, the insights gained from this study could be applied to develop microbiome-informed management strategies aimed at improving the microbial balance in shrimp ponds. Such approaches might enhance disease resistance and overall productivity in aquaculture systems, contributing to more sustainable shrimp farming practices nationwide.
Acknowledgments
This study was partial supported by the project TNUE-2024-15 from University of Education, Thai Nguyen University. The authors thank to the colleagues from University of Science and Technology of Hanoi and International Center of Physics, Institute of Physics, Vietnam Academy of Science and Technology for providing the place of storage sample as well as helpful advice in sampling and analysis of data.
Authors’ Contribution
Conceptualization: Luong T. Vu (Equal), Huyen T.M. Nguyen (Equal). Formal Analysis: Luong T. Vu (Equal), Huyen T.M. Nguyen (Equal). Investigation: Luong T. Vu (Equal), Huyen T.M. Nguyen (Equal). Writing – original draft: Luong T. Vu (Equal), Huyen T.M. Nguyen (Equal), Linh T. Phung (Equal). Funding acquisition: Luong T. Vu (Equal), Hiep P. Hoang (Equal). Writing – review & editing: Huyen T.M. Nguyen (Equal), Linh T. Phung (Equal), Sang V. Nguyen (Equal). Supervision: Huyen T.M. Nguyen (Equal), Sang V. Nguyen (Equal). Methodology: Hiep P. Hoang (Equal), Thanh V.N. Nguyen (Equal), Lien T.H. Nghiem (Equal). Resources: Lien T.H. Nghiem (Equal), Hao M. Do (Equal), Mai Q. Nguyen (Equal).
Competing of Interest – COPE
The authors declare no competing interests in this research.
Ethical Conduct Approval – IACUC
Sample collection was conducted with the consent of farm owners. No endangered or protected species were involved, and no specific ethics approval was required under Vietnamese regulations for environmental sampling in aquaculture ponds.
Informed Consent Statement
All authors and institutions have confirmed this manuscript for publication.
Data Availability Statement
All are available upon reasonable request.