

INTRODUCTION
Xinjiang’s vast territory and long geological history have shaped a unique pattern of water systems distribution. The Kaidu River, Turks River, Emin River, and Manas River are four highly representative rivers that collectively sustain the region’s ecology and development. These four rivers provide important opportunities for studying species genetic differentiation, geographic isolation, and evolutionary mechanisms. These four rivers provide crucial hydrological and habitat gradients for investigating species genetic differentiation, geographic isolation, and evolutionary mechanisms. The Kaidu River is recharged by a combination of glacial meltwater and precipitation, exhibiting marked seasonal runoff variations.1 The Turks River is primarily supplied by alpine snow and ice melt, leading to concentrated summer runoff, high water quality, and a relatively steep channel gradient.2 The Emin River is a typical seasonal river characterized by strong spring and summer floods events.3 As the largest river on the southern margin of the Junggar Basin, the Manas River is heavily influenced by irrigation activities, frequently experiences flow interruptions during winter.4
Gymnodiptychus dybowskii is a cold-water fish belonging to the genus Gymnodiptychus, subfamily Schizothoracinae, family Cyprinidae, order Cypriniformes. It is distributed in the river basins of the Kaidu, Turks, Emin, and Manas Rivers in Xinjiang.5 Due to factors such as climate change and overfishing, its natural population has declined rapidly. In 2022, the species was listed as a Class I Key Protected Aquatic Wildlife in Xinjiang.
In this study, G. dybowskii, a cold-water fish endemic to Xinjiang and restricted to only three major inland river systems (the Tarim River, Ili River, and Junggar Basin) was selected as the research subject.2 Molecular phylogeographic analyses have demonstrated that populations from these three river systems form independent, mutually monophyletic evolutionary lineages, indicating that G. dybowskii represents a regionally endemic and plateau-adapted fish.6 Wild populations were systematically sampled from the four major river basins: the Kaidu, Turks, Emin, and Manas Rivers. A combination of morphometric methods and quantitative statistical analysis was applied to conduct a comprehensive and precise comparison of external morphological differences among geographically distinct populations. This study evaluates morphological divergence in G. dybowskii across four river systems and examines its correlation with geographic and environmental factors to infer evolutionary drivers. The results provide baseline data on understanding adaptive variation in this high-altitude specialist species.
Materials and Methods
Sample Collection
From 2020 to 2021, 10 specimens of G. dybowskii were collected from the Kaidu River (K, E81°55′, N44°16′), 18 specimens from the Turks River (T, E80°55′, N43°21′), 24 specimens from the Emin River (E, E84°31′, N47°05′), and 35 specimens from the Manas River (M, E86°13′, N44°30′). After completing on-site biological measurements, the collected samples were fixed in formalin and transported back to the laboratory. The sampling work for this study was approved by the Special Permit for Catching Aquatic Wildlife of the People’s Republic of China.
Methodology
Morphological Indicators
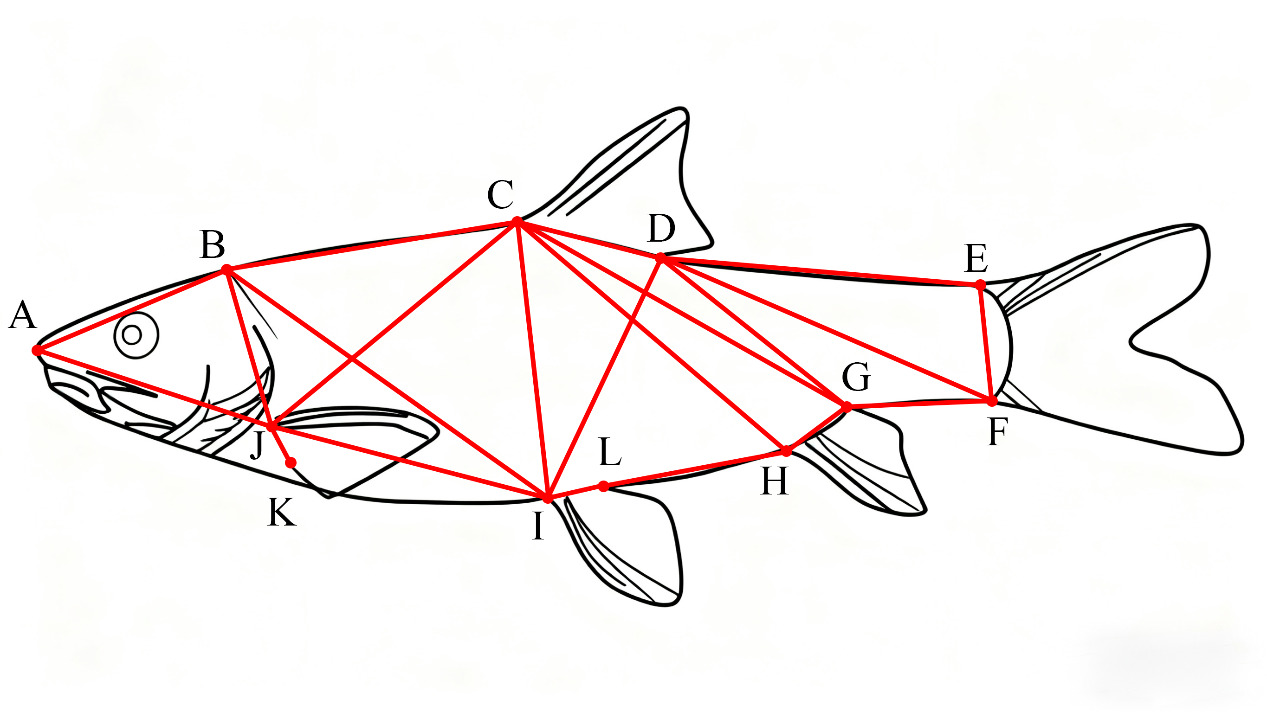
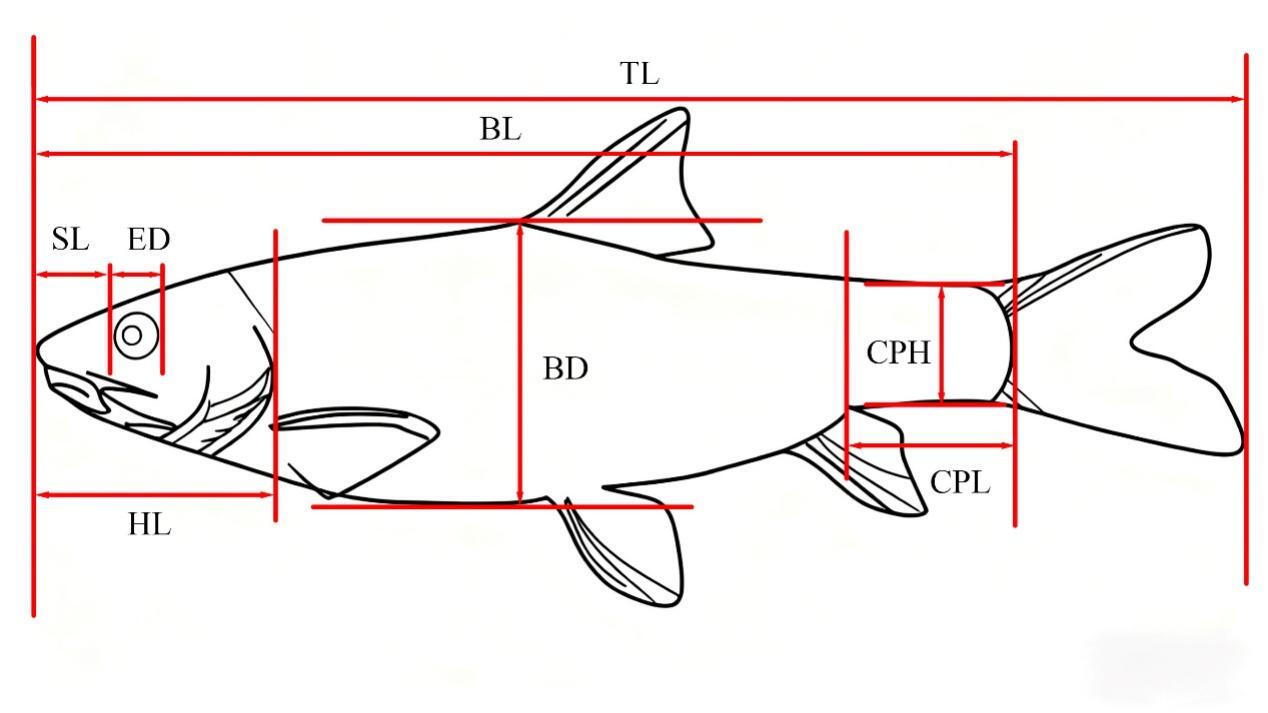
Traditional morphological measurements and the frame method were used to measure the total length (TL), body length (BL), body depth (BD), body width (BW), head length (HL), snout length (SL), eye diameter (ED), eye interval (EI), mouth cleft (MC), pectoral fin length (PFL), pelvic fin length (PvFL), anal fin length (AFL), caudal peduncle length (CPL), and caudal peduncle height (CPH) were also measured.7 (Figure 1 and 2)

Thirty-four measurement indicators were selected, as detailed below: A1 (TL/BL), A2 (BD/BL), A3 (BW/BL), A4 (HL/BL), A5 (SL/BL), A6 (ED/BL), A7 (EI/BL), A8 (MC/BL), A9 (CPL/BL), A10 (CPH/BL), A11 (AB/BL), A12 (BC/BL), A13 (CD/BL), A14 (DE/BL), A15 (EF/BL), A16 (HF/BL), A17 (HI/BL), A18 (JI/BL), A19 (AJ/BL), A20 (AI/BL), A21 (BJ/BL), A22 (BI/BL), A23 (AC/BL), A24 (CJ/BL), A25 (CI/BL), A26 (CH/BL), A27 (CF/BL), A28 (DI/BL), A29 (DH/BL), A30 (DF/BL), A31 (EH/BL), A32 (PFL/BL), A33 (PvFL/BL), and A34 (AFL/BL).
A digital Vernier caliper (CD67-S15PS) was used to measure the length (accuracy:0.01 mm).
Morphological Analysis
A one-way ANOVA was used to assess the significance of morphological differences among the geographic populations at a significance level of 0.05. Prior to one-way ANOVA, Levene’s test was applied to all morphological measurement variables to assess the assumption of homogeneity of variances. Based on the results of Levene’s test, an appropriate post-hoc multiple comparison method was selected for variables showing significant group effects in the ANOVA. LSD test was used when the assumption of homogeneity was met, whereas Tamhane’s T2 test was applied when variances were unequal.8 Principal component analysis (PCA) was conducted to extract principal components from the covariance matrix, calculate the contribution rate of each component, and generate principal component scatter plots.9
Discriminant analysis was applied to all proportional data. By screening parameters critical to population level morphological variation, a discriminant function was constructed.
Data Processing
To eliminate the influence of individual size variation on morphological parameters, 34 morphological variables were standardized using body length, yielding 34 sets of proportional measurement data.
Standardized~trait=Original~traitBody length (BL)
Statistical analysis were performed using SPSS 27.0 and Origin 9.0 software, and the results were expressed as “mean ± standard deviation”.
RESULTS
One-Way ANOVA
The one-way ANOVA showed significant population-level variation in sixteen proportional traits. Thirteen traits (A3, A5, A6, A8, A9, A18, A25, A28, A29, A31, A32, A33, A34) exhibited highly significant differences (p < 0.01), while three traits (A13, A17, A27) showed significant differences (p < 0.05) (Table 1).
Principal Component Analysis
The dataset showed strong suitability for principal component analysis, with a KMO value of 0.856 (> 0.600) and a significant Bartlett’s test of sphericity (p < 0.01), indicating that the correlation matrix was appropriate for factor extraction (Table 2). These results confirm that PCA is suitable for analyzing morphological variations among the geographically isolated populations of G. dybowskii in Xinjiang.
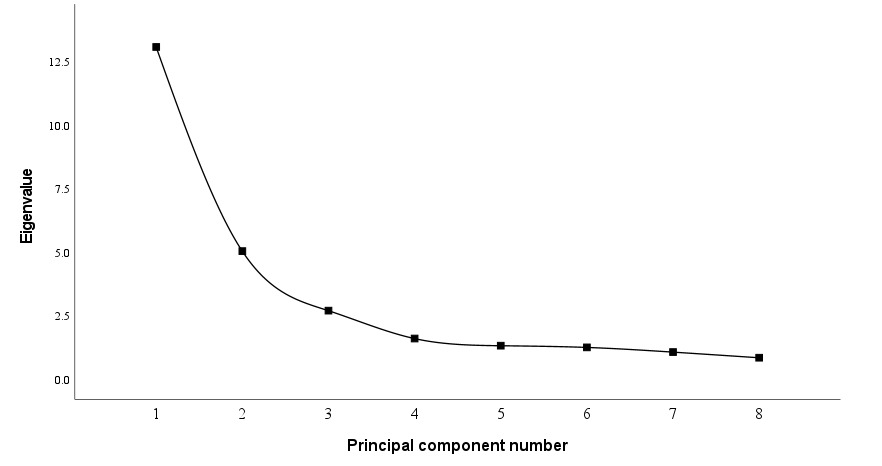
As shown in Figure 3, after the third principal component, the eigenvalues of the principal components tended to stabilize. Therefore, the first three principal components (PC1~PC3) were selected for analysis.

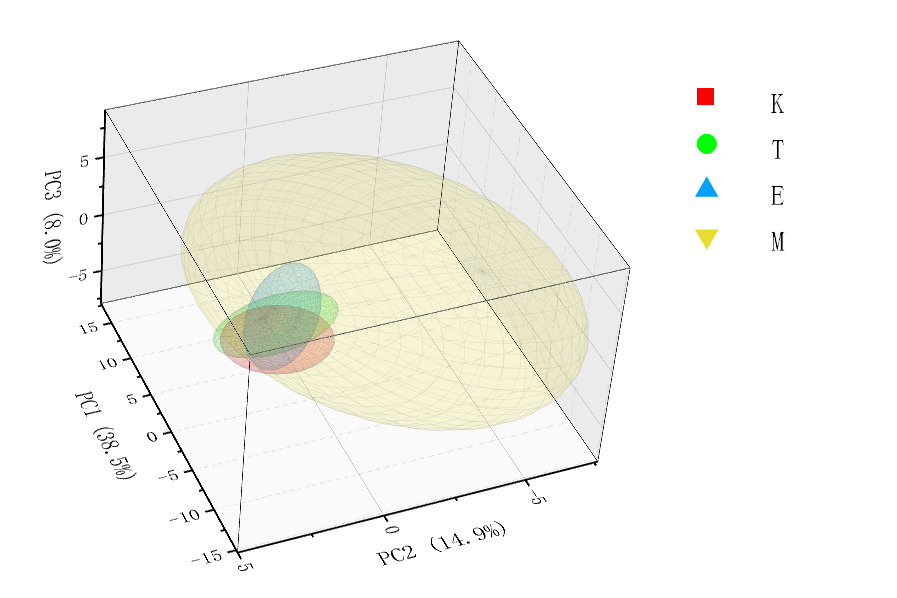
The first three principal components explained 38.50%, 14.87%, and 7.97% of the total variance, respectively, accounting for 61.34% cumulatively. PC1 was dominated by trait A23, indicating its major role in overall morphological variation. PC2 was primarily influenced by A6, A9, A32, A33, and A34, while PC3 was characterized by contributions from A16, A17, A19, A25, and A32.
In Three-Dimensional Spatial Distribution Map (Figure 4), Population M shows the largest proportion, has the widest distribution range, and exhibits relatively high dispersion. In contrast, populations E, K, and T are relatively concentrated in their distribution, show partial overlap, and exhibit relatively low dispersion.
Discriminant Analysis
The stepwise discriminant analysis method was applied to identify the 34 morphological proportional traits that best distinguished the four geographically isolated populations (Table 3). Seven eigenvalues (A5, A6, A8, A9, A21, A27, and A34) with significant discriminant contributions were screened out, which were sequentially denoted as X₁–X₇. Subsequently, discriminant formulas were established for the Kaidu River (YK), Turks River (YT), Emin River (YE), and Manas River (YM) populations.
YK=
-118.081-201.047X1+341.868X2-70.563X3+764.908X4
+610.052X5-27.667X6+17.908X7
YT=
-115.779-50.414X1+338.116X2-64.487X3+752.525X4
+750.558X5-91.160X6+44.669X7
YE=
-101.651-107.486X1+129.158X2-74.274X3+719.104X4
+620.169X5-43.004X6+50.674X7
YM=
-55.580-5.327X1+258.427X2+51.615X3+59.078X4
+432.525X5+43.490X6-48.359X7
Using the discriminant equation, the variables of each specimen were classified into their respective populations. The overall classification accuracy for populations K and M was 100%, while population T and E showed slightly lower accuracies of 88.9% and 87.5%, respectively. These results indicate generally strong discriminative power among the four populations, although some overlap persists between T and E specimens.
DISCUSSION
Morphological variation across geographic ranges is a widespread phenomenon in fishes. For instance, in the marine brown rockfish (Sebastiscus marmoratus), significant inter-population divergence in traits such as caudal peduncle length and head size has been associated with adaptive responses to different habitats.10 Similarly, pelagic species such as Trachurus picturatus also exhibit body shape variation correlated with environmental gradients.11 This pattern is often more pronounced in freshwater fishes, where geographic isolation and habitat specificity are stronger. In freshwater systems, studies on Schizothorax o’connori in the Yarlung Tsangpo River have documented substantial morphological differentiation among ten populations, attributed to geographic isolation and local adaptation.12 Likewise, populations of Gymnocypris chilianensis from three inland river systems show significant divergence, particularly in trunk and tail morphology. Similar inter-population morphological variation has also been reported in other cyprinids, including Ptychidio jordani and Garra orientalis.13,14 Collectively, these studies demonstrate that morphological differentiation represents a common evolutionary response of fishes to spatially variable environmental pressures.
Divergence in feeding-related traits, such as A5, A8, and A6, often reflects adaptation to different trophic resources. The size and shape of feeding structures, particularly mouth gape, often vary across habitats in response to local environmental conditions and dietary niches. Fish occupying distinct habitats therefore exhibit pronounced differences in mouth gape morphology, driven by habitat-specific feeding requirements.15–22For example, in Coregonus lavaretus, divergence in gill raker number and head shape among ecotypes is directly linked to dietary specialization.23 This cross-taxonomic evidence supports the interpretation that the observed variation in A5, A6, and A8 among G. dybowskii populations represent adaptive responses to differences in benthic prey availability across the studied watersheds.24 In addition, differentiation in body shape and fin traits associated with adaptation to flow regimes (such as body width A3, caudal peduncle length A9, pectoral and pelvic fin lengths A32, A33) follows predictable ecological rules.
Morphological traits associated with locomotion, such as A3, A9, A32, and A33, are subject to strong selective pressures imposed by hydrodynamic environments. Fish inhibiting high-flow conditions often evolve more fusiform body shapes and elongated caudal peduncles, which enhance swimming efficiency and reduce drag.16,25 This pattern is exemplified by riverine populations of Galaxias maculatus, which possess stouter body forms compared to their more fusiform lacustrine counterparts, reflecting adaptations to lotic versus lentic habitats.26 Tail morphology is closely associated with flow velocity, with species from high-velocity environments often having more elongated caudal peduncles than those from slower-flowing areas.27 These morphological traits are widely interpreted as functional adaptations to hydrodynamic demands, contributing to improved swimming efficiency and reduced energy expenditure.16,22,27–29 The functional importance of fin position traits related to swimming efficiency and body configuration (such as distance from dorsal fin origin to pelvic fin origin A25, distance from posterior dorsal fin base to anal fin origin A29, etc.) has been thoroughly elucidated in other fish biomechanical studies. Accordingly, the variation among G. dybowskii populations in traits including A25, A28, A29, and A31 may reflect habitat specific demands associated with swimming efficiency, energy allocation, and behavioral performance. In addition, significant inter-population differences (p < 0.05) were detected in three further traits (A13, A17, and A27). Overall, morphological differentiation within the same species is closely associated with variations in habitat type and environmental quality30
Principal Component Analysis (PCA) was performed to investigate morphological variation among populations. This method efficiently reduces dimensionality and extracts features, while presenting correlations, trends, and hierarchical importance among data points.18,31 The principal component analysis revealed that the primary axes of morphological variation (PC1 and PC2, cumulatively explaining 53.37% of variance) correspond to distinct adaptive dimensions. PC1, heavily loaded by traits like A23, primarily represents variation in overall body size and trunk elongation.32 Variation along PC1 may reflect differences in population-level energy allocation strategies, influenced by growth rates, age structure, or metabolic demands.33 This association of PC1 with general body size is commonly observed in fish morphological studies.34 In contrast, PC2 exhibited an ecologically informative loading pattern. Strong positive loadings were observed for pelvic fin length, caudal peduncle length, anal fin length, eye diameter, and pectoral fin length, whereas A5 and A8 showed negative loadings. The positive and negative loading spectra indicate adaptations for high-flow and structured habitats, respectively, and divergent feeding strategies.23 Traits at the positive-loading end (e.g., well-developed fins, longer caudal peduncle, larger eye diameter) indicate adaptation to high-flow or low-light environments, consistent with the “fast-flow adaptation syndrome” in fishes.25,35 This pattern is supported by observations in other species; for example, riverine populations of Galaxias maculatus and stream-dwelling sticklebacks develop more streamlined bodies compared to their lentic counterparts.36,37 Conversely, traits at the negative end (mouth gape, snout length) are closely associated with divergence in feeding ecology. This link is genetically based divergence in head morphology between marine and freshwater sticklebacks, as well as feeding morphology differentiation among whitefish ecotypes, exemplify adaptation to local prey resources.38,39 Overall, the dispersion of G. dybowskii populations along PC2 likely reflects distinct adaptive trajectories shaped by both hydraulic forces and prey availability in their respective river basins. This systematic morphological divergence is a classic outcome of geographic isolation combined with natural selection. The Tianshan Mountains impose physical barriers that severely restrict gene flow among these river basins, providing the foundational conditions for independent local adaptation.6,40
Discriminant analysis was widely used to identify fish species. This method involves progressively selecting several mutually independent indicators to establish a discriminant function. This allows similar species to be distinguished by measuring only a few relevant indicators.41 The discriminant function based on morphological traits achieved an overall classification accuracy of 94.3% across the four G. dybowskii populations. Populations K and M were accurately identified with 100.0% discrimination accuracy, while populations T and E were classified with 88.9% and 87.5%, respectively. These results highlight differences in discrimination performance among populations. The observed misclassification between populations T and E indicates a significant overlap in their morphological trait distributions. This overlap likely results from similar environmental factors exerting parallel selective pressures on traits such as body shape and fin morphology, leading to convergent morphological adaptations.42 Consequently, the model can distinguish them without error, providing crucial evidence for subsequent investigations into the differentiation process and ecological adaptability of these two populations.
CONCLUSIONS
This study confirms significant morphological divergence among geographically distinct populations of Gymnodiptychus dybowskii distributed across different hydrological environments. One-way ANOVA revealed significant differences across multiple functional traits. Principal component analysis revealed that PC1 primarily represents variation in overall body size and trunk elongation, whereas PC2 reflects differentiation associated with adaptation to local environmental conditions. A discriminant function based on seven key traits achieved an overall classification accuracy of 94.3%. These patterns of morphological divergence likely result from the combined effects of geographic isolation and local environmental pressures, providing a critical basis for identifying adaptive population units and formulating targeted conservation strategies for this species.
ACKNOWLEDGMENTS
Funding: This work was supported by the National Natural Science Foundation of China (32560894,31360635), and the Tianshan Talent Training Project of Xinjiang (2023TSYCCX0128).
AUTHORS’ CONTRIBUTION
Conceptualization: Kai Wang, Jieya Liu. Methodology: Kai Wang, Shengao Chen, Jieya Liu, Changcai Liu, Lipeng Che, Chi Zhang, Wenxia Cai. Formal Analysis: Kai Wang. Writing-original draft: Kai Wang. Writing-review & editing: Kai Wang, Shengao Chen, Bibi Sadia, Chengxin Wang. Funding acquisition: Shengao Chen, Yong Song. Resources: Shengao Chen, Bin Huo. Supervision: Shengao Chen.
COMPETING INTEREST - COPE
Declaration: We have no known competing financial interests or personal relationships that could have appeared to influence the work reported in this paper.
ETHICAL CONDUCT APPROVAL - IACUC
The animal study protocol was approved by the Science and Technology Ethics Committee of Tarim University (approval code: TDDKYXF 20200426).
INFORMED CONSENT STATEMENT
All authors and institutions have confirmed this manuscript for publication.
DATA AVAILABILITY STATEMENT
All are available upon reasonable request.