

Introduction
As a crucial pillar of the global food security system, modern fisheries play an indispensable role in ensuring food supply, promoting economic development, and achieving the sustainable use of resources. As a world fishery power, China’s fishery economic scale and industrial structure continue to be optimized. According to the US Department of Agriculture’s 《2025 China Fishery Products Report》, China’s total seafood product output in 2024 reached 74.1 million tons, an increase of 4.1% over the previous year, ranking first in the world for many years. This achievement not only provides strategic support for national food security but also makes important contributions to promoting fishermen’s income growth and sustainable marine ecological development. In this study, it refers to achieving a strategic transformation from scale expansion to a balance between quality, efficiency, and sustainability.
However, in the face of the new challenges brought by the approaching limit of resource and environmental carrying capacity, the reconstruction of the international fishery competition pattern and consumption upgrading, the traditional extensive development model has become weak. Against this background, fishery modernization construction urgently needs to achieve a strategic transformation from scale expansion to quality improvement. It is worth noting that the improvement of operating efficiency not only depends on capital investment and technological progress but also requires the system support of high-quality human capital. As a core element of enterprise production efficiency, management efficiency, and technological innovation capabilities, labor quality has become a key variable that restricts or drives the high-quality development of listed fishery companies.
At present, China’s fishery is in a critical window period for deep adjustment of industrial structure. Digital transformation and intelligent upgrades put forward compound capability requirements for practitioners: they need to have professional and technical literacy, but also master modern management thinking and innovative practical ability. However, industry research shows that there are still significant structural contradictions in human resources in the fishery field—practitioners have a low level of academic qualifications and a prominent gap in technical talents, and the proportion of people with bachelor’s degrees or above is significantly lower than that in advanced industries such as manufacturing. This imbalance in human capital allocation not only delays the transformation and application of advanced technologies but also weakens the core competitiveness of enterprises in cost control, market response, and green transformation.
Existing research focuses on fishery resource management policies or macro-industry analysis and lacks systematic evidence on the interaction mechanism between labor quality and operating efficiency at the micro level. Especially for the representative sample group of fishery-listed companies, a quantitative research framework based on corporate microdata has not yet been formed. Therefore, this paper selects Chinese A-share fishery listed companies as the research object and uses data envelope analysis (DEA) and Tobit models to empirically test the impact effect and path of labor quality on operating efficiency. The marginal contribution of this study is: (1) This study takes Chinese fishery listed companies as research samples, breaks through the sample limitations of traditional fishery research, links listed company efficiency with human capital theory, and provides a new perspective for understanding the human resource management mechanism of capital-intensive industries. (2) The research results of this paper not only help to reveal the role mechanism of high-quality human capital in the allocation of fishery resources but also provide decision-making reference for building a fishery talent cultivation system and improving incentive mechanisms. It has important theoretical value and practical significance for promoting the transformation and upgrading of the fishery industry and realizing the strategic goals of rural revitalization.
Literature review
As an important part of the global economy, fishery research mainly focuses on resource management, operational efficiency, sustainability, and policy impact (Asche et al., 2022).1 In recent years, with the excessive development of global fishery resources and the intensification of environmental pressure, scholars’ research on global fishery operation efficiency has shown a trend of evolution from macro to micro and static to dynamic in terms of methods, data, and perspectives. In the field of operating efficiency research, DEA has become the mainstream tool for measuring micro-efficiency in fisheries because it does not require preset functions and can handle multiple input-multiple output and variable returns to scale at the same time. The BCC model proposed by Banker et al. (1984)2 is widely used to evaluate pure technical efficiency and scale efficiency in fishing, processing, and breeding (Asche & Roll, 2013a).3 On this basis, the Malmquist index is further used to track the dynamic changes in technological efficiency and technological progress (Asche et al., 2022).1 At the sample level, early research has mostly focused on fishing fleets at the national or regional level, but in recent years it has clearly turned to micro-subjects such as listed companies and large breeding groups to reveal the interaction between capital structure, governance characteristics, and efficiency (Asche & Roll, 2013b).4 The selection of input-output indicators also tends to be refined: In addition to traditional inputs (labor, capital, fuel) and outputs (yield, output value), environmental externalities (carbon emissions, energy intensity, climate change) have begun to be included in the model to respond to the demands of sustainable governance (Hamdan & Othman et al., 2015).5 Research conclusions generally show that there is room for significant improvement in technical efficiency in all links of the fishery value chain (Samat & Goh et al., 2024)6; scale efficiency is differentiated due to resource constraints and policy quotas. In addition, digital transformation, cold chain infrastructure, and financial availability are considered new driving forces to improve efficiency (Rowan, 2023; Sun & Zhang et al., 2024).7,8
Labor quality, as a core element affecting economic development and industrial structure upgrading, has also received widespread attention from the academic community. Its impact on organizational efficiency and corporate performance has always been a core issue in the fields of economics and management. Traditional human capital theory believes that education level and skill reserves can significantly improve individual and enterprise productivity (Becker, 2002).9 Regarding the measurement of labor quality, scholars generally use academic qualification structures (such as the proportion of bachelor’s degrees or above), average years of education, or the proportion of skill certifications as agent variables (Acemoglu & Auto, 2011).10 With the upgrading of technology and industrial structure in recent years, the role of labor quality has also been further highlighted. Gong Jianjian (2013)11 pointed out that the improvement of labor quality can promote industrial upgrading through technology introduction, international trade outsourcing, and organizational changes. At the policy level, the academic community generally emphasizes the key role of education and training in improving labor quality. In knowledge-intensive industries such as information technology, finance, etc., high-quality labor can quickly absorb and apply cutting-edge knowledge, promote technological innovation and service optimization, and significantly improve the operational efficiency and economic benefits of enterprises. The OECD (2019)12 report pointed out that the improvement of vocational education and lifelong learning systems can effectively narrow the skill gap and alleviate structural unemployment problems. Omar & Saadon et al.'s (2018)13 empirical study of Egypt’s agricultural labor force also confirmed the complementary role of informal education in the improvement of labor quality in developing countries. It found that for every 10% increase in the popularity of basic education, farm management efficiency will increase by 7.2% accordingly.
To sum up, existing fishery research focuses on resource management, efficiency measurement, and sustainable paths. However, human capital, as a key element in improving corporate performance, has not received enough attention in the fisheries field. Therefore, this paper selects Chinese fishery enterprises as the research object to explore the impact and mechanism of labor quality on their operating efficiency, so as to respond to the urgent demand for high-quality labor in the process of global fishery transformation to a blue economy.
Research design
In the field of efficiency measurement, the academic community usually adopts the SFA of parametric methods and DEA based on non-parametric techniques. Compared with SFA’s modeling method, which relies on preset production functions, DEA, as a data-driven efficiency evaluation tool, builds production frontiers through linear planning methods, effectively avoiding the deviations caused by subjective function setting and significantly improving the objectivity and robustness of the evaluation results.
To systematically evaluate the operational efficiency characteristics of China’s fishery-listed companies, this paper employs the BCC model for static efficiency measurement. This model is based on the assumption of VRS, enabling more accurate capture of the economies of scale characteristics of fishery enterprises. On this basis, the Malmquist index model is used to track its dynamic evolution process, and the synergistic mechanism between technological progress and efficiency changes is analyzed from the perspective of total factor productivity. Finally, the Tobit regression model is used to empirically test the impact of labor quality on fishery-listed companies, and the limited dependent variable processing method is applied to reveal the internal relationship between high-quality human capital and the improvement of operational efficiency.
DEA-BCC model
DEA is a non-parametric method that can measure the relative efficiency of DMUs through linear programming techniques. Since the production activities of fishing enterprises involve the characteristics of multi-input and multi-output, and it is difficult to meet the assumption of constant returns to scale, this paper selects the BCC model proposed by Banker et al. (1984).2
The DEA-BCC model is premised on the assumption that there exist K DMUs Each DMU contains m types of inputs and n types of outputs, with the input vector denoted by and the output vector by Let the weight coefficient be represented as the parameter as and and denote the slack variables for inputs and outputs, respectively. The DEA-BCC model is then constructed as follows:
{min[θ−ε(e−TS−+e−TS+)]=Vminθs.t.∑ki=1λiXi+S−=θX0∑ki=1λiYi+S+=Y0∑λi=1,i=1,2,…,kS−≥0,S+≤0
In Formula (1), θ represents the efficiency value. When θ=1, the DMU is technically efficient; when θ<1, there is room for improvement. Moreover, the technical efficiency (CRS) is decomposed into pure technical efficiency (VRS) and scale efficiency (SCA), as in Formula (2).
CRS=VRS ×SCA
Among them, VRS reflects the internal management level of the enterprise under the existing technical conditions, namely, the efficiency of resource utilization; SCA reflects whether the enterprise is in the optimal scale state.
DEA-Malmquist model
The Malmquist Productivity Index (MPI) was first proposed by Malmquist in 1953,14 and in 1994, Fare et al. proposed combining this model with DEA. As an indicator for measuring efficiency changes in time series data, it captures efficiency changes of a unit by comparing its input-output relationships at two time points. Using observations at times t and t+1, MPI can be expressed via the distance function as shown in equations (3) and (4):
MPIti=Eti(xt+1,yt+1)Eti(xt,yt)
MPIt+1i=Et+1i(xt+1,yt+1)Et+1i(xt,yt)
In Equations (3) and (4), denotes the input vector of period t; stands for the output vector of period t; is the input distance function based on the technology of period t+1; and i represents full efficiency.
By processing the geometric mean of MPI, we can get:
MPIgi=√MPIti×MPIt+1i=√Eti(xt+1,yt+1)Eti(xt,yt)×Et+1i(xt+1,yt+1)Et+1i(xt,yt)
In Formula (5), is the input-output efficiency index (TFP). It can then be decomposed into:
MPIgi=√Eti(xt+1,yt+1)Eti(xt,yt)×√Eti(xt,yt)Et+1i(xt,yt)×Eti(xt+1,yt+1)Et+1i(xt,yt)
In Equation (6): represents technological progress (TE); represents technological efficiency change (EFF).
And the expressions of scale efficiency change (SE) and pure technical efficiency (PE) are, respectively:
SE=√Et+1vrs(xt+1,yt+1)Et+1crs(xt+1,yt+1)Et+1vrs(xt,yt)Et+1crs(xt,yt)×Etvrs(xt+1,yt+1)Etcrs(xt+1,yt+1)Etvrs(xt,yt)Etcrs(xt,yt)
PE=Et+1vrs(xt+1,yt+1)Etcrs(xt,yt)
In Equations (7) and (8), crs represents constant returns to scale, and vrs represents variable returns to scale.
Tobit model
The Tobit model belongs to a type of regression of restricted dependent variables. It refers to a model whose dependent variable is roughly continuously distributed on a positive value, but also contains a part of the observed value of 0, and whose probability of taking the value is positive. Since the efficiency values obtained through the DEA model are between 0 and 1, which is truncated data. If OLS is used, there will be a problem of effectiveness variance, and it cannot be estimated correctly, so the Tobit model is selected. Standard model such as Formula (9):
y∗={α+βx+ε,yi>00,yi≤0
i is the i-th enterprise (i=1, 2, …, 7). When take the value = actual value. When truncate at 0, is the constant term, is the independent variable vector, is the coefficient, and is the random perturbation residual term.
Variable selection and data description
Variable selection
Input-output indicators
According to the indicator selection principles of the DEA model and taking into account the availability and reliability of data, the input indicators are mainly selected from two aspects: long-term asset investment and operational investment. Specifically, we choose net fixed assets and operating costs as input variables. In terms of output, we select operating revenue and production volume that can comprehensively reflect profitability and production capacity as output indicators. The specific calculation is shown in Table 1.
Regression variables
-
Explained variable. This study draws on the research of Sun L (2024)8uses the comprehensive efficiency (CRS) obtained by the DEA-BCC model as the explained variable to construct the Tobit model for empirical research. The specific calculation software is DEAP2.1.
-
Explanation variable. At present, there are many studies on labor quality indicators, mainly focusing on representing the regional labor quality level through the average years of education and the proportion of college graduates to the number of employees (Laut, 2023; Liu Y, 2025).15,16 To scientifically measure the level of labor force quality (Lq), this article refers to existing literature and selects the average years of education, the proportion of technical personnel in enterprises, and per capita output in each province as the core evaluation indicators. The entropy weight method is used to determine the weights of each indicator, thus constructing a comprehensive labor force quality evaluation system, as shown in Table 2. The higher the value of this indicator, the higher the proportion of high-quality labor in the enterprise.
-
Control variables. To control for the influence of other factors, we reference the study by Sun L (2024)8 and incorporate multidimensional control variables into the regression model. These include firm size (Size), firm age (Age), total asset turnover (Tat), top shareholder concentration (Top1), proportion of independent directors (Indep), inventory turnover (Inv), capital intensity (Cr), and whether the city is a coastal city. Specific variable definitions are provided in Table 3.
Data description
This paper defines fishery-listed companies based on the 2012 edition of the China Securities Regulatory Commission. It selects listed companies with subdivided industries, such as fisheries, from all A-shares as the research object and excludes companies with both historical and latest statuses of ST. Finally, 7 companies are selected. Considering the availability and validity of the data, this study selects 2015-2024 as the research range, and a total of 70 observation samples are obtained.
Empirical results and analysis
Analysis of BCC model results
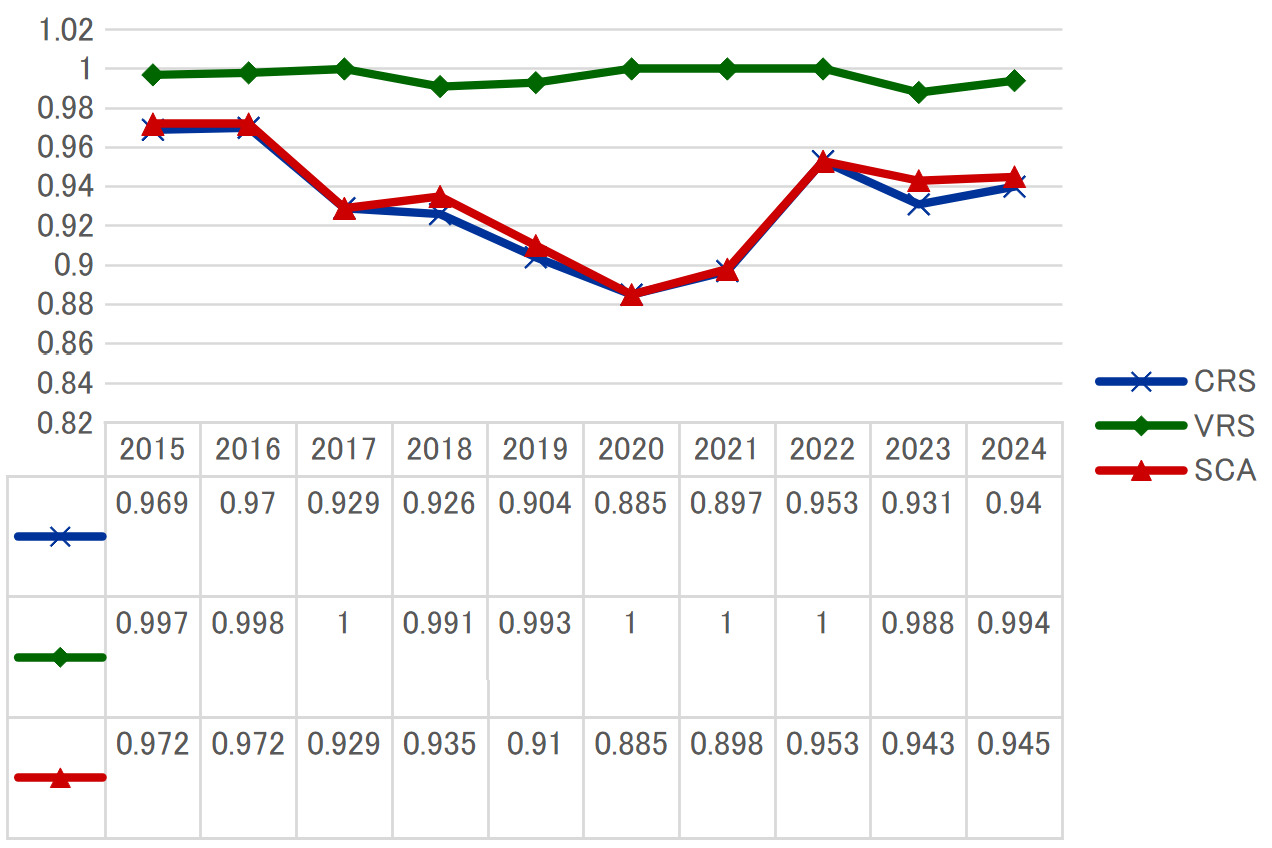
Through the analysis of the operating efficiency of Chinese fishery listed companies from 2015 to 2024, the comprehensive efficiency value, technical efficiency value, and scale efficiency value of the operating conditions of fishery enterprises are obtained. Data analysis uses DEAP2.1 software. Due to space limitations, only the efficiency values of all listed companies in 2015 and 2024 are listed here (Table 4). The changes in the average efficiency of all listed fishery companies from 2015 to 2024 are shown in Figure 1.
Based on calculations of operational efficiency for China’s listed fishery companies from 2015 to 2024, this study reveals that the evolution of industry efficiency exhibits distinct patterns of regularity and structural differentiation. Overall industry efficiency fluctuations are primarily governed by economies of scale, while management and technological capabilities have long stabilized at a highly efficient level. Concurrently, significant divergences exist in efficiency trajectories among different enterprises, reflecting varying capacities to adapt to industry transformations. Specifically, the VRS index maintained a consistently high and stable level over the decade at the macro level. Its mean value slightly decreased from 0.997 in 2015 to 0.994 in 2024, confirming the mature technological application and operational management capabilities of the sampled enterprises. This enables them to achieve efficient utilization of input factors within their established scale. However, micro-level enterprise data reveals that not all companies can maintain technological leadership. For instance, ZONECO’s VRS declined from 1.000 to 0.910, indicating that some enterprises may suffer from slack management or relatively outdated technology.
More importantly, the synchronized fluctuations of CRS and SCA form the main thread of efficiency changes. From the overall mean perspective, CRS decreased from 0.969 to 0.940, while SCA fell from 0.972 to 0.945. This shift primarily stems from changes in returns to scale. Enterprise-level data provides compelling evidence. For instance, CNFC experienced a significant concurrent decline in both CRS and SCA (approximately from 0.861 to 0.756), with its scale efficiency status reversing from increasing returns to decreasing returns, indicating the company likely underwent substantial scale adjustments. In contrast, companies like BAIYANG, SKMIC consistently remained on the efficient frontier (CRS=1), demonstrating excellent scale adaptability and technological stability.
Analysis of Malmquist index results
In order to further reveal the changing characteristics and internal motivations of the operating efficiency of fishery-listed companies in the time dimension, this paper introduces the Malmquist productivity index based on the static evaluation of BCC, decomposes TFP into two parts, EFF and TE, and examines the efficiency changes at the industry and enterprise level from a dynamic perspective. The results are shown in Table 5 and Table 6.
From a time-series perspective, the industry’s TFP growth exhibits pronounced cyclical fluctuations, with its driving mechanism oscillating between “technology-led growth” and “efficiency catch-up.” Fluctuations in technological progress are the primary driver of TFP fluctuations. The annual TFP index fluctuates between 0.853 and 1.080, indicating that external shocks significantly impact industry efficiency. In-depth analysis reveals two primary growth patterns for TFP: During most peak phases, robust technological progress served as the sole growth driver, though the simultaneous SE remained below 1, creating a “technology advances while scale drags” dynamic. However, a rare alternative pattern emerged in 2021-2022: Against a backdrop of slowing technological progress, TFP growth was achieved through substantial improvements in EFF and SE, representing a classic “efficiency catch-up” model. This catch-up, however, proved unsustainable. From 2023 to 2024, technology once again became the weak link, pushing the industry back onto a path of efficiency decline. This dynamic process reveals that efficiency growth among listed fisheries companies lacks stable, synergistic endogenous drivers. Technological progress remains highly uncertain, while improvements in scale efficiency exhibit sporadic and unsustainable patterns.
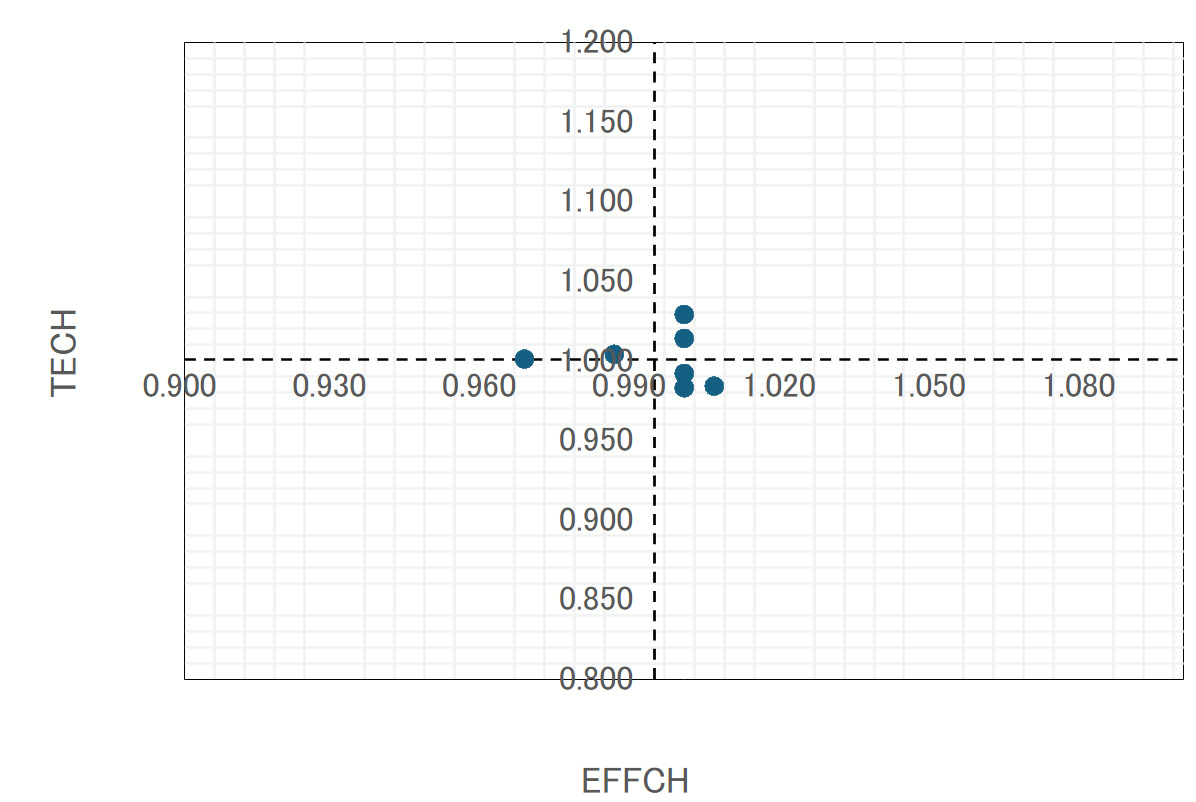
From a cross-sectional perspective, the industry’s overall efficiency has slightly declined, with significant divergence among enterprises. This stems from widespread shortcomings in economies of scale. During the study period, the average TFP of sample enterprises was below 1, indicating a slight overall decline in production efficiency. However, individual corporate performance varied dramatically: DHGF and ZONECO emerged as benchmarks for efficiency growth through significant technological advancement; conversely, ORIENTAL OCEAN and CNFC became major efficiency drags due to severe scale efficiency (SE) deficiencies. Further analysis of efficiency decomposition reveals that companies like BAIYANG. and SKMIC, while maintaining their EFF on the optimal frontier, recorded final TFP below 1 due to insufficient technological progress. This traps them in a dilemma of “efficient management but stagnant innovation.” The scatter plot shows that most companies’ data points cluster densely around the (1.0, 1.0) region, yet overall diffusion toward higher efficiency values remains insufficient. This reveals the industry’s current state of converging efficiency among enterprises and a lack of breakthrough leaders, with the widespread low level of scale efficiency being the key structural issue constraining overall efficiency improvement.
Tobit regression results
Based on the micro-enterprise level, this paper establishes a Tobit model to analyze the impact of labor quality of Chinese fishery listed companies on operating efficiency. The specific model is as follows (10):
CRSit=α0+α1Lqit+α2Sizeit+α3Ageit+α4Tatit+α5Top1it+α6Indepit+α7Invit+α8Crit+α9Yanhaiit+Year+Id+εit
In the model, is the constant term, is the coefficient of each corresponding variable, i is the number of companies (i=1, 2, …, 7), t represents the period (t=2015, 2016, …, 2024), and is the residual term.
Descriptive statistics
The descriptive statistics of the main indicator data are shown in Table 7. The average CRS calculated by the BCC model is less than 1, indicating that the development of China’s fishery has not yet reached the optimal scale effect overall. The standard deviation of Lq is only 0.1311, indicating that there is not much difference in labor quality levels among enterprises, but its average is 0.2894, and its maximum is 0.6030, indicating that the proportion of people with undergraduate degrees or above in fishery companies is low, and the highest is not even 50%. The distribution of the other variables is relatively reasonable and is basically consistent with the existing research. In addition, when there is a highly correlated linear relationship between each explanatory variable, it will cause multiple collinearity problems, affecting the accuracy of the regression coefficients. Therefore, a multicollinearity test of the variables is required before regression, and the results are shown in Table 8. It can be seen that the maximum VIF is 2.53, which is significantly lower than 10, indicating that there is no multicollinearity problem between the variables.
Regression results
Table 9 presents the regression results on the impact of labor quality on operational efficiency. The Tobit regression analysis indicates that labor quality exerts a significant positive effect on operational efficiency at the 5% significance level. This suggests that as the quality of a firm’s workforce improves, its operational efficiency increases substantially.
Robustness tests
-
Replace explanatory variable. To avoid research bias arising from indicator selection, robustness tests were conducted by changing the measurement method of the core explanatory variable. This study employed the proportion of highly educated individuals (Lab) as a proxy variable for the explanatory variable. The test results are shown in Column (1) of Table 10. The regression coefficient for Lab is significantly positive at the 1% level, indicating that the positive impact of labor force quality on operational efficiency is robust.
-
Reduce geographic location control. To examine the sensitivity of core findings to the selection of control variables and further assess the independence of labor quality’s impact, this study re-estimates the model after excluding the geographic location variable “coastal status” The results are presented in Column (2) of Table 10. The regression coefficient for Lq is significantly positive at the 5% level, indicating that labor quality significantly enhances the operational efficiency of fishery enterprises. This conclusion is robust.
-
Lag one period. Considering the lag in the impact of labor quality on the operational efficiency of fishery enterprises, this study employs the lagged one-period labor quality (L.Lq) as an explanatory variable to mitigate potential endogeneity issues. The test results are presented in Column (2) of Table 10. The regression coefficient for L.Lq is significantly positive at the 1% level, further reinforcing the positive effect of labor quality on operational efficiency.
-
Instrumental Variables Method. To address potential endogeneity issues involving mutual causality, this study employs the number of higher education institutions in the province where listed companies are located as an instrumental variable (IV) for regression analysis. A higher number of universities in a province typically indicates richer higher education resources in that region, enabling the cultivation and attraction of more highly educated talent. This directly enhances the supply and proportion of high-quality labor in the local labor market, meeting the fundamental criteria for instrumental variable selection. Column (4) of Table 10 reports the results of the first stage regression. The IV is significantly positively correlated with Lq, indicating that a higher number of higher education institutions in the province where a fishery enterprise is located correlates with a higher quality of labor force obtained by that enterprise. Column (5) of Table 10 reports the results of the second stage regression, where the IV remains significant at the 5% level. The above analysis demonstrates that after controlling for endogeneity issues, labor force quality still significantly promotes the operational efficiency of fishery enterprises.
Mechanism analysis
First, based on human capital theory and absorptive capacity theory, high-quality human capital serves as the core logical foundation driving increased corporate R&D investment. Becker (1964)9 explicitly proposed in human capital theory that highly skilled employees, as the primary carriers of heterogeneous human capital, possess specialized technical capabilities, innovative thinking, and complex problem-solving skills. These form the fundamental prerequisites for enterprises to engage in R&D activities, enabling them to accurately identify opportunities for technological iteration and efficiently advance the implementation of R&D projects. Building upon this, Cohen and Levinthal (1990)17 further supplemented the theory with their absorptive capacity framework. They highlighted the significant spillover effects of knowledge accumulation among high-quality employee groups. Their cross-departmental collaboration accelerates the dissemination and transformation of internal and external technical knowledge, effectively reducing trial-and-error costs and information asymmetry issues during the R&D process. Research by Nelson & Phelps (1966)18 further corroborates that the knowledge-complementary networks and collaborative mechanisms formed by a highly skilled workforce optimize the efficiency of R&D resource allocation. This allows limited resources to be concentrated on high-value R&D projects, thereby enhancing the marginal output of R&D investments. Furthermore, from the perspective of human capital’s risk-bearing characteristics, employees with higher educational attainment demonstrate greater tolerance for the uncertainties inherent in R&D activities. This enables enterprises to maintain stable and sustained R&D investment intensity, avoiding budget cuts driven by short-term operational pressures, thereby ensuring the long-term continuity of R&D initiatives.
Second, based on innovation economics theory, R&D investment directly enhances corporate operational efficiency through two core pathways: technological progress and economies of scale. This embodies the core logic of the “innovation input-output conversion” process within innovation economics. From the perspective of technological progress, research by Fare et al. (1994)19 demonstrates that technological innovations generated by R&D investments can directly optimize corporate production processes, reduce unit production costs, and enhance product value-added. This, in turn, improves corporate technological efficiency, aligning closely with the innovation economics perspective that “technological innovation is the core driver for enhancing corporate core competitiveness.” From the market competition perspective, the technological advantages derived from R&D investments enable enterprises to build differentiated competitive barriers, consolidate market share, enhance pricing power, and achieve sustainable improvements in operational efficiency. This represents a concrete application of the innovation economics theory that “innovation empowers market competition.” Regarding economies of scale, research by Banker et al. (1984)2 indicates that R&D investment typically accompanies production facility upgrades and digital transformation of management systems. This helps enterprises overcome the bottleneck of diminishing returns to scale, optimize the efficiency of factor allocation, and enhance scale efficiency. This further refines the transmission pathway of “R&D investment—improved production efficiency” in innovation economics, achieving an organic linkage between R&D investment and corporate operational efficiency.
Based on the above, high-quality human capital plays a pivotal role in optimizing resource allocation, enhancing technological application capabilities, and driving management innovation. Particularly in technology-intensive and knowledge-intensive fisheries industries, improving labor quality can boost efficiency by increasing R&D investment and strengthening corporate innovation. Therefore, following Dai R (2021),20 we construct a verification model as shown in Equation (11). This study selects R&D investment (Rd) as the instrumental variable, measured by the logarithm of R&D expenditure. Here, represents the interaction term between and
CRSit=α0+α1Mit+α2Lqit+α3Rdit+α4Sizeit+α5Ageit+α6Tatit+α7Top1it+α8Indepit+α9Invit+α10Crit+α11Yanhaiit+Year+Id+εit
The regression results in Table 11 show that the coefficients for M are all significantly positive, indicating that labor quality is more effective in enhancing operational efficiency when enterprises have higher R&D investments. The mechanism has been validated.
Conclusions and Suggestions
Based on microdata from 7 fishery-listed companies in China, this paper analyzes the impact of labor quality on operating efficiency from 2015 to 2024 using the DEA-BCC model, Malmquist index, and Tobit regression. Research shows that the comprehensive efficiency of fishery-listed companies has increased significantly over the past decade. However, there are slight fluctuations in scale efficiency, indicating that some companies still need to optimize their scale to match higher efficiency needs.
Through Malmquist productivity index analysis, it is found that the growth of TFP is affected by the slight regression in TE, while EFF remained basically stable. Specifically, PE has increased, but SE has shown a downward trend, indicating that enterprises have improved in management capabilities and resource allocation efficiency, but there is a lag in scale adjustment.
Further Tobit regression analysis shows that labor quality has a significant positive impact on enterprise operating efficiency. The increase in the proportion of highly educated employees is mainly achieved through enhancing the company’s R&D investment level and indirectly promoting technological innovation, thereby achieving more efficient resource allocation and technical application capabilities.
In order to further improve the operating efficiency of fishery-listed companies, combined with the empirical analysis conclusions in the previous article, the following suggestions are given:
1. Strengthen the introduction and training of high-quality talents and optimize the labor structure. Fisheries enterprises should include the strategy of high-quality talents in the development plan: on the one hand, through cooperation with college aquaculture, marine science, and other majors, targeted introduction of bachelor’s degrees or above talents, focusing on supplementing the talent gap in R&D, digital management, and other fields; on the other hand, establish an internal training system to carry out academic improvement and technical skills training for existing employees, such as intelligent aquaculture equipment operation, green production technology, etc., gradually increase the proportion of bachelor’s degrees or above, and resolve structural contradictions in human resources.
2. Increase support for R&D investment and perfect innovation incentive mechanisms. Given that R&D investment is the core path for labor quality to operate efficiency, enterprises need to guarantee R&D activities from the funding and institutional levels: in terms of funds, special R&D funds can be established to focus on supporting research and development in the fields of ecological breeding technology, resource recycling, intelligent equipment, etc.; in terms of systems, an incentive mechanism of “linking R&D results with salary promotion” is established to encourage highly educated employees to participate in technological innovation, and at the same time promote the transformation of R&D results to actual production, and transform technological advantages into efficiency advantages.
3. Optimize the scale structure of the enterprise and improve scale efficiency. In response to the problem of mismatch between scale and efficiency of some enterprises, it is recommended that enterprises adjust their scale based on their own resource endowments and industry characteristics: for enterprises in the stage of increasing scale returns, they can expand moderately through industrial chain integration, strategic cooperation, etc. to achieve economies of scale; for enterprises in the stage of decreasing scale returns, the organization level should be simplified and resource allocation should be optimized to avoid management redundancy and cost waste and to promote the dynamic adaptation of scale and efficiency.
Acknowledgments
This study was supported by Project of Central Public-interest Scientific Institution Basal Research Fund, CAFS (2023TD30). We are very grateful to Professor Mu for making valuable comments on an early version of this paper. We are also grateful to the anonymous reviewers for valuable comments and suggestions that can help improve our manuscript. We thank the editor for his valuable comments and editorial handling.
Authors’ Contribution
Conceptualization: Jiang Qingqing (Lead). Writing – original draft: Jiang Qingqing (Equal), Zhuming Zhao (Equal), Xuanxuan Zhang (Equal). Writing – review & editing: Jiang Qingqing (Equal), Xuanxuan Zhang (Equal), Congzhi Di (Equal). Supervision: Jiang Qingqing (Lead).
Data Accessibility
The datasets generated and analyzed during the current study are available from the corresponding authors upon reasonable request.
Conflict of Interest Statement
The authors declare that this article was conducted without any commercial or financial relationships that could be construed as a potential conflict of interest.
Ethics of studies involving humans and animals
The manuscript does not address “Ethics of Studies Involving Humans and Animals”.
Informed consent statement
All authors and institutions have confirmed this manuscript for publication.