1. Introduction
Rhopilema esculentum (Cnidaria: Scyphozoa: Rhizostomeae: Rhizostomatidae) is widely distributed in the Bohai Sea, Yellow Sea, and East China Sea, representing one of China’s most economically important jellyfish taxa. However, overfishing, environmental change, and large-scale stock-enhancement releases have caused drastic population fluctuations and increasingly complex genetic structure, underscoring the urgency of systematic stock assessment and genetic research. For hatchery-released species like R. esculentum, genetic diversity directly influences both the persistence of wild stocks and the performance of enhanced cohorts. Low diversity in broodstock can lead to inbreeding depression and maladaptation in released offspring, potentially undermining multi-million-yuan enhancement programs. Moreover, without genetic tags, the contribution of hatchery releases to fisheries cannot be evaluated, nor can their ecological impact on native gene pools be assessed.
Although previous studies1–6 have employed microsatellites, ITS, COI, and AFLP markers to investigate R. esculentum genetics, most sampling was limited to natural populations in Liaoning. Genetic characterization of cultured stocks and populations from other regions remains lacking, and no marker has yet been validated for discrimination between released and wild individuals. It is therefore unknown whether R. esculentum populations along the Chinese coast exhibit significant genetic differentiation, whether cultured stocks retain comparable diversity to wild conspecifics, and whether a rapid, cost-effective marker can distinguish released from native individuals. To address these gaps, we analyzed mitochondrial COI sequences from two wild and one cultured population sampled along the Chinese coast.
COI is widely adopted as a DNA barcode due to its moderate evolutionary rate, high amplification success, and extensive reference database. However, as a single, maternally inherited locus, it captures only a fraction of the genome and may not fully resolve recent demographic events or fine-scale structure. Nevertheless, for the initial characterization of previously unstudied populations and for the development of a practical release-identification assay, COI offers an optimal balance between discriminatory power, throughput, and cost. Should COI reveal significant patterns, subsequent studies can integrate nuclear markers (e.g., microsatellites, RAD-seq) for higher resolution.
It remains unknown whether R. esculentum populations along the Chinese coast exhibit significant genetic differentiation, whether cultured stocks retain comparable diversity to wild conspecifics, and whether a rapid, cost-effective marker can distinguish released from native individuals. Answering these questions is timely because annual hatchery releases now exceed 200 million juveniles, yet no genetic monitoring is mandated. Conceptually, this study moves beyond descriptive diversity surveys by explicitly linking COI haplotype data to operational management needs (e.g., release identification and broodstock selection). Methodologically, it provides the first direct comparison between wild and cultured R. esculentum using the universal COI barcode, establishing a transferable framework for other released marine species. Specifically, we analyzed COI sequences from two wild and one cultured population sampled along the Chinese coast to (i) quantify genetic diversity and population structure, (ii) infer demographic history, and (iii) identify candidate markers for population assignment. These data will directly inform release discrimination, broodstock selection, and post-release monitoring, thereby transforming a traditional barcode marker into a practical resource for the sustainable use of R. esculentum.
2. Materials and methods
2.1. Sample collection and DNA extraction
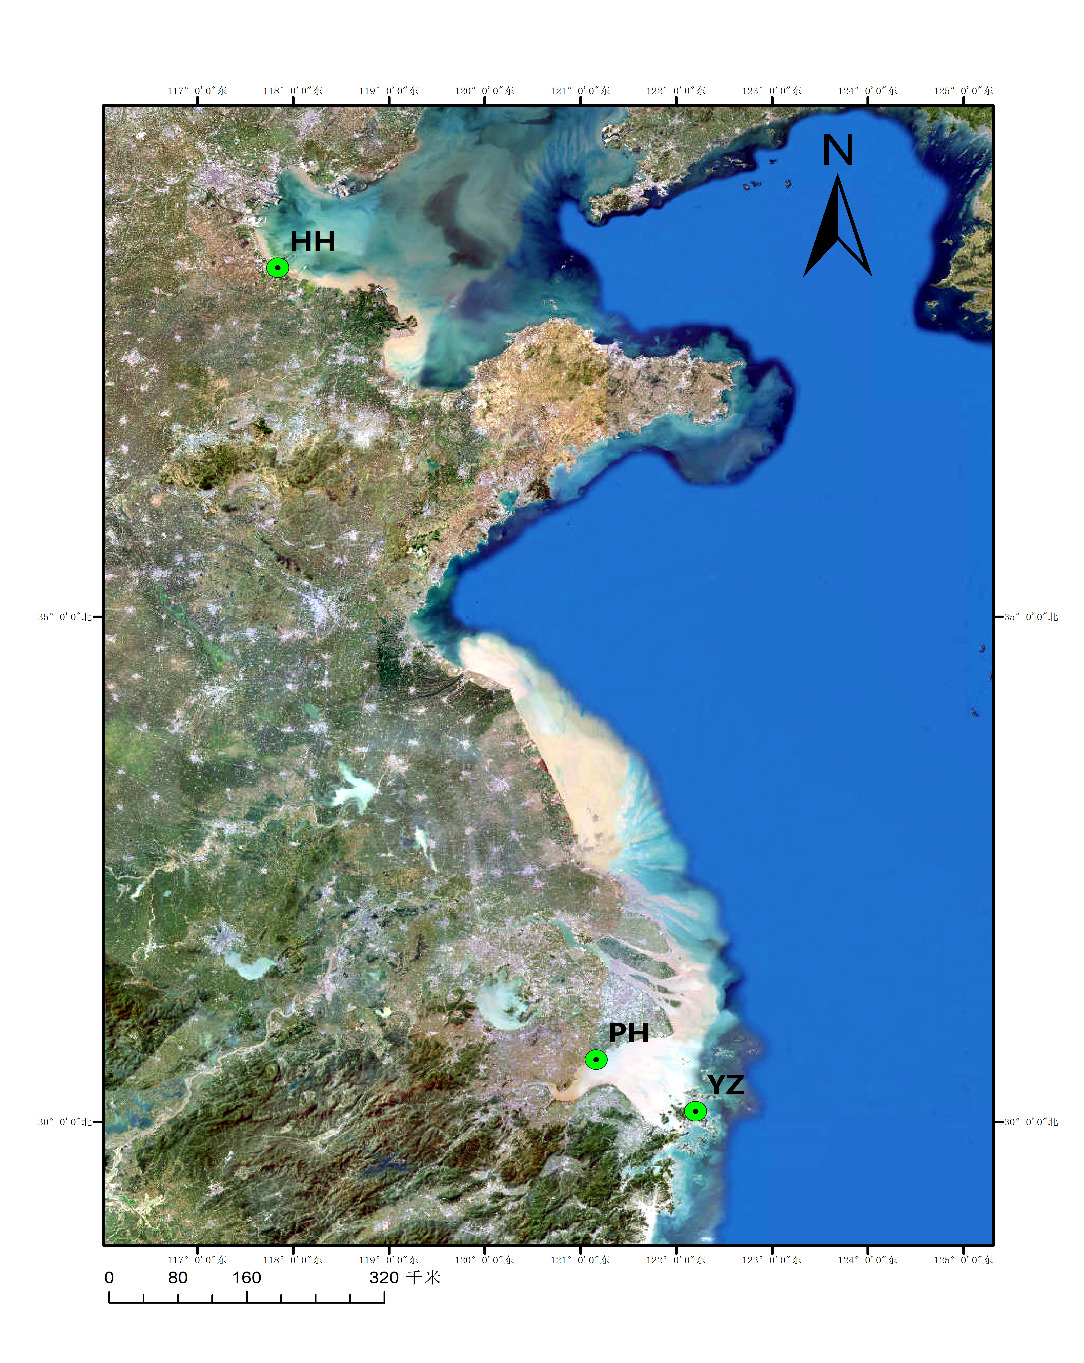
Thirty-seven valid individuals were collected from three populations (Table 1, Fig. 1): two wild (Pinghu, PH, Zhejiang province, n = 3; Huanghua, HH, Hebei province, n = 24) and one hatchery (Zhoushan, YZ, Zhejiang province, n = 10). Wild adults were obtained from commercial trawls, oral-arm tissue was excised and preserved in 95 % ethanol. Hatchery juveniles were taken from a local farm, and whole individuals were similarly preserved. All tissues or individuals were stored at -20°C until analysis.
Genomic DNA was extracted with the HiPure Universal DNA Kit (silica-column, phenol/chloroform-free). Integrity was checked on 1% agarose gels, concentration and purity (OD260/280 1.8-2.0) were measured with NanoDrop 2000. DNA was stored at -20°C until use.

2.2. PCR amplification, purification and sequencing of COI
The universal primers, i.e., LCO1490 (5′-GGTCAACAAATCATAAAGATATTGG-3′) and HCO2198 (5′-TAAACTTCAGGGTGACCAAAAAATCA-3′),7 were used for PCR amplification of COI. The 20 μL PCR reaction mixture contained 10 µL Premix Taq (Takara Biotechnology, Dalian), 1 µL each primer (10 µM), 1 µL template DNA (20 ng/µL) and 7 µL ddH₂O. The PCR amplification program was as follows: initial denaturation at 95°C for 5 min; then 35 cycles of 95°C for 30 s, 50°C for 30 s, and 72°C for 1 min; final extension at 72°C for 10 min. Amplicons were visualized on 2% agarose, then gel-purified and sequenced in both directions on an ABI 3730xl (Shanghai MapBiotech) using the same primers.
2.3. Data analysis
Sequences were edited, assembled and aligned in Clustal X 1.83.8 Population genetic variation was evaluated using two parameters, i.e., Haplotype diversity (Hd) and nucleotide diversity (π), which were calculated in DnaSP. Haplotype diversity (Hd) is defined as the probability that two randomly chosen haplotypes from a population or group are different, whereas nucleotide diversity (π) represents the mean percentage of nucleotide differences between all pairwise comparisons of haplotypes within the same population.9 Analysis of Molecular Variance (AMOVA)10 and pairwise genetic differentiation (FST) were performed with Arlequin 3.011 (significance was tested with 10 000 permutations), by partitioning the relative contributions of within- and among-population variance components, the degree of genetic differentiation among stocks was determined. Base components, Genetic distances (Kimura-2-parameter, K-2-P),12 and a Neighbour-Joining (NJ) tree13 (1000 bootstraps) were obtained with MEGA 5.0.14 Demographic history was inferred with Tajima’s D15 and Fu’s Fs16 using DnaSP.17
3. Results
3.1. COI gene sequence characteristics and base composition of R. esculentum
COI was amplified from all 58 individuals, but chromatograms were inspected and only high-quality forward and reverse reads were retained. These 58 cleaned sequences were submitted to BLASTn against the NCBI nt database (https://www.ncbi.nlm.nih.gov), 21 showed highest identity to non-target taxa (e.g., copepods, diatoms, fish, bacteria) and were discarded.
The remaining 37 sequences (3 PH, 24 HH, 10 YZ) unambiguously matched R. esculentum COI (≥ 90 % identity) and were used for all downstream analyses. Thus, the final data set represents 27 unique haplotypes from 37 individuals, not one haplotype per individual.
The raw COI fragments ranged from 680 bp to 713 bp and contained a small number of insertions and deletions (indels). After assembly, alignment and manual editing, a 730 bp consensus sequence was obtained. Base composition was A = 35.5%, T = 28.2%, C = 18.9% and G = 17.3%, giving an A + T content of 63.7% that significantly exceeded the G + C content (36.2%), consistent with the mitochondrial base bias previously reported for scyphozoan jellyfish.
3.2. Genetic diversity
Twenty-seven haplotypes were detected in 37 valid individuals of the three R. esculentum populations (Table 2). Among them, Hap13 was the only haplotype shared by PH and HH populations with seven copies, and the other 26 haplotypes were private. Hap13 was absent from the hatchery (YZ) population.
For COI, the Hd was high for all populations, with values from 0.978 in HH to 1.000 in PH and YZ, but values of π ranged from 0.07443 (HH) to 0.22682 (PH) (Table 3). The PH population had the highest π level, whereas HH population had the lowest π level (Table 3). Estimates of haplotype (h) and nucleotide (π) diversity for Pinghu (n = 3) are reported for completeness but should be interpreted cautiously because such small samples inflate the variance of both estimators and reduce statistical power.
3.3. Genetic structure
Pairwise genetic distances between the three Rhopilema esculentum populations, calculated under the Kimura two-parameter (K-2-P) model, are listed in Table 4. For the COI fragment, distances between populations ranged from 0.220 to 0.301 (Table 4).
The fixation indices (FST) among the jellyfish populations are given in Table 4. For COI, FST between PH and HH or YZ populations ranged from 0.040 to 0.158, whereas the highest differentiation was observed between HH and YZ (FST = 0.547). All pairwise FST values exceeded or about equal to 0.05 and were highly significant, indicating moderate to strong genetic differentiation among the three populations.
AMOVA identified significant genetic structures in the hierarchical rearrangements examined. AMOVA revealed that more than 51 % of the total molecular variance was attributable to differences within populations, whereas less than 49 % was distributed among populations, implying that the observed genetic differentiation is driven primarily by variation within rather than between populations (P<0.001) (Table 5).
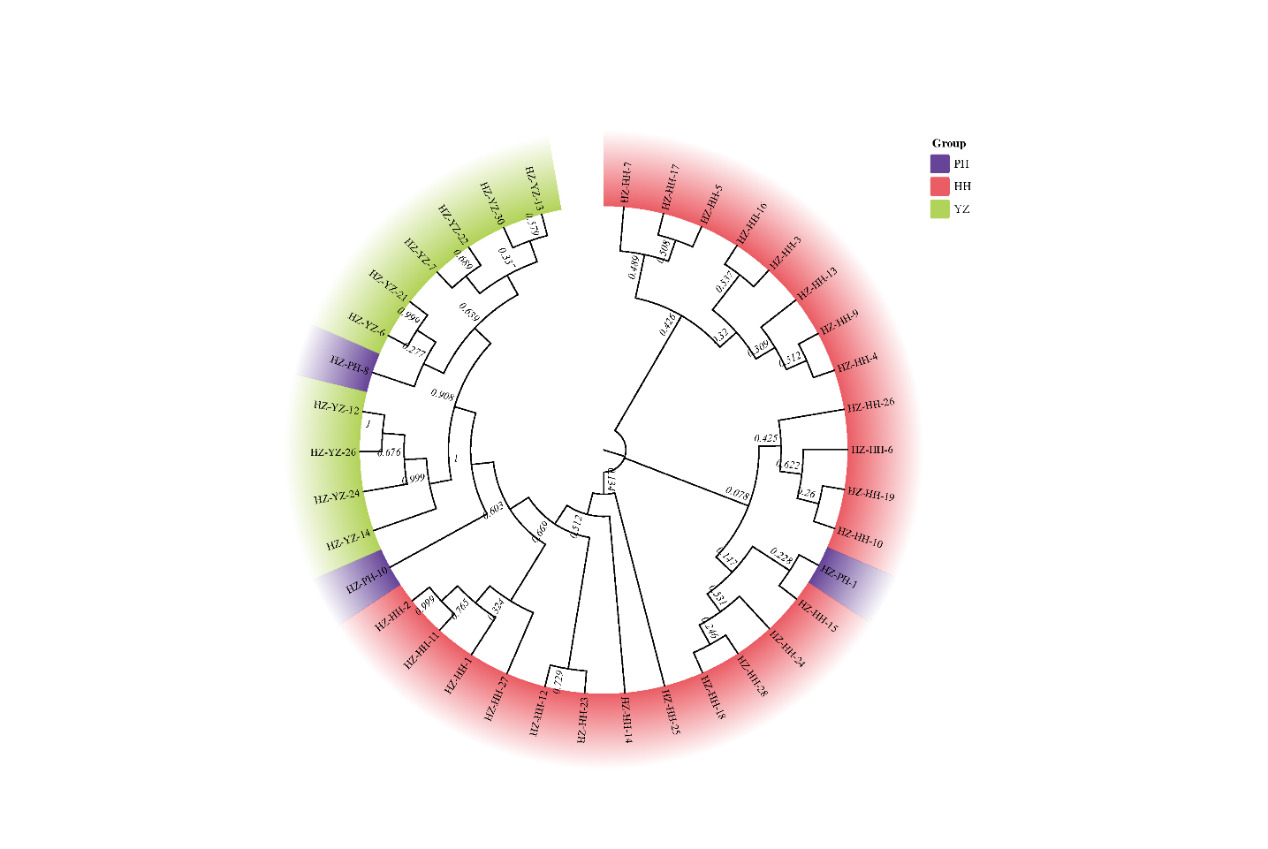
NJ phylogenetic tree based on the COI sequences was constructed with the Neighbour-Joining method (Fig. 2). The results showed that the COI haplotypes clustered into two major clades: Clade 1 was composed mainly of individuals from the Huanghua (HH) population plus one individual from Pinghu (PH), whereas Clade 2 contained most of the Zhoushan cultured (YZ) individuals together with two PH individuals. Overall, the topological pattern corresponds closely to geographic origin, revealing a clear phylogeographic structure. The tree indicates that the Pinghu (PH) and the cultured Zhoushan (YZ) populations are more closely related to each other, reflecting a location-associated evolutionary relationship. We noticed that although two major clusters are apparent (Fig. 2), the bootstrap support is moderate (60%). Therefore, these groupings should be viewed as tentative patterns rather than robust phylogenetic divisions.

3.4. Population history
Neutrality tests are used to infer whether a population has experienced historical expansion. Tajima’s D15 captures events over a relatively long time-scale and is influenced mainly by older mutations, whereas Fu’s Fs16 is sensitive to more recent demographic changes and reflects short-term population events.
Neutrality-test results are summarized in Table 6. Because the PH sample contained only three individuals, we restricted neutrality tests to HH, YZ and the overall data set, corresponding D and Fs values for PH are not reported. In general, significantly negative values (P < 0.05) are interpreted as evidence of past population expansion.15,16 In this study, HH population yielded a significantly negative Tajima’s D (-2.11983, P < 0.05), suggesting a recent expansion event. By contrast, Tajima’s D for the cultured YZ population and for the total data set was negative but not significant, and Fu’s Fs was non-significant for all individual populations as well as for the pooled data. Taken together, the analyses indicate that only the HH population shows signs of demographic expansion, whereas no significant expansion signal is detected in other populations.
4. Discussion
4.1. Genomic DNA extraction and COI sequencing for Rhopilema esculentum
In this study, initially, 58 jellyfish individuals were collected for genetic analysis. Genomic DNA was extracted and the COI gene was amplified and sequenced. However, BLAST comparison against the NCBI database revealed that 21 sequences showed low or even no similarity to published Rhopilema esculentum COI sequences, and were not validated as R. esculentum, thus those sequences with low or even no similarity were deemed as invalid sequences and discarded accordingly. After removing 21 contaminant sequences (see Results), the final 37 sequences yielded 27 distinct haplotypes, indicating that the 63.8% of success rate. Two factors may explain this phenomenon: (1) Difficulty in obtaining high-purity genomic DNA. The body of a R. esculentum is composed of 95-98% water, so the amount of tissue available for DNA extraction is minimal. Moreover, the species has a broad zooplankton-based diet that includes copepods, cladocerans, cumaceans, amphipods, rotifers, ciliates, bivalve larvae, fish eggs and larvae, some algae and organic detritus.18 Residual DNA from these dietary items co-extracts and competes with host DNA. The HiPure Universal DNA Kit used here may not be optimal for extracting genomic DNA of this jellyfish organism. A protocol tailored to jellyfish will probably be required. (2) Primer specificity and sensitivity. The universal COI primers LCO1490/HCO2198 amplify a wide range of metazoans but are not specific to R. esculentum. Consequently, cross-amplification of prey or environmental contaminants was common. Some obtained sequences were almost identical to COI of Latreutes planirostris, Thalassiosira pseudonana, Thryssa kammalensis, Artemia sorgeloosi and Vibrio vulnificus, rather than to jellyfish. Developing primers with higher specificity and sensitivity for R. esculentum COI is therefore essential for future population-genetic studies of this species.
4.2. Diversity, structure and demography of Rhopilema esculentum
The present study shows that the biased base composition of R. esculentum COI sequences mirrors that reported for other scyphozoans, reflecting the evolutionary characteristics of jellyfish mitochondrial genomes. Analysis of the COI data revealed both high haplotype diversity (h) and high nucleotide diversity (π) in R. esculentum populations, conforming to the classic “high h, high π” pattern. Although PH yielded the highest π value, its sample size (n = 3) is insufficient to conclude that this population is genetically more diverse than HH or YZ, and larger field collections are required before firm biogeographic inferences can be drawn.
The degree of genetic differentiation among populations is commonly quantified by the fixation index (FST). Wright19 proposed that FST > 0.25 indicates very great differentiation, 0.15-0.25 great differentiation, 0.05-0.15 moderate differentiation, and < 0.05 negligible differentiation. In the present study, pairwise FST between Huanghua (HH) population and the other two populations equaled or exceeded 0.15, and in some comparisons surpassed 0.25, implying moderate to very great genetic differentiation. In contrast, FST between Pinghu (PH) and cultured Zhoushan (YZ) populations was < 0.05, indicating little or no differentiation. The pronounced divergence of HH probably reflects its long geographic distance from both PH and YZ, which restricts gene flow. Conversely, PH and YZ both occur within the Hangzhou Bay area and the hatchery brood-stock of YZ originated from Hangzhou Bay, explaining their genetic similarity.
Although AMOVA showed that most variance was partitioned within rather than among populations, all pairwise FST values were statistically significant, confirming the existence of detectable genetic structure. The highest differentiation (HH vs YZ) may be reinforced by geographic isolation and artificial propagation. The shared haplotype Hap13 suggests historical connectivity, possibly via larval dispersal or anthropogenic release.
4.3. Screening of diagnostic markers and potential for population identification
Haplotype distribution (Table 2) revealed 27 haplotypes among the 37 COI sequences from the three populations. Except for the dominant haplotype Hap13, which was shared between PH and HH, all remaining haplotypes were private to single populations and can thus serve as potential diagnostic markers for stock identification. In the future, developing high-resolution SNP markers will further improve assignment accuracy and will be invaluable for monitoring stock-enhancement releases and evaluating their effectiveness. The next step should involve larger sample sizes, higher-purity genomic DNA, and COI primers with elevated sensitivity and specificity to allow refined downstream analyses and validation.
4.4. Conclusions and prospects
The genetic data generated here will directly inform three management activities: (i) release discrimination: diagnostic haplotypes or haplotype frequency shifts can be used to track hatchery cohorts in the wild; (ii) broodstock management: diversity estimates will help hatcheries select genetically representative or complementary founders; (iii) post-release evaluation: baseline wild haplotype frequencies enable before-after control-impact designs to quantify genetic changes caused by stocking. By operationalizing COI as a monitoring tool, this study transforms a traditional barcode marker into a practical resource for the sustainable use of R. esculentum.
Using mitochondrial COI sequences, this study systematically assessed the genetic diversity, population structure and demographic history of two natural and one hatchery population of Rhopilema esculentum along the Chinese coast. The species exhibits high genetic diversity and pronounced genetic differentiation. These findings provide a valuable reference for resource conservation, stock management and molecular ecology research of R. esculentum. The variable sites identified here show promise as diagnostic markers for population assignment and should be further evaluated for their reliability and stability. Such markers will be essential for monitoring release programs and quantifying the effectiveness of stock enhancement. Because effective sample sizes for some populations-especially PH-remain limited, future work will prioritize improving DNA-extraction protocols for jellyfish and developing COI primers with higher specificity and sensitivity to enable a finer-scale characterization of genetic diversity and structure in this species.
Acknowledgments
This study is financially supported by Fisheries-ecology compensation project of Zhejiang Zhoushan Power Plant Phase III 2 × 660 MW expansion (Project No.: GNZDIII-FW-2024029) and Project on germplasm resources and precise identification of R. esculentum (Project No.: 2918-2-H-2021).
Authors’ Contribution
Conceptualization: Qiqun Cheng (lead), Minbo Luo (lead);
Data curation: Yan Lu (lead), Biyuan Liu (lead), Qiqun Cheng (lead), Minbo Luo (lead), Wei Huang (equal), Aiyong Cheng (equal), Yunlong Wang (equal);
Formal Analysis: Yan Lu (lead), Biyuan Liu (lead), Qiqun Cheng (lead), Minbo Luo (equal), Wei Huang (equal), Aiyong Cheng (equal), Yunlong Wang (equal);
Funding acquisition: Minbo Luo (lead), Qiqun Cheng (lead);
Investigation: Yan Lu (lead), Biyuan Liu (lead), Qiqun Cheng (lead), Wei Huang (equal), Aiyong Cheng (equal), Minbo Luo (equal), Yunlong Wang (equal);
Methodology: Qiqun Cheng (lead), Biyuan Liu (lead);
Project administration: Minbo Luo (lead), Qiqun Cheng (lead);
Resources: Qiqun Cheng (equal), Minbo Luo (equal), Yan Lu (equal), Biyuan Liu (equal);
Software: Biyuan Liu (lead), Qiqun Cheng (lead);
Supervision: Qiqun Cheng (lead), Minbo Luo (lead);
Validation: Minbo Luo (equal), Qiqun Cheng (equal);
Writing – original draft: Qiqun Cheng (lead), Biyuan Liu (lead);
Writing – review & editing: Qiqun Cheng (lead), Yan Lu (lead), Biyuan Liu (lead), Wei Huang (equal), Aiyong Cheng (equal), Minbo Luo (equal).
Competing of Interest – COPE
The authors declare that they have no known competing financial interests.
Ethical Conduct Approval – IACUC
All animal experiments in this study were conducted in accordance with the relevant national and international guidelines. Our project was approved by Institutional Animal Care & Use Committee (IACUC) of East China Sea Fisheries Research Institute.
Informed Consent Statement
All authors and institutions have confirmed this manuscript for publication.
Data Availability Statement
All are available upon reasonable request.