


1. Introduction
Ornamental fish farming began in 1805 and is one of the earliest hobbies in the world. The ornamental fish industry is a rapidly developing sector with significant economic, ecological, and employment potential.1 Statistical research indicates that ornamental fish are widely popular as pets worldwide.2 The rise of the ornamental fish industry, while meeting the global aquarium market demand, has effectively promoted the livelihood transformation of coastal communities in developing countries. China is also one of the world’s major producers and consumers of ornamental fish. Data shows that in 2022, China’s ornamental fish exports were approximately 249.8 tons. The main export varieties are goldfish, koi, and tropical fish. The export markets include Japan, South Korea, the United States, etc. The main imported species during the same period were marine ornamental fish and freshwater ornamental fish. The import markets include Germany, Thailand, the United States, etc. China’s ornamental fish trade mainly focuses on freshwater fish, with 12 species, while 346 ornamental fish species with trade potential include 295 marine species from 62 families.3
Archocentrus nigrofasciatus var. × Mikrogeophagus ramirezi is a new hybrid ornamental fish species that has been bred through artificial hybridization in recent years. As a highly popular ornamental fish, with its brilliant colors, unique shape, and lively habits, it is deeply loved by a large number of aquarium enthusiasts. It holds an important position in the ornamental fish market, with a promising market prospect and high economic value. As a newly farmed species, fundamental research on Archocentrus nigrofasciatus var. × Mikrogeophagus ramirezi remains limited.4 The present study primarily focuses on aspects such as the stocking density and water quality requirements of the Archocentrus nigrofasciatus var. × Mikrogeophagus ramirezi. Few reports are available regarding the feeding frequency; there are only a few reports that lack systematic and in-depth scientific research. Therefore, studying the effects of different feeding frequencies on the growth and reproduction of the Archocentrus nigrofasciatus var. × Mikrogeophagus ramirezi holds significant theoretical and practical significance. It not only helps fill the gap in the field of nutritional physiology research for this species but also provides a scientific basis for its efficient and standardized breeding practice. The growth of fish is directly related to the type of feed, the rearing conditions, the frequency of feeding, and the nutrient absorption in the intestine.5,6 Previous research has found that different feeding frequencies not only affect the growth characteristics, digestive functions, and nutritional components of fish, but also have a significant impact on the aquaculture water.7 A scientific feeding frequency is not only conducive to enhancing the economic and ecological benefits of aquaculture.8 At the same time, it plays a crucial role in preventing water quality deterioration caused by overfeeding9. An optimal feeding frequency can enhance the growth performance10 and survival rate of fish,11 reduce feed loss and excretory waste,12 and lower feed and labor costs. This will promote the healthy and sustainable development of aquaculture.13 On the contrary, an irregular feeding frequency may have negative effects on the fish’s health. Excessive feeding can lead to slow growth and poor development of fish,14 cause fat deposition in the body, liver damage, and accelerate the deterioration of the rearing environment.15 A low feeding frequency will inhibit normal growth and even lead to cannibalism among the same species.16 Existing studies have shown that appropriately increasing the feeding frequency can help enhance the growth rate of fish. For instance, when the largemouth bass was fed twice a day and three times a day, the SGR increased by 11% and 14%, respectively, compared to once a day.17 Similar results have also been observed in related studies, such as Carassius auratus var. Pengze,18 Juvenile Carassius auratus,19 Carassius auratus gibelio.20 However, no studies to date have examined the feeding frequency of Archocentrus nigrofasciatus var. × M. ramirezi. Based on preliminary outcomes from the previous study, the present study systematically evaluated how different feeding frequencies affect growth traits, digestive and antioxidant enzyme activities, reproductive performance, and gonadal development in Archocentrus nigrofasciatus var. × M. ramirezi. The current study aimed to determine the appropriate feeding strategy and provide a theoretical basis and practical guidance for the healthy breeding and efficient reproduction of this fish species.
2. Materials and methods
2.1. Materials and temporary care
The Archocentrus nigrofasciatus var. × M. ramirezi hybrid fish used in the experiment were purchased from Guangzhou Xinfu Aquarium Company. The initial body weight, total length, and body height were (0.24 ± 0.07) g, (2.11 ± 0.29) cm, and (0.70 ± 0.11) cm, respectively. The breeding tanks used were glass aquaria measuring 50 cm × 49 cm × 35 cm, and breeding was conducted using a recirculating water filtration system.
2.2. Experimental design
A total of three feeding frequency groups were established in the experiment. They are respectively G2: 2 times/day, G3: 3 times/day, G4: 4 times/day; each feeding amount is 3% of the total body weight. Specifically, three repetitions were conducted for each feeding frequency group, with 50 Archocentrus nigrofasciatus var. × M. ramirezi hybrids are bred in each group, every seven days, and thirty of them are randomly selected to measure indicators such as body length and weight. The breeding experiment lasted for 56 days, after which breeding continued under the same conditions. Once the fish reached sexual maturity, a 30-day breeding trial was initiated. After the larvae hatched, they were tracked and measured for seven days, with body length and survival rate measured on the first, third, fifth, and seventh days. The prepared feed was purchased from Xiamen Huapu Aquatic Development Co., Ltd. The feed raw materials consisted of fish meal, Antarctic krill powder, soybean meal, fish oil, corn protein powder, various vitamins, etc. The protein content was 40%, the fat 5%, the water content was 8%, the ash content was about 10%, and the fiber content was about 5%. Except for the different feeding frequencies, the rest of the breeding conditions of each experimental group remained the same. During the breeding process, one-third of the water was replaced every 7 days. The water temperature was controlled at (26±1) ℃ and was regulated by the automatic temperature control system of the heating rod.
2.3. Water quality determination
During the experiment, water samples were collected once a week and then filtered through a 0.45μm pore size filter membrane for water quality testing. The water temperature, pH, dissolved oxygen, ammonia nitrogen (NH3-N), and nitrite nitrogen (NO2-N) contents were respectively measured by thermometers, pH meters, portable dissolved oxygen meters, and fully automatic chemical analyzers.
2.4. Evaluation of growth traits
Every 7 days, the body length, weight, and height of the experimental fish were measured. After 24 hours of starvation, 30 samples were randomly selected from the experimental group. They were anesthetized with eugenol and placed in an anatomical tray. Fish were weighed using an electronic balance (accurate to 0.01 g), and the body length of the fish (the straight-line distance from the tip of the snout to the base of the tail fin) was measured with a ruler (accurate to 1 mm). Specific Growth Rate (SGR) was calculated based on the measured data.
Computational formula:
Mortality rate (%)=n2/n1 × 100%
Average weight gain rate (%)=[(W2-W1)/W1] × 100%
In the formula, n1 and n2 represent the initial and final digits of the experiment, respectively. W1 and W2 are the initial and final body weights of the Archocentrus nigrofasciatus var. × M. ramirezi hybrids, respectively.
2.5. Determination of biochemical indicators
The enzyme activity indicators of each experimental group were determined. The hepatopancreas and intestinal tissues of the experimental fish were rapidly frozen in liquid nitrogen at -80 ℃ for storage for subsequent experiments. The indicators include catalase (CAT), total superoxide dismutase (T-SOD), total antioxidant capacity (T-AOC), amylase (AMS), lipase (LPS), trypsin, and pepsin. All reagent kits used in the experiment were purchased from Nanjing Jiancheng Institute of Bioengineering and used according to the instructions provided with each kit.
2.6. Gonads Histology
In each breeding group, male and female fish were randomly selected for dissection. The intestinal gonads were dissected and separated on ice, and the fat tissue was removed. Samples were fixed with Bouin’s for 24 hours and then repeatedly soaked in 70% ethanol until colorless. After paraffin embedding, sectioning (sectioning thickness 4-5 μm), and hematoxylin-eosin staining, it was observed and photographed under a Leica 3000 microscope.
2.7. Determination of reproductive traits
After the experimental fish reached sexual maturity, their reproductive behavior was closely observed. After the egg-laying was discovered, a photo of the earthenware pot was taken and directly measured using a counter. Each time the eggs were laid, the long and short diameters of 50 eggs were randomly selected and measured using a microscope with a calibrated eyepiece grid. After fertilization, the egg’s color deepens. At this time, photos were taken to count the fertilization rate. Finally, the fertilized eggs were placed in the hatching tank for hatching, and the number of larvae hatched and the hatching rate were determined.
Computational formula:
Fertilization rate (%) =Y1/Y × 100%
Incubation rate (%)=Y2/Y1 × 100%
Y2 represents the number of larvae emerging from the membrane (fish), Y represents the total number of eggs (eggs), and Y1 represents the total number of fertilized eggs (eggs).
2.8. Data analysis
Before data analysis, the Shapiro-Wilk test (P > 0.05) and Levene’s test (P > 0.05) were used to verify normality and homogeneity of variances, respectively. The experimental data were preliminarily sorted and calculated using Excel 2019 software, and the data were analyzed using SPSS 26.0 statistical software. The significance of differences in various indicators across feeding frequency groups was assessed using One-Way ANOVA. The Duncan’s multiple comparison method was used to compare the mean values of each treatment group and clarify the specific influence of different feeding frequencies on the growth and reproduction indicators of Archocentrus nigrofasciatus var. × M. ramirezi hybrids.
3. Results
3.1. Effects of Feeding Frequency on pH and Ammonia in Aquaculture Water
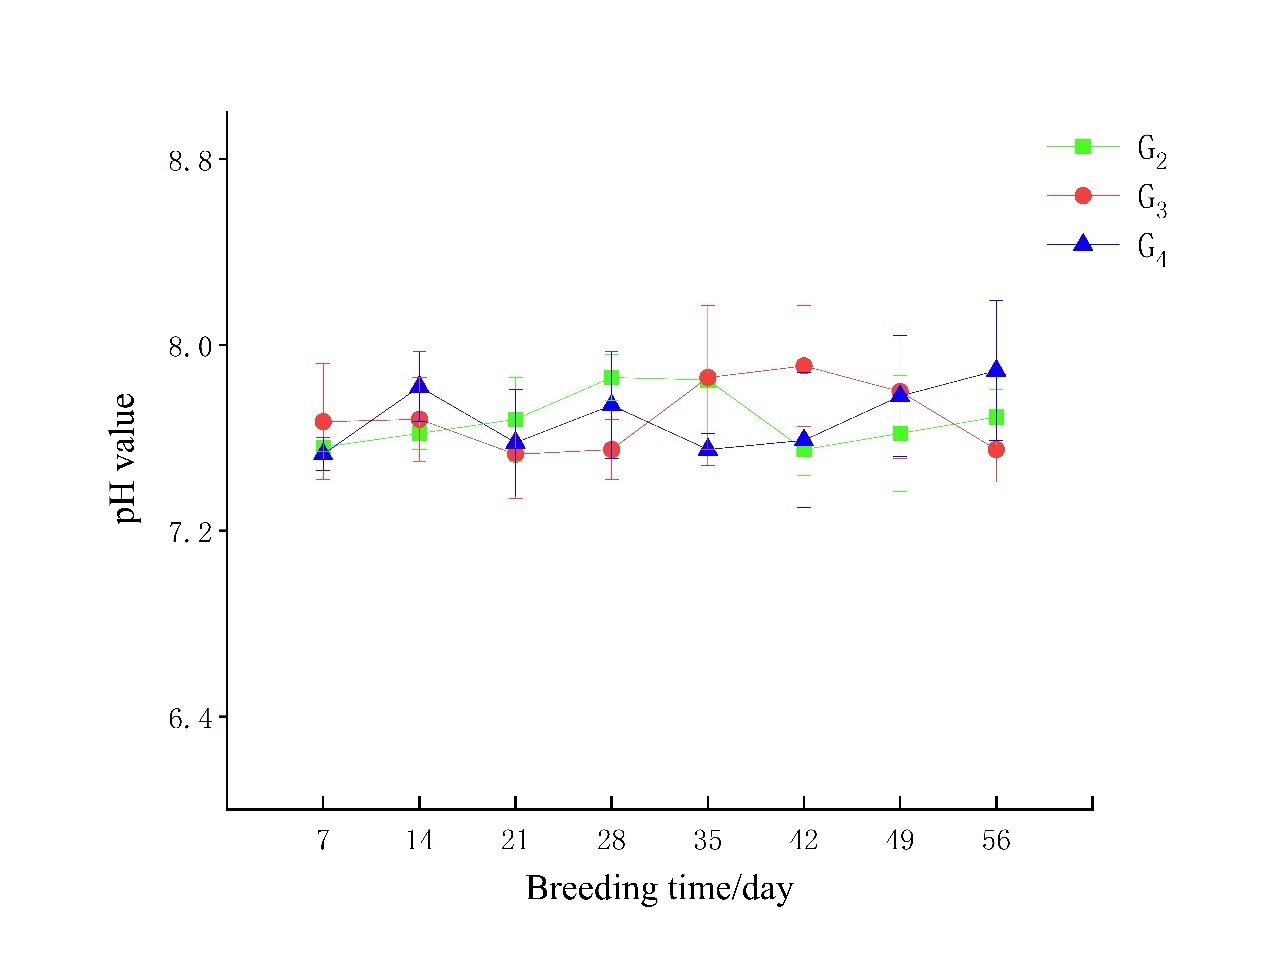
During the 56-day breeding period, there was no significant difference in pH values among the groups (P > 0.05). The pH values across the three treatment groups ranged from 6.9 to 8.1 (within the normal pH range for aquaculture water bodies). Among them, the pH value of G2 was the highest at (7.86 ± 0.1) and the lowest at (7.55 ± 0.11). The pH value of G3 was the highest (7.91 ± 0.26) and the lowest (7.53 ± 0.19). The pH value of G4 was the highest (7.89 ± 0.3), and the lowest range was (7.53 ± 0.07), respectively (Figure 1).
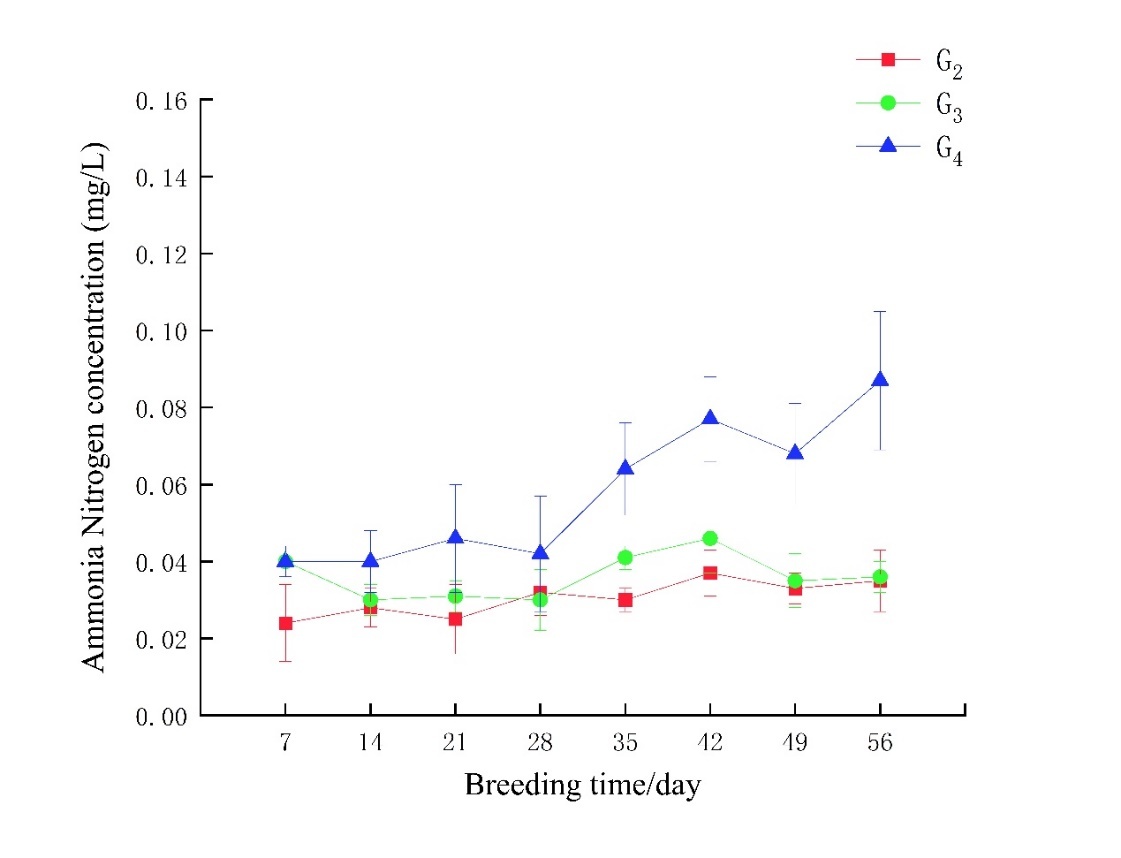
Different feeding frequencies have a significant impact on water quality NH3-N concentrations in the recirculating aquaculture system, and there were differences in NH3-N among the treatment groups with different feeding frequencies (P<0.05) (Figure 2). The concentration of NH3-N in G4 showed a gradual increase and was significantly higher than that in the other two groups (P<0.05), reaching a maximum on the 56th day (0.087 ± 0.018) mg/L. There was no significant difference between G2 and G3(P>0.05).

3.2. The growth of the Archocentrus nigrofasciatus var. × M. ramirezi hybrids
The growth indicators showed significant differences among the treatment groups with different feeding frequencies (P<0.05) (Table 1). Both the final total length and the final body length showed an increasing trend with increasing feeding frequency (Table 1). In terms of the final total length and final body length, G2 was significantly lower than G3 and G4 (P<0.05). However, there was no significant difference between G3 and G4 (P>0.05). In terms of terminal body height, there was a significant difference among the three groups (P<0.05). Among them, G2 had the lowest height, which was (0.92 ± 0.16) cm, while G4 had the highest height, which was (1.25 ± 0.15) cm. The average weight gain rate showed a trend of first increasing and then decreasing with increasing feeding frequency (Table 1). Among them, the indicators of G2 were the lowest, which were (235.93 ± 34.52) %. The index of G3 was the highest, at (300.13 ± 13.53) %. With the increase in feeding frequency, the weight growth rate reached the highest in G3. Although the growth rate in G4 was significantly higher than that in G2 (P<0.05), it was lower than that in G3. There was no significant difference in survival rate among G2, G3, and G4 (P > 0.05) (Table 1).
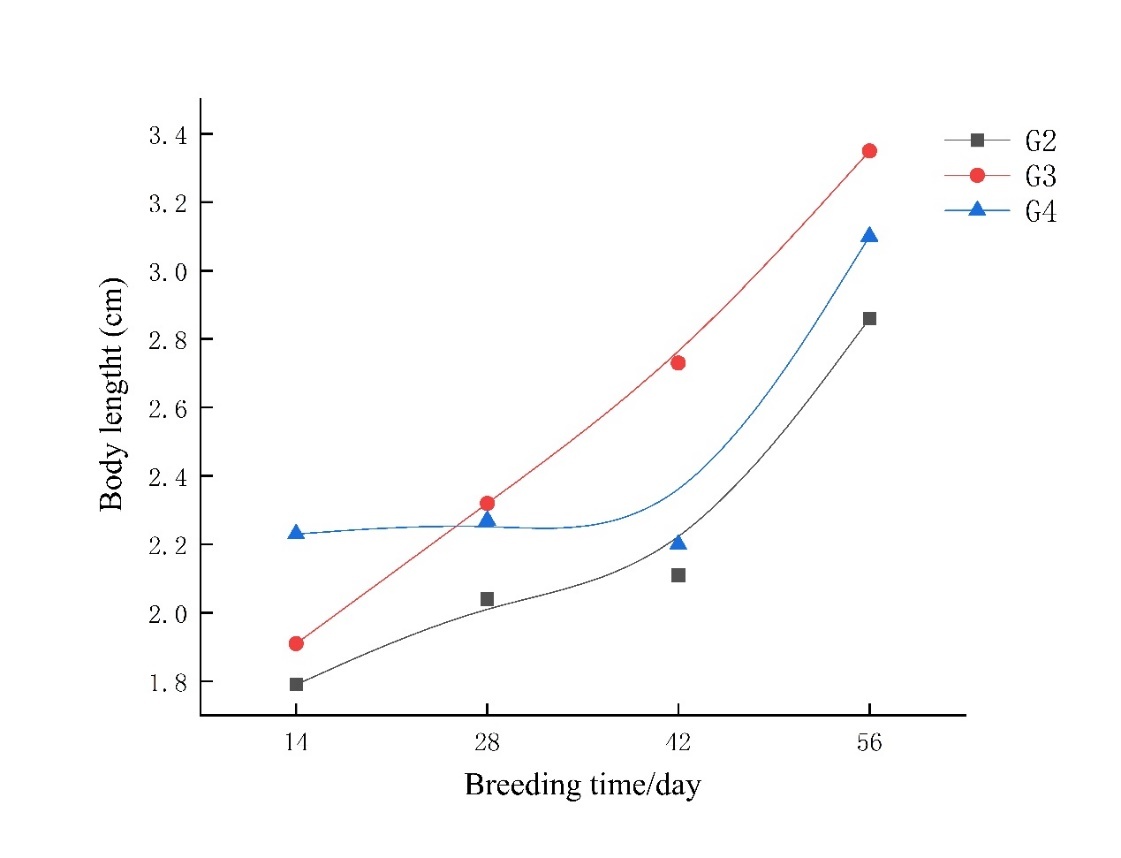
During the entire experimental period, the body length and weight of the Archocentrus nigrofasciatus var. × M. ramirezi hybrids in each group all showed an increasing trend over time, but there were significant differences in the growth rates (P<0.05) (Figures 3 and 4).
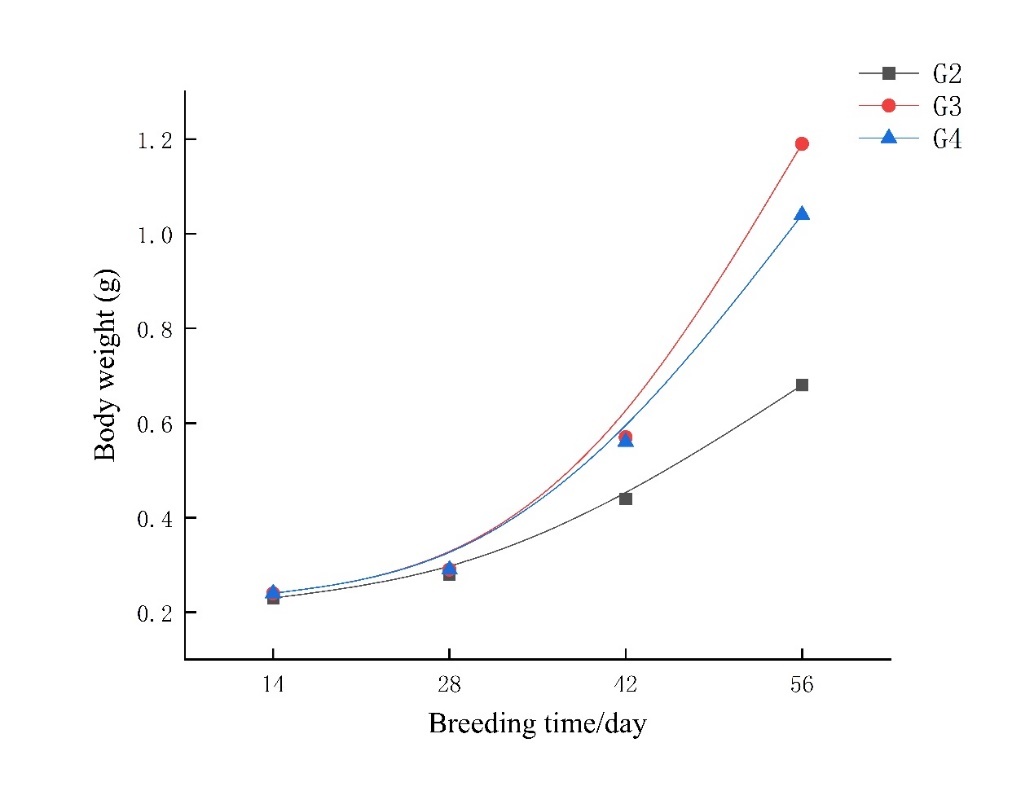

There were no significant differences in weight gain rates among groups before day 14 (P>0.05). From days 29 to 42, the weight gain rates of the Archocentrus nigrofasciatus × M. ramirezi hybrids in G3 and G4 accelerated significantly, with higher feeding frequency linked to faster growth. No significant difference was found between G3 and G4 (P>0.05). From days 42 to 56, G3 showed a higher growth rate than G4. G2 exhibited the slowest growth throughout the 56 days, while G3 and G4 gradually increased in growth as the breeding duration increased.
Body length also increased with feeding frequency, with G4 showing the highest growth and G1 the lowest. G3 showed a significant growth acceleration over time, surpassing G4 from the fifth to seventh week. G2 showed consistently low growth. G4 initially increased, then stabilized, and finally increased again towards the end. At the experiment’s conclusion, G2 had the slowest growth, with an average body length of (2.71 ± 0.39) cm and a weight of (0.63 ± 0.22 g).
3.3. Physiological indicators of liver and intestinal enzyme activities
The feeding frequency significantly affects the activities of pepsin, trypsin, amylase, and lipase in Archocentrus nigrofasciatus var. × M. ramirezi hybrids (P<0.05) (Figure 5).
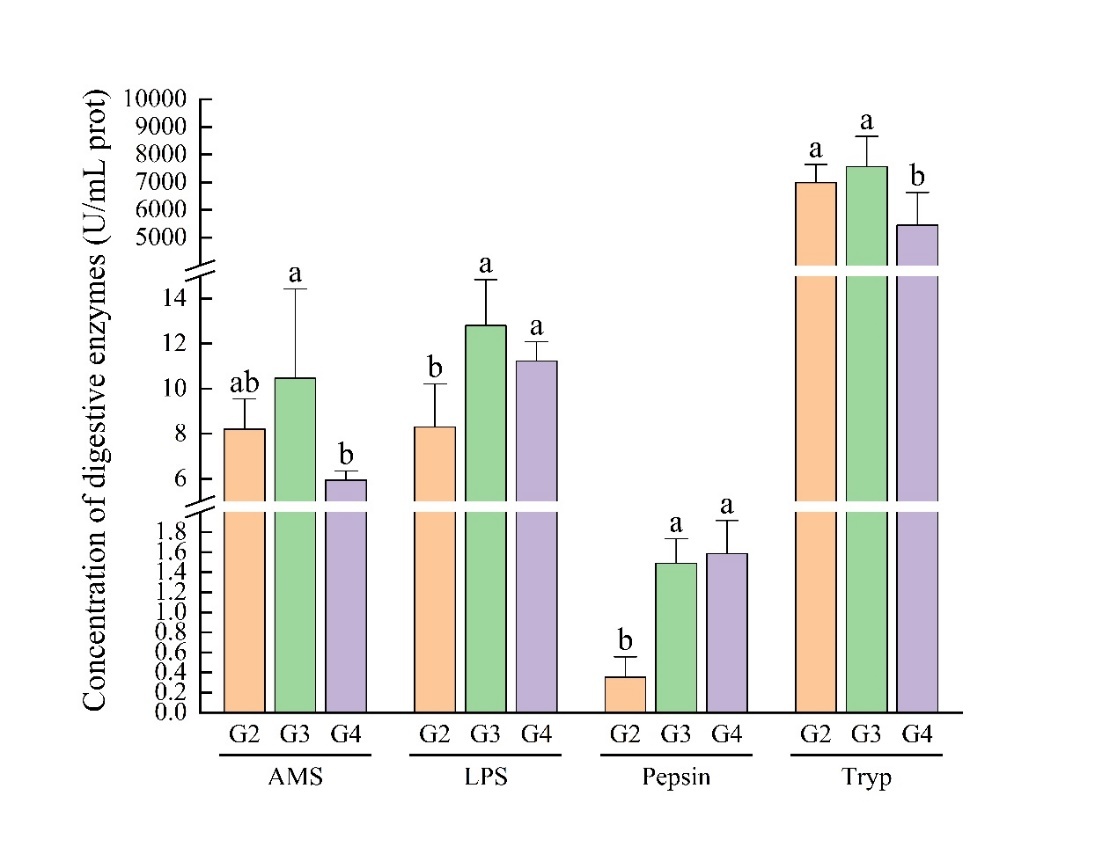
AMS (amylase): The activity in G3 was the highest (10.46 ± 3.97 U/mg prot), significantly higher than that in G4 (P<0.05); LPS (lipase): The activity in G3 was the highest (12.80 ± 2.05 U/mg prot), and the difference from G4 was not significant (P>0.05), but it was significantly higher than that in G2 (P<0.05). There was a significant difference between G4 and G2 (P<0.05), and G4 was significantly higher than G2 (P<0.05). Pepsin activity: The pepsin activity was the highest in G4 and G3, with no significant difference, and was significantly higher than that in G2 (0.35 ± 0.21 U/mg prot) (P<0.05) (Figure 5).
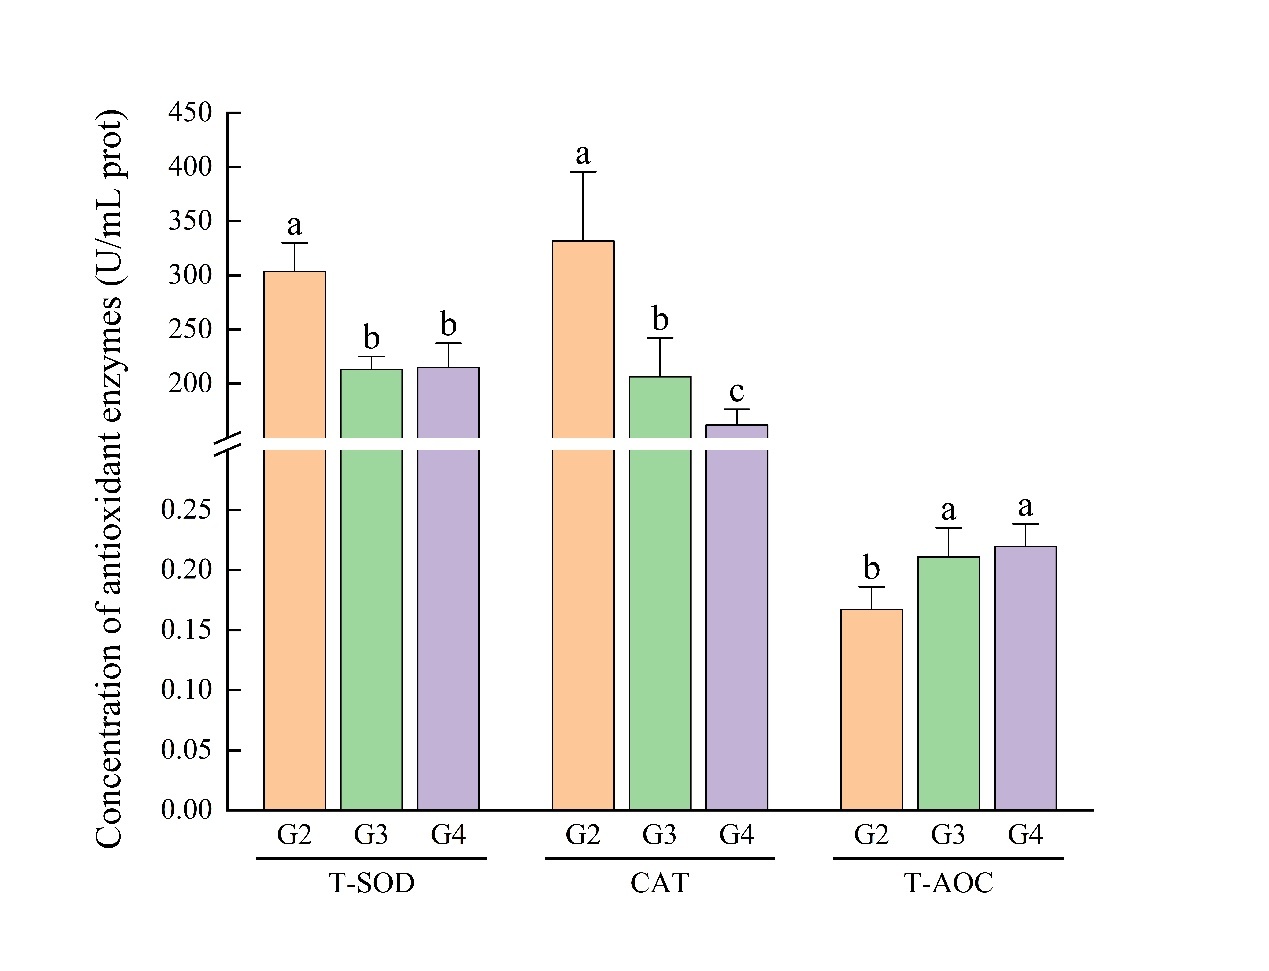
As can be seen from the results, different feeding frequencies have significant effects on the activities of T-SOD, CAT, and T-AOC in the liver of the Archocentrus nigrofasciatus var. × Mikrogeophagus ramirezi (P<0.05) (Figure 6): T-SOD (total superoxide dismutase) activity: With the increase of feeding frequency, the activity of T-SOD gradually decreases. G2 reached the maximum value (303.58 ± 26.46 U/mg prot). CAT (catalase) activity: The trend was the same as that of T-SOD. With the increase in feeding frequency, the CAT activity showed a decreasing trend. Among them, the CAT activity in G2 was the highest (331.62 ± 63.89 U/mg prot), which was significantly higher than that in G3 and G4 (P<0.05). And there was a significant difference between G3 and G4 (P<0.05). T-AOC activity: G2 showed the lowest activity (0.17 ± 0.02 U/mg prot), which was significantly lower than the other two groups (P<0.05). There was no significant difference between G3 and G4 (P>0.05) (Figure 6).

3.4. The influence of feeding frequency on the reproductive performance of Archocentrus nigrofasciatus var. × M. ramirezi hybrids
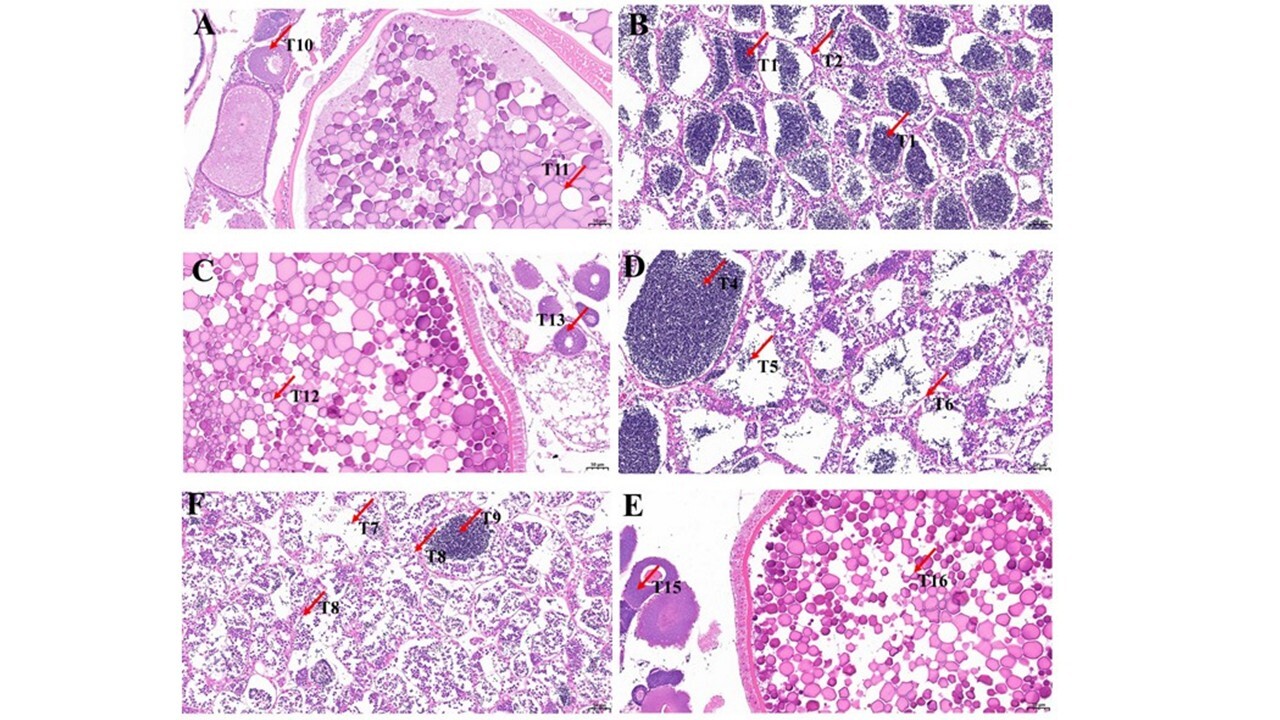
The results show that G2 has a wide variety of follicles that are closely arranged (Figure 7). Both mature and primary growth follicles are abundant and are in a stable developmental stage. G3 has a wide variety of follicles, but they are loosely arranged. It has the most mature follicles and the fewest in the primary growth phase, and they were in a rapid maturation stage. The number of follicles in G4 is large, and their arrangement is loose. There are fewer mature follicles than in G2 and G3, and more follicles in the primary growth stage than in G3. It is in the early stage of development.
_ovar.jpeg)
T11, T12, and T14 are mature follicles, while T10, T13, and T15 are primary growth follicles. The sperm in the spermatogenic tubules of T1, T4, and T9 gather towards the center of the lumen. The sperm density in the lumen of the spermatogenic tubules of T3, T5, and T7 decreases, resulting in larger voids. The walls of the spermatogenic tubules of T2, T6, and T8 become thinner, and the number of spermatogenic cells and supporting cells decreases.
In G2, sperm density decreased in some spermatogenic tubules, with a large aggregation of sperm in the lumen and thinning of tubule walls. In G3, sperm density also decreased in many tubules, with less sperm aggregation and thinner walls compared to G2. In G4, sperm density decreased further, with more significant thinning of tubule walls and reduced sperm aggregation compared to both G2 and G3. The decrease in sperm density and wall thinning was more pronounced in G4 than in G3 (Figure 7).
3.5 Fertilization rate and hatching rate of Archocentrus nigrofasciatus var. × M. ramirezi hybrid
The egg-laying volume and fertilization rate data of the hybrid fish in different feeding frequency groups were compared and analyzed. The results showed that feeding frequency significantly affected both egg-laying volume and fertilization rate (P<0.05) (Table 2). The fecundity of G2 was the lowest, averaging (88 ± 26.43) eggs, and the fertilization rate was also relatively low, at (79.38 ± 6.69) %. The number of eggs laid in G3 increased to (228 ± 57.82), and the fertilization rate rose to (89.27 ± 2.76) %. The fecundity in G4 was the highest, averaging (274 ± 48.72) eggs, but the fertilization rate was slightly lower than that in G3, reaching (88.19 ± 2.45) %. Among them, the hatching rate of G2 was the lowest, which was (76.87 ± 3.41) %. Both G3 and G4 were higher than G2, and there was no significant difference between the two groups (P > 0.05), which were (87.86 ± 2.68) % and (85.04 ± 2.33) %, respectively. However, there were no significant differences in the average egg diameter and width among the G2, G3, and G4 groups (P > 0.05) (Table 2).
3.6 The survival rate and growth rate of juvenile fish
Through statistical analysis of the survival rate and growth rate of juvenile Archocentrus nigrofasciatus var. × M. In ramirezi hybrids across different feeding frequency groups (Tables 3 and 4), it was found that feeding frequency significantly affects the early development of juvenile fish. In terms of survival rate, on the third day, there was no significant difference among the three groups (P > 0.05), which were (89.79 ± 1.83) %, (91.42 ± 4.17) %, and (92.35 ± 2.52) %. However, from the 5th day, the survival rate of fish fry in G2 was significantly lower than that in G3 and G4 (P < 0.05), which was (86.08 ± 2.63) %, and there was no significant difference between G3 and G4 (P > 0.05). However, on the 5th to 7th days, there were significant differences among the three groups (P < 0.05), with G2 having the lowest (84.22 ± 1.78%) and G3 having the highest (98.33 ± 0.52%).
Analysis of the seven-day post-hatch larval body length of Archocentrus nigrofasciatus var. × M. ramirezi hybrids across different feeding frequency groups showed that on day one, larvae in Group G2 exhibited the greatest body length. However, on the third day, there was no difference among the three groups (P > 0.05); On the fifth day, there were significant differences among the three groups (P < 0.05), with G2 having the shortest. G4 came second with a slightly larger difference in body size, while G3 was the highest. On the seventh day, G2 and G4 were almost the same, with G3 having the highest score. Moreover, a few larger-sized juvenile fish were found in G4.
4. Discussion
4.1. The influence of feeding frequency on the water quality
The optimal pH range for aquatic animals is 7-8.5. Lower pH levels can stimulate the release of gallbladder kinases and peptides in the intestines, thereby suppressing appetite and reducing fish intake.21 This impacts aquaculture systems, as lower pH reduces foraging rates in fish.22 Research indicates that a weakly alkaline pH range (7.8-8.3) supports good growth in Pterophyllum scalare.23 High concentrations of ammonia nitrogen (NH3-N) and nitrites (NO2-N) can irritate fish gills, impair breathing, and disrupt osmotic balance and immune function, ultimately decreasing disease resistance.24 Pedersen et al.25 found that NH3-N and NO2-N levels increase with higher feeding loads, which aligns with our findings.
In this study, pH fluctuated between 7 and 8.1, within the safe range for aquaculture, with no significant differences among the three feeding frequencies. Ammonia nitrogen levels increased with feeding frequency, with a slight decrease in the middle. The recirculating aquaculture system reduced ammonia nitrogen due to water changes, but feed and manure buildup over time led to a continuous rise in ammonia nitrogen levels. The ammonia nitrogen content in G2 and G3 suggests that feeding twice or three times per day resulted in better feeding efficiency and less leftover feed. Therefore, the water quality of the aquaculture water bodies in groups G2 and G3 is better than that in group G4. The pH and ammonia nitrogen contents are both within the normal range, and the feeding effect on fish is also better.
4.2. The influence of feeding frequency on the growth of the Archocentrus nigrofasciatus var. × M. ramirezi hybrids
Higher feeding frequencies improve fish growth primarily by increasing daily feed intake. For instance, in juvenile Pseudobagrus ussuriensis, growth metrics such as final body weight, specific growth rate, and daily weight gain all improved with increased feeding frequency.26 Conversely, insufficient feeding frequency can lead to prolonged hunger and slow growth. A study on Paralichthys olivaceus found that reduced feeding frequency significantly decreased growth performance, consistent with our findings, in which the growth of Archocentrus nigrofasciatus × M. ramirezi hybrids slowed with lower feeding frequencies.
However, once feeding frequency exceeds a certain point, further increases do not enhance growth. For example, feeding Takifugu rubripes 2 to 4 times a day showed no significant changes in growth metrics,27 also observed in Elopichthys bambusa,28 Selenotoca multifasciata,29 and Lateolabrax maculatus.30 In this study, G3 and G4 showed significantly better growth than G2, with G4 having the highest growth rates. However, no significant difference in survival rate was observed among the groups.
Some studies, such as those on Acipenser persicus31 and Acipenser schrenckii × A. baeri,32 suggest continued growth with increasing feeding frequency. This could be due to the species-specific response or the feeding frequency not reaching its maximum potential in the experiment. Overall, G3 showed optimal growth, offering the best balance between growth improvement and breeding cost.
4.3. The influence of feeding frequency on the physiological enzyme activity of the Archocentrus nigrofasciatus var. × M. ramirezi hybrids.
Changes in digestive enzyme activity are closely related to digestion, nutrient absorption, and nutrient availability. The digestive level of fish is usually judged by the activity of digestive enzymes.33 The increase in amylase and lipase can promote the digestion and absorption of carbohydrates, fats, and proteins in feed, providing more nutrients for fish growth.34 During the digestive physiological process of the Archocentrus nigrofasciatus var. × M. ramirezi hybrids. AMS, LPS, pepsin, and trypsin are the core functional enzymes; they respectively dominate the catabolism of carbohydrates, fats, and proteins. With increased feeding frequency, the effects on the activities of these four enzymes showed a trend of “first rising and then falling”. The AMS activity was highest in G3, consistent with research on Leiocassis longirostris.35 The study found that as the feeding level increased, the activities of AMS and trypsin first increased and then decreased, indicating that when the feeding level was relatively high, the activities of digestive enzymes decreased. The amylase activity in the 3 times/day feeding group was higher than that in the 2 times/day feeding group. Frequent feeding can maintain a continuous intestinal demand for carbohydrate decomposition, whereas low-frequency feeding may disrupt the AMS secretion rhythm due to excessively long intestinal emptying time. However, when the feeding frequency exceeds 4 times a day, the activity of AMS may no longer increase or even decrease. Similar to the behavior of juvenile Oreochromis aureus × Oreochromis niloticus.36 Excessive feeding can lead to rapid emptying of the digestive tract contents and reduce the efficiency of enzyme-substrate interaction. However, low-frequency feeding may lead to reduced LPS activity due to insufficient fat intake, and pepsin may remain in a low-activated state for a prolonged period, thereby reducing its activity. However, high-frequency feeding may inhibit enzyme secretion due to excessive load on the digestive tract. Trypsin, the core protease secreted by the pancreas, shows the most significant response in its activity to feeding frequency. The trypsin activity of the Archocentrus nigrofasciatus var. × M. ramirezi hybrids reached their peak in G3, which was consistent with the results of Leiocassis longirostris: The trypsin activity in the 3 times/day feeding group was higher than that in the 2 times/day feeding group and the group with excessively high feeding levels.35 The likely mechanism is that frequent feeding continuously stimulates pancreatic secretion, disrupting the normal rhythm of trypsin synthesis, as evidenced by the marked decline in trypsin activity observed in juvenile Cyprinus carpio following periods of starvation. This suggests that the G3 group exhibits the most efficient digestion and utilization of carbohydrates, lipids, and proteins.
Previous research indicates that insufficient feeding frequency not only leads to oxidative damage but also causes immune suppression.37 In this study, both T-SOD and CAT decreased with increasing feeding frequency, and G2 had the highest. At high feeding frequencies, fish overeat, leading to a sudden increase in metabolic rate and a large accumulation of reactive oxygen species (ROS) produced by the mitochondrial respiratory chain. When the ROS generation rate exceeds the clearance capacity of T-SOD and CAT, it triggers an oxidative stress response. Long-term high-intensity oxidative stress may inhibit T-SOD and CAT synthesis or disrupt enzyme structure. This conclusion was drawn from the Leiocassis longirostris35 study: when the feeding frequency increased from 2 times/day to 3 times/day, T-SOD activity decreased significantly, indicating that a high feeding frequency reduces antioxidant enzyme activity by intensifying oxidative stress. Similarly, this mechanism was directly verified in the study of Acanthopagrus schlegelii × Pagrus major.38 When the feeding frequency increased from once /d to twice /d, the T-SOD activity of hybrid sea bream significantly increased (P<0.05). However, when it continued to increase by 3-4 times/d, CAT activity significantly decreased, consistent with the trend in T-SOD activity. It indicates that an excessively high feeding frequency inhibits antioxidant enzyme activity by disrupting the oxidative balance. At a feeding frequency of 4 times a day, the total plasma protein and albumin contents of Micropterus salmoides significantly decreased, and liver function indicators (such as alanine aminotransferase) were abnormal, suggesting that the increased metabolic burden may indirectly lead to a decrease in CAT activity by affecting the liver’s synthetic function.39 In this study, the Archocentrus nigrofasciatus var. × M. ramirezi hybrids, as a hybrid variety, may have a more sensitive metabolic regulation ability. The imbalance in energy distribution caused by frequent feeding may have a more obvious inhibitory effect on CAT synthesis. In this study, T-AOC increased with increasing feeding frequency and was relatively consistent across G3 and G4. Our results are consistent with those of a study conducted on Micropterus salmoides. The T-AOC in the group fed twice a day was significantly higher than that in the group fed once a day, indicating that appropriately increasing the feeding frequency could enhance the total antioxidant capacity of the Micropterus salmoides intestine.39 This indicates that T-SOD, CAT, and T-AOC activities in the G3 of Archocentrus nigrofasciatus var. × M. ramirezi hybrids are the highest, indicating the best physiological performance. Based on the comprehensive data analysis, the Archocentrus nigrofasciatus var. × Mikrogeophagus ramirezi in G3 had the best digestion and utilization rates of carbohydrates, fats, and proteins, and also had the best activity of antioxidant enzymes.
4.4. The influence of feeding frequency on the gonadal development of the Archocentrus nigrofasciatus var. × M. ramirezi hybrids
Feed is the strongest exogenous factor influencing the growth of organisms and other physiological mechanisms. The quantity of feed significantly affects fish reproduction.40 Relevant studies have shown that the ovaries of low-feeding fish mainly contain oocytes in the early pre-yolk production and early yolk production stages, while those of high-feeding fish mainly contain oocytes in the late yolk production/maturation stage. This is consistent with our results. It has also been confirmed in many bony fish that reducing food ration delays maturation and spawning and lowers reproductive capacity.41
Based on a comprehensive assessment of spermatogenic function and the structure of spermatogenic tubules, the structural damage and insufficient sperm production in G4 were the most severe, while those in G3 were the mildest. The ranking of the three development levels is as follows: Group G3 is the best. G3 is characterized by the most mature follicles and the fewest reserve follicles, and the ovaries advance most fully into the reproductive stage. G4 is characterized by the fewest mature follicles and a large number of reserve follicles as its core features, and the process of ovarian maturation is delayed. All the indicators of G2 are in the middle, making it the individual with the most balanced development among the three. From this, it can be known that G3 has the highest maturity, while G4 has the lowest. Comprehensive analysis shows that the feeding frequency of G3 is the most optimal for gonadal development.
4.5. The influence of feeding frequency on the reproductive performance of the Archocentrus nigrofasciatus var. × M. ramirezi hybrids
Feeding and nutrition are among the most critical variables affecting the growth and reproductive potential of cultured fish, directly determining spawning quantity, fertilization rate, egg quality, embryo development, and fry quality, and are the foundation for the successful breeding of aquaculture seed.42 Good digestive and absorptive functions also provide sufficient nutritional support for gonadal development and reproduction, thereby positively impacting reproductive performance. Studies involving other types of fish often find that food restrictions can lead to a decline in reproductive capacity, for instance, Danio rerio.41 Moreover, this phenomenon has also been verified in Litopenaeus vannamei. The reproductive performance of the parent shrimp is closely related to the accumulation of nutrients in the parent shrimp during the breeding period and the continuous supply of feed. When the quantity and quality of food cannot well meet the gonadal development needs of parent shrimp, it will greatly affect the egg-laying quantity, embryo development, and the survival rate of larvae of parent shrimp.30 This aligns with the findings of the present study, in which spawning volume, fertilization rate, and hatching rate all increased with higher feeding frequencies, and the growth and survival of larvae followed the same trend. Overall, Group G3 demonstrated significant advantages in egg production, fertilization, hatching success, and larval growth and development.
5. Conclusion
Feeding frequency significantly influences the growth, reproductive performance, and physiological responses of Archocentrus nigrofasciatus var. × M. ramirezi hybrids. Feeding three times daily optimized growth, gonadal development, digestive enzyme activity, and larval survival and growth, while maintaining high fecundity, fertilization, and hatching rates. Insufficient feeding (G2 and G4) was less effective. These results suggest that a three-times-daily feeding schedule provides the optimal balance for growth and reproduction, offering practical guidance for the scientific breeding and artificial reproduction of this hybrid.
Acknowledgment
The study was supported by the Hainan University Innovation Team Project Funding and the specific research fund of the Innovation Platform for Academicians of Hainan Province (RZ2000008651).
Authorship contributions
Writing – review & editing: Yifang Zhao (Lead). Writing – original draft: Yifang Zhao (Lead). Visualization: Yifang Zhao (Lead). Validation: Yifang Zhao (Lead). Software: Yifang Zhao (Lead). Resources: Yifang Zhao (Equal), Jiaxin Xiao (Equal). Methodology: Zohaib Noor (Equal), Miss Srisuda Kongtaworn (Equal), Yaohua Shi (Equal). Investigation: Zohaib Noor (Lead). Formal Analysis: Zohaib Noor (Lead). Data curation: Miss Srisuda Kongtaworn (Lead). Conceptualization: Jiaxin Xiao (Lead). Supervision: Yaohua Shi (Equal), Zhifeng Gu (Equal). Funding acquisition: Zhifeng Gu (Lead). Project administration: Zhifeng Gu (Lead).
Ethical Conduct Approval – IACUC
The study was conducted in accordance with the approval and guidelines of the Science & Technology Ethics Committee/Biosafety Committee (STEC) at Hainan University, Haikou, China.
Informed Consent Statement
All authors and their respective institutions have reviewed and approved this manuscript for publication.
Data Availability Statement
All are available upon request.