1. Introduction
Aquatic products are China’s largest export agricultural product and have maintained a trade surplus for many years. The healthy development of aquatic product exports not only promotes supply-side structural reforms in the domestic aquatic industry, supports rural revitalization, and increases employment opportunities for fishermen, but also helps to optimize the allocation of fishery resources and establish a new pattern of opening up the fishery industry. However, the rise of anti-globalization, Sino-US trade frictions, geopolitical conflicts, and other unforeseen events have increased the uncertainty of aquatic product trade and, to some extent, reshaped the trade landscape.1 China’s aquatic product trade reached a turning point in 2022, marking the beginning of an era of trade deficits. From the perspective of national food security, long-term trade deficits in terms of trade volume, product structure, and trading partners are highly likely to lead to “path dependence” in trade, thereby creating “chokepoint” risks that threaten the foundation of China’s food security.2 Meanwhile, as trade liberalization levels continue to rise, adjustments to traditional tariff and non-tariff barriers have become less effective in promoting international trade.3 Against this backdrop, exploring the impact of trade facilitation aimed at reducing trade costs on aquatic product exports holds significant implications for the development of China’s aquatic product trade.
The Regional Comprehensive Economic Partnership Agreement (RCEP) is a modern, comprehensive, high-quality, and mutually beneficial free trade agreement. It is also the world’s largest free trade agreement in terms of population, trade volume, and development potential. The implementation of RCEP has deepened economic and trade relations among partner countries, reduced institutional costs caused by the “spaghetti bowl” effect,4,5 and brought new development opportunities for China’s aquatic product trade . On the one hand, China and other RCEP member countries are important partners in aquatic product trade, and bilateral economic and trade relations will become even closer with the entry into force of the RCEP. In 2023, China’s aquatic product exports amounted to 21.2 billion U.S. dollars, with 10.81 billion U.S. dollars exported to other RCEP member countries, accounting for a staggering 51.0%6; on the other hand, trade facilitation is a key component of the RCEP provisions , and the implementation of the RCEP will further enhance trade facilitation levels within the region, directly impacting agricultural cooperation between China and other RCEP member countries and exerting a significant promotional effect on bilateral aquatic product trade. Therefore, measuring the trade facilitation levels of RCEP member countries and analyzing their impact on China’s aquatic product exports can better leverage the policy dividends of the RCEP and elevate the level of trade development between China and other RCEP member countries.
Existing literature on the relationship between trade facilitation and international trade development primarily focuses on two aspects. The first involves research on trade facilitation itself, including analyses of its definition, the construction of indicator systems, and measurement methods.7–12 The second examines the impact of trade facilitation on international trade, specifically the trade effects of trade facilitation, with studies conducted from both macro and micro perspectives.13–15 At the macro level, the literature includes studies that adopt a global perspective8 as well as analyses focused on specific regions or countries.16,17 Aquatic products have high perishability and are difficult to store, making aquatic product trade more susceptible to the effects of trade facilitation compared to general agricultural products. Based on previous literature and the characteristics of aquatic product trade, this paper constructs a trade facilitation level measurement indicator system suitable for this study and incorporates the measurement results into an extended gravity model for empirical testing. In the early stages of the new development pattern and the full implementation of the RCEP, using ex-ante data to explore the impact of trade facilitation on China’s aquatic product exports not only verifies the initial design of the RCEP but also provides insights for the future development of China’s aquatic product trade.
2. Analysis of China’s current exports of aquatic products to other RCEP member countries
All data in this section are from the United Nations Conference on Trade and Development (UNCTAD) Trade Statistics Database. The quartile HS codes are globally standardized trade product codes, compiled in accordance with the annexes of the RCEP Agreement. Aquatic products primarily include 18 items (0301-0309, 0508, 1504, 1604, 1605, 020840, 021092, 12122, 7101, 711610), Among these, 0301-0304, 0306-0308, 0508, 12122, and 7101 are primary aquatic products, while the remaining items are processed aquatic products.18,19
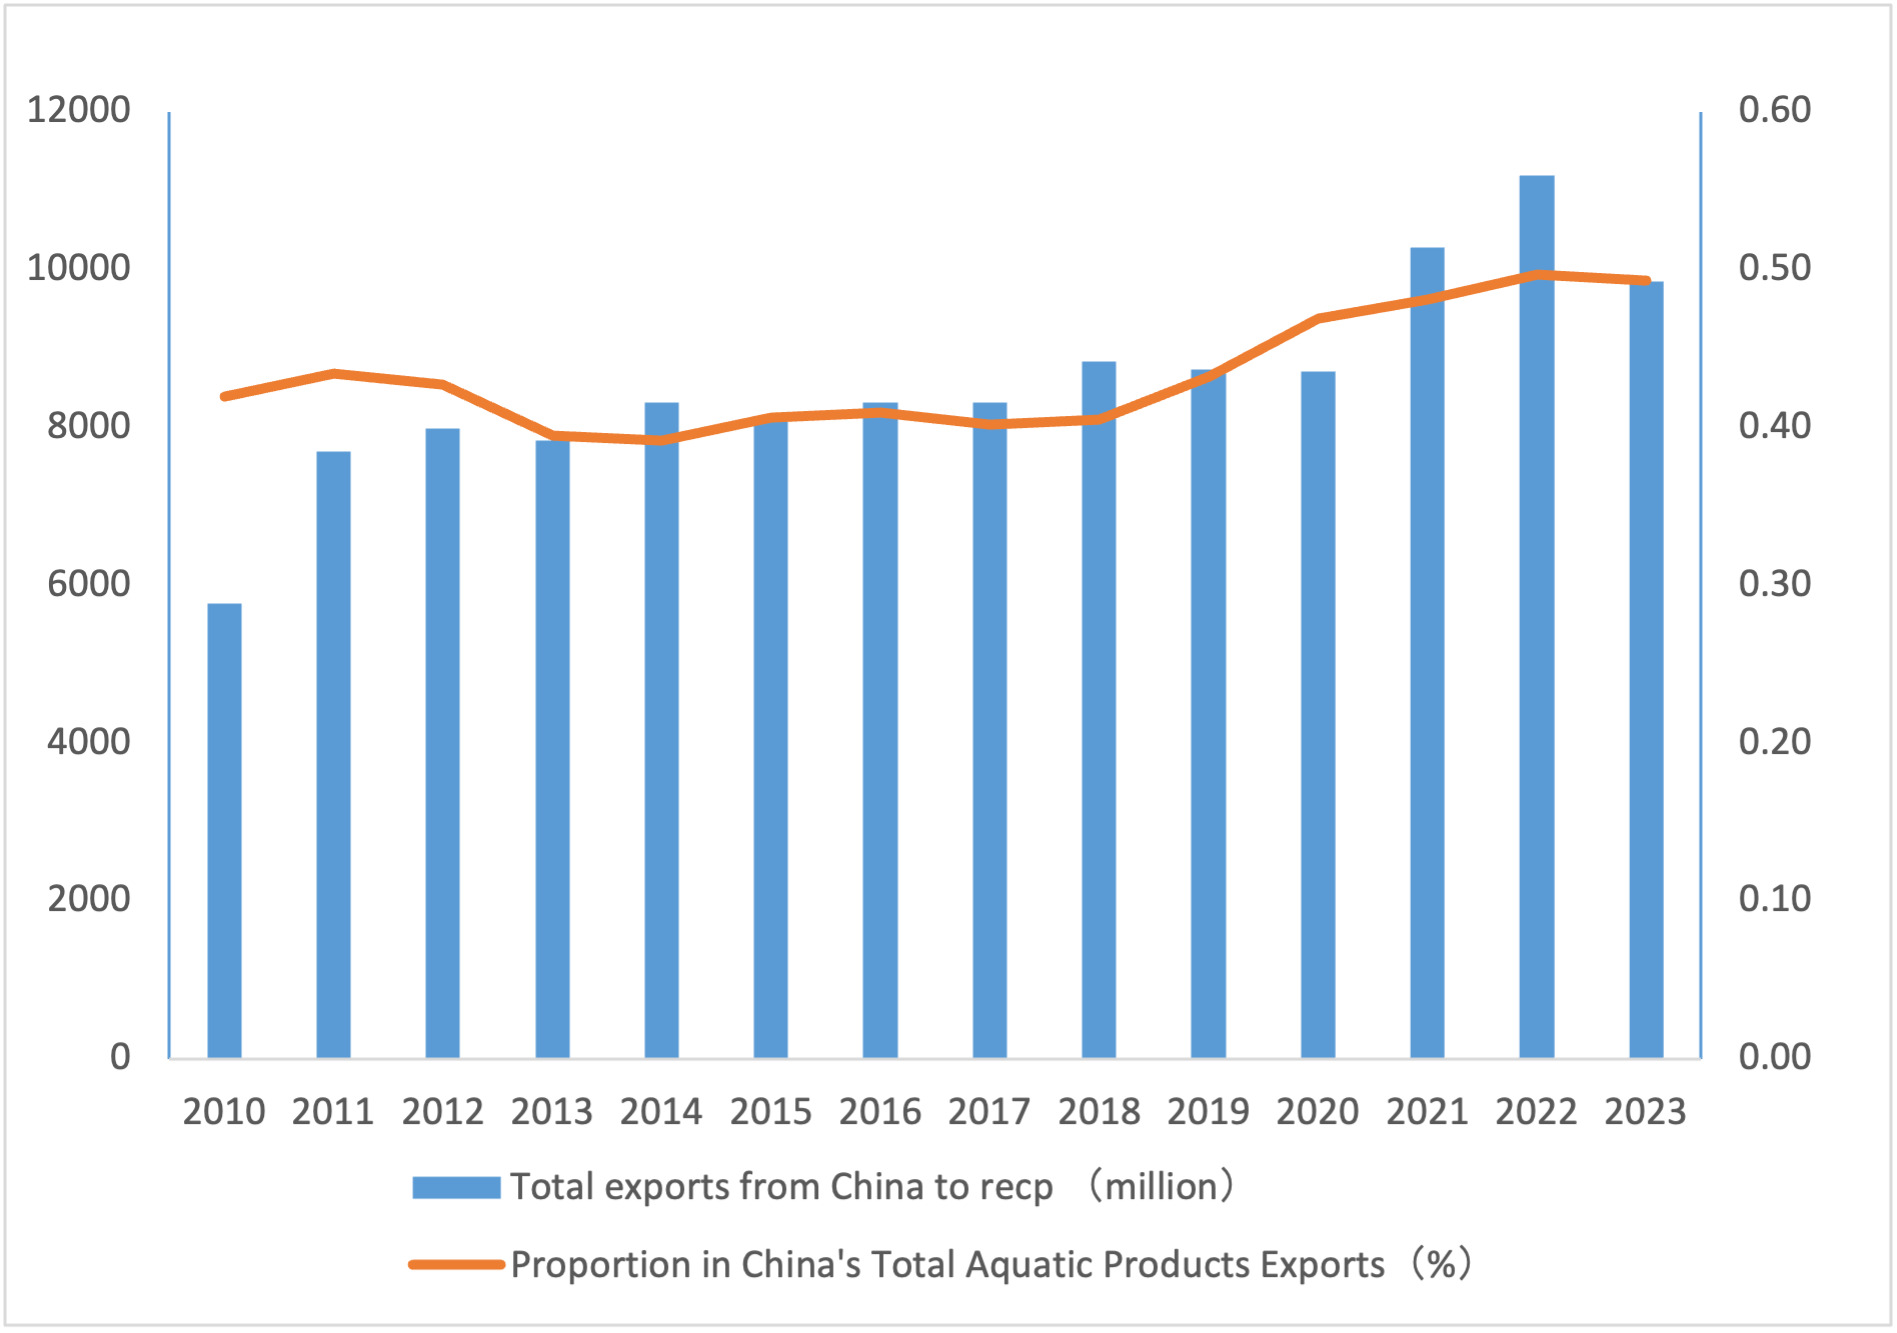
Overall, from 2010 to 2023, China’s exports of aquatic products to other RCEP member countries showed an expanding trend but with a slowing growth rate. In terms of export share, China’s exports of aquatic products to other RCEP member countries accounted for approximately 40% of China’s total aquatic product exports, fluctuating around this high level over the years. In the past five years, the growth trend has been strong, with the share approaching 50% in 2022 and 2023. In terms of export value, China’s exports of aquatic products to other RCEP member countries increased from USD 5,769.80 million in 2010 to USD 11,192.16 million in 2022, with an average annual growth rate of 5.23%, as shown in Figure 1.

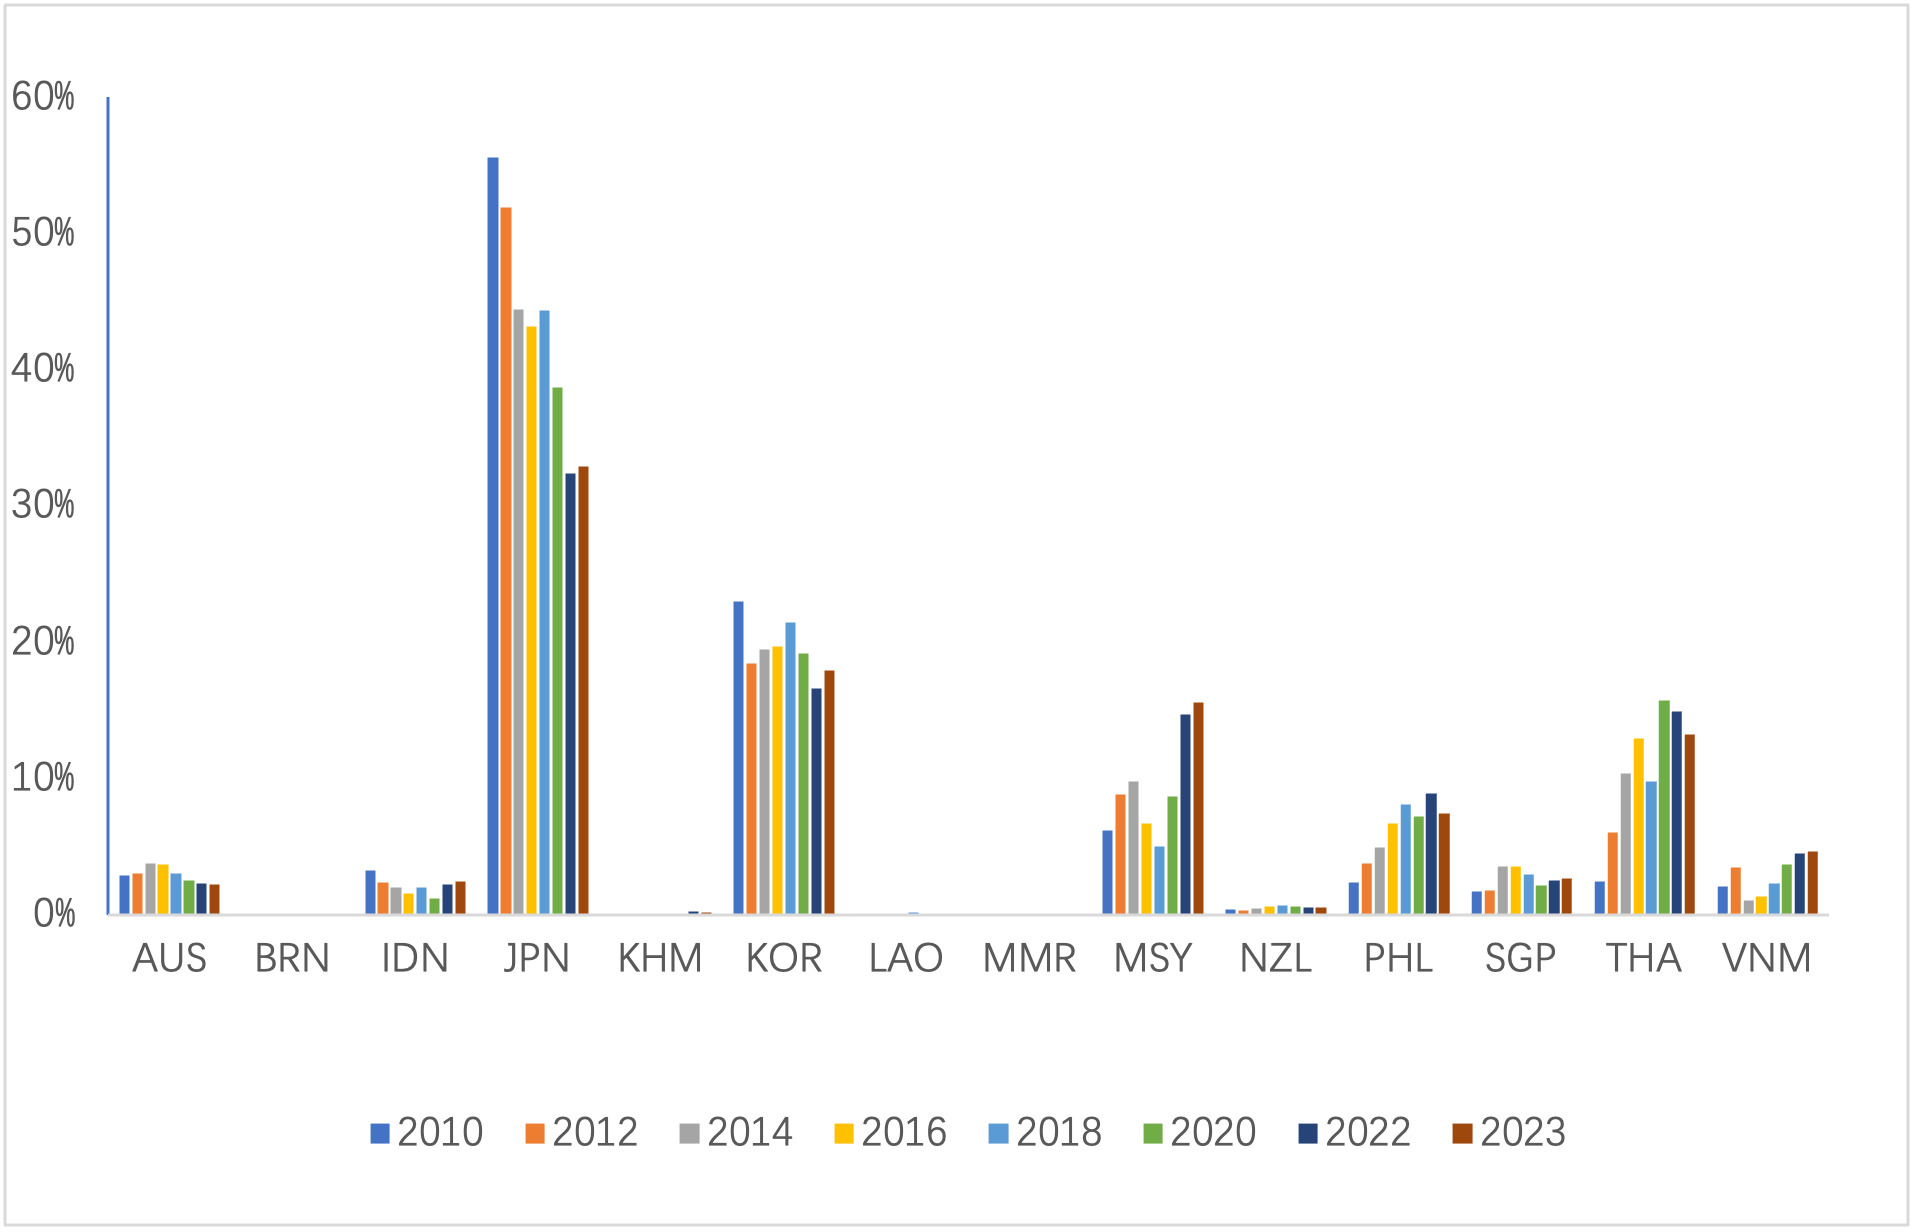
From the perspective of export market distribution, at the average level, among other RCEP member countries, Japan, South Korea, and Thailand are China’s top three aquatic products export markets. A horizontal comparison reveals that within the RCEP region, China’s aquatic products are primarily exported to Japan, South Korea, Thailand, Malaysia, and the Philippines, with Brunei, Cambodia, Laos, and Myanmar accounting for a smaller share. A vertical comparison shows that in recent years, the proportion of aquatic products exported by China to Japan and South Korea has been declining. Taking Japan as an example, in 2010, China’s aquatic products exports to Japan accounted for 55.58% of China’s total aquatic products exports to the entire RCEP region. By 2023, this proportion had decreased to 32.92%, a decline of 40.77%.
Meanwhile, the proportion of aquatic products exports to Malaysia and Thailand showed an overall upward trend. Taking Thailand as an example, in 2010, Thailand’s share was only 2.47%, but by 2023, it had increased to 13.26%, representing a growth of 436.84%. Meanwhile, countries with previously lower shares, such as Vietnam, Singapore, and Cambodia, have shown positive trends. For example, Vietnam’s share was 2.09% in 2010, but by 2023, it had increased to 4.69%, marking a growth of 124.40%.

From the perspective of exported aquatic product categories, between 2010 and 2020, primary aquatic products consistently accounted for a higher proportion of China’s exports to other RCEP member countries than processed aquatic products; in 2022, processed aquatic products surpassed primary aquatic products. Among primary aquatic products, the HS codes with the highest export values were 0303 and 0307. Among processed aquatic products, those with HS code 1605 were China’s largest processed aquatic product exports. Due to space constraints, only data for selected years are presented.
From the perspective of the average explicit comparative advantage index, New Zealand, Myanmar, Vietnam, Thailand, and Indonesia possess extremely strong comparative advantages, while the Philippines has relatively strong comparative advantages. Looking at China’s explicit comparative advantage index, it has shown a downward trend from 2010 to 2023, indicating that China’s competitiveness in the international trade of aquatic products is gradually weakening, especially as Southeast Asia’s trade advantages in aquatic products have been continuously strengthening in recent years, leading to an increasingly intense competitive landscape.
From the perspective of the average trade complementarity index, China’s trade complementarity index for aquatic products with Japan, South Korea, Thailand, and Brunei exceeds 1, indicating that China’s aquatic product exports have extensive prospects for cooperation with these countries. In addition, China’s trade complementarity index for aquatic products with Australia, Vietnam, Malaysia, New Zealand, and the Philippines is greater than 0.5, indicating that China’s aquatic product exports have relatively strong complementarity with these countries.
As can be seen from the above analysis, there is significant potential for further development in China’s aquatic product trade with other RCEP member countries. Exploring the impact of the trade facilitation provisions in the RCEP agreement on aquatic product exports can provide valuable insights for the steady development of China’s aquatic product trade and the assurance of food security.
3. Calculation of Trade Facilitation Levels Among RCEP Member Countries
(1) Establishment of an indicator system
Trade facilitation encompasses a comprehensive set of measures designed to simplify trade procedures, enhance trade efficiency, and reduce trade costs through the application of policy frameworks and technological innovations. To date, there is no universally accepted definition of trade facilitation. This paper draws on the research of scholars such as Fu J ,Chen L, Xue H,20 following the approach of Wilson7 and others in constructing an indicator system to measure the level of trade facilitation. It combines the relevant provisions of the Trade Facilitation Agreement to establish an indicator system comprising four primary indicators: infrastructure, customs environment, government regulation, and finance and e-commerce, and 16 secondary indicators. To reflect the characteristics of aquatic product (agricultural product) trade, the existing indicator system has been appropriately adjusted to include agrarian policies. Considering the authority and availability of data, all data are sourced from the Global Competitiveness Report. Due to severe data gaps in some countries, this study ultimately selected 12 countries from the RCEP member states for analysis, covering the time period from 2010 to 2018. The trade facilitation indicator system is detailed in Table 4.
(2) Data processing and weight determination
a. Data standardization
To make the indicator data more comparable, it is necessary to eliminate the influence of the secondary indicator data dimensions. This paper uses the extreme value standardization method to convert the indicator value of the Internet user ratio. represents the specific value of the Internet indicator, represents the maximum value of the Internet indicator, and represents the minimum value of the indicator. The specific conversion formula is as follows:
X∗=(Xi−Xmin)/(Xmax−Xmin)
b. Relevance test and determination of indicator weights
The use of principal component analysis requires that the data meet certain criteria. In this study, the KMO test was conducted using Stata software, yielding a KMO value of 0.853. According to Kaiser’s criteria, it can be inferred that there is a strong correlation among the secondary indicators. Therefore, the indicator data in this study are suitable for principal component analysis. Consequently, principal component analysis was employed to reduce the dimensionality of the secondary indicators, followed by objective weighting. According to the information extraction criteria, factors with eigenvalues greater than 1 in the correlation coefficient matrix need to be extracted. Table 5 shows the eigenvalues and contribution rates of each principal component. A total of three principal components were selected, with a cumulative contribution rate of 87.15%, indicating that these three principal components can reflect most of the indicator information.
Based on the results of the component matrix, the expressions of the three selected principal components can be obtained as follows:
Comp 1=0.8207T1+0.6442T2+0.9154T3+0.8972T4+0.9496C1+0.7787C2+0.9829C3+0.5731R1+0.6807R2+0.9124R3+0.9617R4+0.8898R5+0.8243F1+0.7780F2+0.6217F3+0.7608F4
Comp 2=−0.4635T1−0.6225T2−0.2366T3−0.1879T4−0.1177C1+0.4797C2+0.0147C3+0.6275R1+0.3379R2+0.2642R3+0.1539R4+0.0128R5−0.3326F1−0.4229F2+0.4152F3+0.3228F4
Comp 3=0.1980T1+0.2766T2+0.2261T3+0.1223T4−0.2143C1−0.0860C2+0.0455C3+0.1193R1+0.6055R2−0.0073R3+0.0447R4−0.3550R5−0.2637F1−0.1988F2+0.0970R3−0.4217R4
The Comp column represents the total score for each secondary indicator, calculated by multiplying the coefficient of each extracted principal component by its variance contribution rate, dividing by the cumulative contribution rate of the three extracted principal components (87.15%), and then summing the results. The Comp column is then normalized to obtain the weight of the corresponding secondary indicator.
The final weights for the primary indicators of trade facilitation were calculated as follows: Infrastructure (T) = 0.2345, Customs Environment (C) = 0.2114, Government Regulation (R) = 0.3316, and Finance and E-commerce (F) = 0.2225.
The comprehensive index of the trade facilitation evaluation indicators for RCEP member countries is as follows:
TF=0.0574T1+0.0421T2+0.0682T3+0.0668T4+0.0694C1+0.0662C2+0.0758C3+0.0541R1+0.0617R2+0.0738R3+0.0763R4+0.0657R5+0.0562F1+0.0518F2+0.0545F3+0.0600F4
(3) Analysis of trade facilitation levels
Drawing on existing literature, the criteria for evaluating trade facilitation levels are as follows: a score of 0.8 or above is considered highly convenient, 0.7–0.8 is relatively convenient, 0.6–0.7 is generally convenient, and a score below 0.6 is inconvenient.21 Based on the calculated trade facilitation levels of the 12 countries within the RCEP region, the following conclusions can be drawn:
In terms of the average level of trade facilitation, the 12 countries within the RCEP region have a trade facilitation level of 0.6448, which is considered moderately convenient. This indicates that there is significant room for improvement in the overall trade facilitation level within the RCEP region. From a trend perspective, the average trade facilitation level increased from 0.6361 in 2010 to 0.6448 in 2018, indicating that trade facilitation within the RCEP region has gradually improved, sending a positive signal for further enhancements in trade facilitation levels.
From a country-specific perspective, based on average values, among the 12 countries in the RCEP region, Singapore and New Zealand are classified as highly convenient countries, with average values of 0.8623 and 0.8087, respectively; Australia, Japan, and Malaysia are classified as moderately convenient countries, with average values of 0.7325, 0.7302, and 0.7246, respectively; South Korea and China are classified as generally convenient countries, with average values of 0.6347 and 0.6127, respectively; and the countries classified as less convenient are Thailand, Indonesia, Vietnam, the Philippines, and Cambodia.
4. Model settings, variable descriptions, and data sources
(1) Model building
The gravity model is the most widely used in international trade. Its concept originates from the law of universal gravitation in physics, which states that the scale of trade between two countries is directly proportional to their GDP and inversely proportional to the square of the distance between them. The standard gravity model primarily comprises three types of explanatory variables, which measure market size, geographical location, and the presence of preferential trade arrangements. Its general form is as follows:
Fij=∂0M∂1iM∂2jD∂3ijA∂4ij
In this equation, represents the scale of trade between the two countries, typically expressed in terms of trade value or trade volume; and are variables measuring the level of economic development between the two countries, typically represented by their GDP; denotes the geographical distance between the two countries; and represents other factors that promote or hinder the development of bilateral trade. To facilitate regression analysis, the standard model is typically log-transformed, resulting in the following model transformation:
lnFij=∂0+∂1lnMi+∂2lnMj+∂3lnDij+∂4lnAij+δijt
In subsequent studies, relevant scholars expanded the standard gravity model by introducing more variables. In line with the objectives of this study, variables such as trade facilitation levels and tariffs were added to the original model. The specific model is as follows:
lnYijt=∂0+∂1lnGDPit+∂2lnGDPjt+∂3lnDISijt+∂4lnTFjt+∂5ln Tariff jt+∂6lnASEANjt+δijt
In this context, i and j represent different countries, where j is the importing country and i is the exporting country, and t denotes the year. Specifically, in this study, i refers to China, and j refers to other RCEP member countries. represents the value of China’s exports of aquatic products to country j in year t; represents the GDP of country i in year t, which in this study refers to China’s GDP in year t; represents the GDP of country j in year t,in this study, it represents the GDP of other RCEP member countries in year t; denotes the trade distance between country i and country j in year t; denotes the trade facilitation level of country j in year t, which in this study represents the trade facilitation level of other RCEP member countries in year t; denotes the tariff level of country j in year t; is a dummy variable indicating whether country j belongs to the ASEAN organization in year t; is a constant term; and is the random error term.
(2) Variable descriptions and data sources
Y, Y1, and Y2 are the explained variables in equation (7), representing the total value of China’s aquatic product exports to country j, the value of exports of primary aquatic products, and the value of exports of processed aquatic products, respectively.
represents the economic scale of exporting country i, which reflects a country or region’s export capacity. Generally, potential export capacity is directly proportional to the total economic scale. represents the economic scale of importing country j, which reflects a country or region’s international market demand capacity. Similarly, potential import demand is directly proportional to the economic scale. In the gravity model, the larger the values of these two indicators, the larger the trade volume between the two countries.
represents the trade distance between the two countries. Trade distance is the main physical barrier to cross-border trade, calculated by adjusting the distance between the capitals of China and country j using the weighted crude oil price for each year. Generally, the greater the distance between two countries, the higher the cost of trade, which, to some extent, weakens the incentive for trade between the two countries and leads to a decline in bilateral trade volume. However, with the improvement of infrastructure and logistics technology, the distance barrier effect on trade is gradually diminishing.
represents the trade facilitation level of importing country j, and this level has a positive effect on China’s exports. It is generally believed that trade facilitation measures promote trade by reducing trade costs. Transaction cost theory suggests that complex trade procedures increase transaction costs, while prolonged customs clearance times, complicated clearance procedures, and processes may cause operators to miss business opportunities. These adverse factors reduce the suitability of a country’s trade environment and constrain its trade development. An increase in trade facilitation levels lowers trade costs, which, through the trade multiplier effect, promotes economic growth in both cooperating parties.
represents the import tariff of the importing country. The tariff variable was introduced for two reasons: as a policy cost, tariffs can reflect the degree of trade liberalization; and by including both variables in the regression equation, the coefficients of the two explanatory variables can be used to compare their respective effects on trade.
indicates whether country j belongs to the Association of Southeast Asian Nations (ASEAN). Regional organizations with close ties to China can significantly promote bilateral trade between China and relevant countries. Regional economic integration organizations promote trade development by eliminating intra-regional tariff barriers and quantitative restrictions, establishing a unified tariff policy, facilitating the free flow of production factors, and coordinating economic policies to enhance regional economic growth.20 Given that China has signed and implemented multiple free trade agreements with RCEP member countries, to mitigate the “spaghetti bowl effect” caused by numerous free trade agreements in empirical analysis, this study selects regional integration organizations as the variable and excludes trade agreements.
5. The impact of trade facilitation among RCEP member countries on the return of Chinese aquatic product exports
Testing for multicollinearity among independent variables is a necessary step before regression analysis. The test results show that the variance inflation factor (VIF) of the independent variables ranges from a maximum of 3.42 to a minimum of 1.35, with an average of 2.30. Comparing this to the criterion of 0 < VIF < 10, it can be concluded that there is no severe multicollinearity among the independent variables, and the model’s estimation results are not significantly affected by the correlations among the independent variables.
To select the optimal effect model, an F-test was first conducted. The F-test result Prob > F = 0.0000 indicates that the fixed-effect model is more suitable for this study than the mixed-effect model. Subsequently, an LM test was performed. The LM test result Prob > chi2 = 0.0000 indicates that the random-effect model is superior to the mixed-effect model. Therefore, which model is more suitable: the fixed-effect model or the random-effect model? Finally, the Hausman test was used, with results showing Prob > chi2 = 0.9437, indicating that the random effects model is more appropriate. Therefore, the random effects model was ultimately selected for this study. As a control, mixed regression was also conducted in the paper.
(1) Basic regression analysis
A comparison of the results from mixed regression and random effects regression reveals that the signs and significance of the explanatory variables are largely consistent, indicating that the results of the random effects model are robust.
The models (1) to (3) in Tables 10 and 11 are the regression results obtained by successively adding variables such as trade facilitation, tariff rates, and whether the country is an ASEAN member to the basic trade gravity model. From the regression results (1), the regression effects are relatively ideal, and the explanatory variables generally meet expectations. Therefore, the simple form of the gravity model explains the determining equation of China’s aquatic product export trade. From the regression results, it can be seen that the explanatory variable achieves a very high level of significance and has the most significant coefficient, indicating that the GDP of the importing country is an essential factor influencing China’s exports to it; the coefficient of distance is negative and significant, indicating that distance is the main obstacle to China’s export trade. It is worth noting that the coefficient of is negative, meaning that the growth of China’s GDP has an inhibitory effect on China’s aquatic products exports, which is inconsistent with the conclusions of the majority of scholars. Typically, a country’s GDP reflects its export supply capacity. The larger the economic scale, the greater the potential export capacity, and consequently, the larger the bilateral trade volume. Possible reasons include the recent decline in China’s fishery resources, deterioration of aquatic ecological environments, and constraints imposed by water and land shortages, which have led to a stagnation in the total output of aquatic products. Additionally, as domestic residents’ incomes rise, the proportion of aquatic products in the national food consumption structure tends to increase, leading to higher demand for aquatic products. Expanding imports of aquatic products will therefore become an inevitable trend. Therefore, the sign of the coefficient aligns with the current status of aquatic product trade.19
From the perspective of trade facilitation as the core variable, its coefficient is positive and has a significant impact on China’s aquatic products exports. This indicates that an increase in trade facilitation levels among RCEP member countries has a significant positive promotional effect on China’s aquatic products exports, meaning that the higher the trade facilitation level, the larger China’s exports to RCEP member countries. Considering the results in column (3) as an example, after controlling for the effects of tariffs and dummy variables, the coefficient for trade facilitation not only increases but also remains robust. A 1% increase in the level of trade facilitation leads to a 3.470% increase in China’s exports of aquatic products to RCEP member countries.
Tariffs continue to pose obstacles to international trade. As tariff levels have generally decreased across countries and regional economic cooperation has deepened, the impact of tariffs on global trade has gradually diminished. However, they still exert some degree of obstruction. Tariff reduction is a goal of trade liberalization. As shown by the regression results of Model (3), while trade liberalization aimed at lowering tariff levels can promote the growth of bilateral trade volumes, its impact is far less significant than that of trade facilitation. Possible reasons include the fact that prior to the signing of the RCEP, China had already concluded free trade agreements with multiple RCEP member countries, resulting in relatively low tariff levels among them, leaving limited room for further tariff reductions. As a result, the trade benefits from tariff reductions under the RCEP agreement have diminished. However, trade facilitation measures can significantly reduce import and export clearance times, thereby effectively lowering the time costs of cross-border goods trade and promoting bilateral trade and economic growth.22 Taking the results in Column 3 of Table 11 as an example, for every 1% increase in tariff levels among RCEP member countries, trade flows decrease by only 0.070%.
Regional economic integration organizations can significantly promote trade development. Table 11 shows that the coefficient of ASEAN in Model (3) is 1.712 and is significant at the 10% level. This indicates that regional economic integration organizations can promote China’s exports.
(2) Expansive analysis
To gain a clearer understanding of the impact of different indicators of trade facilitation on international trade in aquatic products, this paper introduces four first-level indicators—infrastructure (T), customs environment (C), government regulation (R), and finance and e-commerce (F)—to replace the overall trade facilitation indicator in Model (3), resulting in Models (4)–(7). The regression results are presented in Tables 10 and 11. The primary indicators of the trade facilitation indicator system have a positive impact on China’s aquatic products exports to RCEP member countries, but the extent of their influence varies. Taking the random effects model results in Table 11 as an example, government regulation and financial and e-commerce have a greater and more significant promotional effect on China’s aquatic product exports to RCEP member countries compared to infrastructure and customs environment. Specifically, the influence of the four first-level indicators is ranked as follows: government regulation > financial and e-commerce > customs environment > infrastructure. This may be due to the unique characteristics of aquatic products, which are subject to stringent regulation across all stages of production, transportation, and trade. Therefore, trade policies and relevant regulations play a more critical role in their export trade. For instance, in the chapter on sanitary and phytosanitary measures, the RCEP builds upon the WTO/SPS framework, raising requirements in areas such as transparency and consultations on equivalence. In the long term, the optimization of the government regulatory environment plays a crucial role in enhancing a country’s trade facilitation level.23 Financial and e-commerce sectors provide a solid foundation for the smooth flow of funds in international trade and investment. E-commerce can to some extent overcome geographical barriers and promote logistics improvements. With the development of technology, the financial environment and e-commerce are expected to play a greater role in future international trade.
Given that product heterogeneity may be affected differently by trade facilitation, this study categorizes aquatic products into primary aquatic products and processed aquatic products and conducts separate regressions. Tables 12 and 13 present the results of the impact of trade facilitation on the exports of primary aquatic products and processed aquatic products, respectively. Comparison reveals that trade facilitation levels have a promotional effect on the exports of both product types, but the impact varies across products. As shown in Model (3) of Tables 12 and 13, compared to processed aquatic products, trade facilitation has a more significant promotional effect on the exports of primary aquatic products, with a trade facilitation impact coefficient as high as 11.879, which is statistically significant at the 1% level. The impact coefficient for processed aquatic products is 3.972. From the perspective of the four primary indicators, all have a significant promotional effect on the exports of primary aquatic products; however, for processed aquatic products, although all four sub-indicators have a positive promotional effect, only financial services and e-commerce have a significant impact. The primary reason lies in the distinct characteristics of different types of aquatic products. Primary aquatic products are difficult to store, especially aquatic animal products, which are highly perishable foods with high protein and moisture content, requiring stringent conditions during transportation. Compared to processed aquatic products, primary aquatic products are more susceptible to the efficiency of port operations and customs environments.
(3) Soundness test
The trade facilitation levels mentioned earlier were obtained using principal component analysis. To test the stability of the model and regression results, this section employs the simple arithmetic average method to calculate trade facilitation values for robustness testing. In addition to conducting robustness testing on the overall results, separate robustness tests were performed for different types of aquatic products. The regression results are detailed in Table 14. The direction and significance level of the explanatory variables are consistent with those in the preceding section, indicating that the empirical test results are robust.
6. Simulated analysis of the trade potential of RCEP member countries
Numerous factors influence the development of a country’s or region’s export trade. In addition to the level of trade facilitation in trading partner countries, the trade potential of these countries is also a crucial aspect. The preceding section has analyzed the impact of trade facilitation levels on China’s aquatic products export trade. To further examine the priority order of future export markets for China’s aquatic products, it is necessary to simulate the trade potential of RCEP member countries and calculate their trade potential coefficients. The process is divided into three steps: first, the trade facilitation levels of RCEP member countries are raised to the highest level in the region; second, the average values of the explanatory variables for different countries are substituted into the extended gravity model constructed earlier to obtain simulated trade values; third, the trade potential coefficients are calculated as the ratio of actual trade values to simulated trade values. The detailed results are presented in Table 15.
Based on the size of the trade potential coefficient, countries can be categorized into three types: countries with huge potential, those with Potential development, and those with Potential reshaping. Specifically, when the trade potential coefficient is less than 0.8, it indicates that there is significant room for growth in bilateral trade, and the country falls into the category of having enormous potential. China can significantly increase its exports of aquatic products by focusing on the existing factors influencing the gravity model, such as Australia and Indonesia. When the trade potential coefficient is between 0.8 and 1.2, it indicates that there is still room for growth in bilateral trade, and the country falls into the category of potential development. China can further expand its exports of aquatic products by fully leveraging the factors within the gravity model. China can further expand its aquatic products exports to countries such as Malaysia and Thailand. When the trade potential coefficient exceeds 1.2, it falls under the category of potential reshaping, and China needs to identify new factors beyond the gravity model to enhance its exports of aquatic products, such as those to New Zealand. Overall, China’s aquatic products trade with RCEP member countries still holds significant development potential.24,25
7. Conclusions and Policy Recommendations
As a large regional free trade agreement that unifies high quality and inclusiveness, the RCEP aims to establish mutually beneficial systems that are more suited to the development conditions of each member country26 and promote the liberalization and facilitation of trade and investment in the Asia-Pacific region. Based on an analysis of China’s current exports of aquatic products to other RCEP member countries and a calculation of the level of trade facilitation, this paper conducts an empirical analysis of the impact of trade facilitation on China’s exports of aquatic products. The specific conclusions are as follows:
First, the average trade facilitation index for RCEP member countries is 0.6448, indicating a general level of trade facilitation. This suggests that there is significant room for improvement in the overall trade facilitation level and trade conditions within the RCEP region.
Second, trade facilitation has a significant promotional effect on China’s exports of aquatic products to RCEP member countries. Different primary indicators of trade facilitation have varying promotional impact on the trade of aquatic products, and different types of aquatic products are also influenced differently by various trade facilitation indicators. Additionally, the promotional effect of trade facilitation on inter-country trade flows is significantly greater than factors such as the GDP of importing and exporting countries, geographical distance, and tariff reductions. This also fully confirms that trade facilitation has become a major factor influencing contemporary international trade.
Third, from the perspective of China’s aquatic product exports, RCEP member countries still have enormous untapped market potential, and further improving trade facilitation levels will continue to bring substantial trade volumes to both trading parties. Due to differences in factors such as the level of economic development and tariff levels among different countries, the untapped trade potential and expansion space vary.
The full implementation of RCEP will enable China to coordinate and cooperate with other RCEP members, promote mutual exchange and cooperation, facilitate cooperation in the aquaculture industry, further develop China’s aquatic product trade, and enhance the resilience of China’s aquatic product industry chain.
First, further enhance trade facilitation. Overall, trade facilitation levels among RCEP member countries are not high. In the initial phase following the entry into force of the RCEP Agreement, efforts should be sustained to implement the trade facilitation provisions of the RCEP. Accelerate the development of a “four-in-one” interconnected network integrating land, sea, air, and digital infrastructure, and strengthen infrastructure construction; advance customs modernization reforms to improve customs clearance efficiency; deepen administrative system reforms to optimize the regulatory environment; promote financial cooperation and currency circulation to enhance the availability and convenience of financial services; and foster the development of e-commerce and build cross-border e-commerce cooperation.
Second, effectively expand the space for aquatic product trade. The RCEP has established economic and trade relations among major economic powers in East Asia, achieving the first-ever inclusion of China, Japan, and South Korea within the same free trade agreement through a “roundabout” approach, which is conducive to enhancing trade facilitation among the three countries and further expanding the space for aquatic product trade27; we should improve investment and trade policies, fully leverage China’s advantages such as its comprehensive industrial sectors, and strengthen connectivity and cooperation in infrastructure development and construction with countries like Indonesia, the Philippines, Cambodia, Vietnam, and strengthen connectivity and collaboration in infrastructure development and construction. This will promote cross-border cooperation in transportation infrastructure within the region, facilitate trade market diversification, and effectively tap into untapped trade potential. Additionally, in accordance with RCEP regulations, we should continue to expand the openness of foreign trade, seize the opportunities presented by RCEP tariff reductions and trade facilitation, enhance the efficiency of complementary water product resources, and steadily improve the functions of trade platforms such as science and technology innovation and public services to expand trade scale with RCEP member countries.
Third, continue to promote the high-quality development of aquatic products and the trade in aquatic products. First, improve the quality of aquatic products. In recent years, Chinese aquatic products have encountered technical trade barriers in major export markets. To promote high-quality development of aquatic product trade, the key is to improve the quality of domestic aquatic products and strengthen aquatic product quality management. Second, promote high-quality development of aquatic product trade by optimizing the trade structure, enhancing trade efficiency, and strengthening trade competitiveness. Relevant enterprises should fully tap into the potential of the RCEP rules, coordinate the layout of the industrial chain, monitor the trends of technical trade measures in RCEP member countries, strengthen analysis of preferential policies under the RCEP rules, accelerate the cultivation of new business models and formats in aquatic product trade, align with international standards to fully enjoy the institutional advantages brought by the RCEP, and effectively enhance the benefits of RCEP trade.
Acknowledgements
This paper is supported by the Later Stage Funding Project of the National Social Science Fund of China, “Research on China’s Foreign Trade Patterns and Transformation/Upgrading from the Perspective of Value-Added Trade Network Relationships” (No. 18FJY022); and the Major Research Special Project of the National Social Science Fund of China (No. 22VHQ006).
Authors’ contributions
Conceptualization: Chunxiang Hou (Lead). Writing – original draft: Chunxiang Hou (Equal), Zhe Chen (Equal). Data curation: Chunxiang Hou (Equal), Zhe Chen (Equal). Formal Analysis: Chunxiang Hou (Equal), Zhe Chen (Equal). Methodology: Zefang Liao (Lead). Writing – review & editing: Zefang Liao (Lead).
Declaration of Interest statement
The authors declare that they have no known competing financial interests or personal relationships that could have appeared to influence the work reported in this paper.
Declaration of generative AI in scientific writing
This paper does not involve the use of generative AI in scientific writing.
Data availability
Data will be made available on request.