


1. INTRODUCTION
Chinese mitten crab (Eriocheir sinensis) is an economically important crab species endemic to China. Renowned for its tender meat, delicious flavor, and rich nutritional value, it has become a widely consumed traditional aquatic product in China. Its annual output reached 782,200 metric tons in 2023,1 underscoring its considerable prospects as a freshwater aquacuture species. The continuous expansion of farming scale and the increase in production have driven the development and application of high-efficiency formulated feeds. However, fishmeal, as a conventional protein source in the diet of E. sinensis, faces sustainability and cost-related challenges.2 Therefore, it is imperative to seek high-quality alternatives to fishmeal.
In recent years, with the continuous development and utilization of insect resources, the low cost of insect protein, coupled with its rich nutritional composition, including proteins, vitamins, and minerals, has rendered the replacement of fishmeal with insect protein a viable strategy. High-quality insect protein sources include black soldier fly (Hermetia illucens), housefly (Musca domestica), and yellow mealworm (Tenebrio molitor). Studies have reported their inclusion in feeds for various aquatic species, including gilthead sea bream (Sparus aurata L. 1758),3 rainbow trout (Oncorhynchus mykiss L.),4 and Pacific white shrimp (Litopenaeus vannamei).5 These studies suggest that insect protein can partially replace fishmeal without negatively impacting the growth performance of the cultured species.
However, numerous studies have also reported that excessively high inclusion levels of insect protein as a fishmeal replacement lead to reduced growth performance in aquatic animals.6,7 Similar findings were observed in previous research by our group, where defatted black soldier fly meal and yellow mealworm meal could replace up to 50% and 75% of fishmeal in the diet of E. sinensis, respectively, while higher substitution levels resulted in significantly impaired growth performance.8,9 The decline in growth performance and digestibility associated with high dietary insect protein is often attributed by many researchers to the presence of chitin.6,7 This hypothesis has been further supported by a single-gradient chitin supplementation trial conducted by our research group (manuscript in preparation).
Chitin is one of the most widespread complex polysaccharides in nature after cellulose. It is composed of N-acetylglucosamine (GlcNAc) linked by β-1,4-glycosidic bonds and is widely distributed in the exoskeletons of insects10 and aquatic crustaceans.11 Chitinases are a class of glycoside hydrolases that catalyze the degradation of chitin by hydrolyzing the β-1,4-glycosidic linkages in chitin polymers or oligomers.12 To date, chitinase genes have been found to be highly expressed in the hepatopancreas of various crustaceans, including E. sinensis.12 As a typical crustacean, E. sinensis exhibits cannibalistic behavior and consumes its own exuviae. The chitinase it secretes can break down the ingested chitin, which helps meet its demands for energy and rapid cuticle regeneration,13 thereby promoting growth in aquatic animals.14 However, excessively high levels of dietary chitin cannot be efficiently digested and absorbed by crustaceans, which may be attributed to insufficient endogenous chitinase activity. As chitin content in the diet increases, the chitinase levels in the crab may become inadequate to hydrolyze the elevated chitin intake. The excess chitin can bind to amino acids, forming indigestible complexes that interfere with the digestion and absorption of other nutrients.
At present, there are numerous studies on the effects of chitinase in other crustaceans.15–17 However, research on the application of chitinase in high-chitin diets for E. sinensis has not yet been reported. In this study, a feeding trial was conducted to investigate the effects of chitinase supplementation on growth, nutritional status, and intestinal ecology of E. sinensis fed a high-chitin diet. The experiment combined 16S rRNA sequencing of intestinal microbiota with analyses of growth, nutritional, and biochemical parameters. The results aim to elucidate how chitinase influences growth performance, nutrient utilization, and gut microbial homeostasis under high dietary chitin conditions, thereby providing a scientific basis for the further application of insect protein in formulated feeds for E. sinensis.
2. MATERIALS AND METHODS
2.1. EXPERIMENTAL DESIGN
A control diet was designed with a fish meal content of 20% and a chitin content of 2.8%. The chitin supplementation level was set at 28 g/kg, which was calculated based on the highest inclusion rate of yellow mealworm powder and its maximum chitin content reported in our previous study,9 in order to simulate the maximum dietary chitin load potentially associated with this substitution level. Chitinase was added to the control diet at levels of 0.5%, 1.0%, 1.5%, and 2.0% respectively to prepare five groups of isonitrogenous and isolipidic diets, abbreviated as D1, D2, D3, D4, and D5. The supplementation level of chitinase referred to the study of Zhang et al.17 The chitin used in the experiment was purchased from Shanghai Macklin Biochemical Co., Ltd., and it was derived from crab shells. The chitinase was purchased from Shanghai Quanwang Co., Ltd., sourced from Streptomyces griseus, with a molecular weight of 30kDa and an activity of 502.45U/g.
The main feed ingredients were crushed and passed through a 60-mesh sieve, then mixed evenly according to the feed formula (Table 1). After adding oil and distilled water, the mixture was made into sinking pellet feeds with a diameter of 2 mm using a single-screw extruder (SLP-22#, Xinfeng Haojian Machinery Factory, Dantu District). The pelleting temperature was 85 ± 5℃. The feeds were then post-cooked in an oven at 95℃ for 30 minutes, dehumidified, air-dried and stored in sealed containers at room temperature for later use.
2.2. EXPERIMENTAL CRABS AND FEEDING MANAGEMENT
Juvenile E. sinensis were obtained from Jiangsu Haorun Biological Industry Group Co., Ltd. Feeding was stopped 24 hours before the feeding experiment. A total of 400 healthy juvenile crabs with intact appendages, good vitality, in the intermolt stage, and with an initial body weight of (1.55 ± 0.10) g were selected for the feeding experiment. These 400 crabs were randomly assigned to a recirculating aquaculture system consisting of 20 polyvinyl chloride (PVC) tanks (1.0 m×1.0 m×0.5 m), with 20 crabs per tank. The experiment was divided into 5 groups, with 4 replicates in each group (n=4). During the breeding period, the daily feeding amount was 1%-3% of the crabs’ body weight, fed twice a day (at 7:00 and 17:00). The specific feeding amount was adjusted timely according to the crabs’ feeding status and weather conditions to ensure that the feeding amount in each replicate was basically consistent and that the feed was consumed entirely within 4 hours after feeding. Continuous aeration was provided day and night. Feces at the bottom of the tanks were removed by siphoning once a day, and the system water was replenished immediately after siphoning. The water used was precipitated river water. During the experiment, the water temperature ranged from 23℃ to 28℃, salinity from 0.5‰ to 1.0‰, dissolved oxygen was ≥ 5.6 mg·L⁻¹, pH value was 7.0 to 8.5, ammonia nitrogen was ≤ 0.2 mg·L⁻¹, and nitrite was ≤ 0.05 mg·L⁻¹. The feeding trial lasted for 56 days.
2.3. SAMPLING
At the end of the breeding experiment, all juvenile crabs from each tank were collected, blotted dry on absorbent paper, and weighed using an electronic balance with an accuracy of ±0.01 g. The crabs were anesthetized in ice water, and 4 crabs were randomly selected from each replicate. Approximately 0.5 mL of hemolymph was drawn from the base of the 3rd pereiopod using a 1.0 mL sterile syringe and transferred into a 1.5 mL centrifuge tube pre-added with 0.5 mL of anticoagulant (the formula is sodium citrate 13.2 g/L, citric acid 4.8 g/L, glucose 14.7 g/L). The mixture was then centrifuged at 12,000 r/min and 4℃ for 20 minutes, and the supernatant was stored in a -80℃ refrigerator for later use. After hemolymph collection, the crab shell was separated from the body along the side of the shell, and the hepatopancreas (HP) was dissected out, accurately weighed, and then placed into 2 mL centrifuge tubes respectively for the determination of digestive enzyme activity. The intestinal and HP of the above 4 juvenile crabs were separately placed into 5 mL centrifuge tubes pre-filled with 3 mL of Bouin’s fixative, for the preparation of intestinal tissue sections. Additionally, 2 juvenile crabs were selected from each replicate, whose body surfaces were sterilized by wiping with 75% alcohol. Under sterile conditions, their intestines were collected into 1.0 mL centrifuge tubes for the analysis of intestinal microbial study.
2.4. MEASUREMENT INDICATORS AND METHODS
2.4.1. GROWTH PERFORMANCE
Three juvenile crabs were randomly selected from each cage, their body surface moisture was blotted dry, and they were stored in a -20°C refrigerator for whole-crab body composition analysis. The growth performance indicators include survival rate (SR), weight gain rate (WG), feed conversion ratio (FCR), hepatosomatic index (HSI), and feed intake (FI):
SR (%) = 100 × (final crab number / initial crab number).
WG (%) = 100 × (final weight (g) - initial weight (g)) / initial weight (g).
FCR = total feed intake (g) / (final weight (g) - initial weight (g))
FI = total feed intake (g) / ((final number + initial number) / 2)
HSI (%) = 100 × hepatopancreas weight (g) / final body weight (g)
MI is the interval between the date of second molt and the date of first molt (d).
2.4.2. FEED AND WHOLE-CRAB COMPOSITION
Routine analyses of whole-crab and feed samples were performed in accordance with the international standard methods.18 Moisture content was determined by drying the samples in an oven at 105°C to a constant weight. Crude protein content was measured using an automatic Kjeldahl nitrogen analyzer (2300-Auto-analyzer, Foss Tecator, Sweden). Crude lipid content was assayed by the chloroform-methanol method. Crude ash content was determined after incineration in a muffle furnace at 550°C for 12 hours.
2.4.3. SERUM BIOCHEMICAL INDICATORS
In an acidic or alkaline environment, acid phosphatase (ACP) or alkaline phosphatase (AKP) catalyzes the hydrolysis of disodium p-nitrophenyl phosphate to generate 4-nitrophenol, which has a characteristic light absorption at 405 nm. The activity of ACP or AKP was calculated by measuring the rate of increase in absorbance at 405nm.
In a bacterial suspension with a certain concentration, lysozyme can hydrolyze the peptidoglycan on the bacterial cell wall, leading to bacterial lysis, a decrease in concentration, and an increase in light transmittance. Therefore, the content of lysozyme can be inferred based on the change in light transmittance.
Superoxide anions (O₂⁻) are generated through the reaction system of xanthine and xanthine oxidase. O₂⁻ can react with WST-8 to produce water-soluble formazan dye, which has an absorption at 450nm. Superoxide dismutase (SOD) can scavenge O₂⁻, thereby inhibiting the formation of formazan. The darker the yellow color of the reaction solution, the lower the SOD activity, and vice versa. Hydrogen peroxide (H₂O₂) has a characteristic absorption peak at 240 nm.
Catalase (CAT) can decompose H₂O₂, causing the absorbance of the reaction solution at 240nm to decrease over reaction time. The CAT activity was calculated based on the rate of change in absorbance. In an acidic environment, the total antioxidant capacity is reflected by the ability of antioxidant substances to reduce Fe³⁺-tripyridyltriazine (Fe³⁺-TPTZ) to form blue Fe²⁺-TPTZ.
Glutathione peroxidase (GSH-Px) catalyzes the oxidation of glutathione (GSH) by organic peroxides to generate oxidized glutathione (GSSG). Glutathione reductase (GR) catalyzes the reduction of GSSG by nicotinamide adenine dinucleotide phosphate (NADPH) to regenerate GSH, with the simultaneous oxidation of NADPH to nicotinamide adenine dinucleotide phosphate (NADP⁺). NADPH has a characteristic absorption peak at 340 nm, while NADP⁺ does not. The activity of GSH-Px was calculated by measuring the rate of decrease in light absorption at 340nm.
Malondialdehyde (MDA) condenses with thiobarbituric acid (TBA) to form a red product, which has a maximum absorption peak at 532nm. The content of lipid peroxides in the sample can be estimated after colorimetry. Meanwhile, the absorbance at 600nm is measured, and the MDA content is calculated using the difference between the absorbances at 532 nm and 600 nm.
2.4.4. DIGESTIVE ENZYME ACTIVITY
HP samples were thawed at 4℃, homogenized, and centrifuged at 3000 r·min⁻¹ for 15 min, and the supernatant was collected to determine digestive enzyme activities. The activity of protease was measured by the Folin-phenol method. The definition of protease unit (U·g⁻¹ prot): with 2% casein as the substrate, the amount of enzyme that decomposes casein to produce 1 µg tyrosine per microgram of tissue protein per minute under the conditions of 37℃ and pH 7.2. The definition of lipase unit (U·g⁻¹ prot): under the condition of 37℃, each gram of tissue protein reacts with the substrate for 1 min, and the consumption of 1 µmol substrate is defined as one enzyme activity unit. The definition of amylase unit (U·g⁻¹ prot): each milligram of protein in the tissue acts on the substrate at 37℃ for 30 min, and the hydrolysis of 10 mg starch is defined as one amylase activity unit. The protein concentration of the enzyme solution was determined by the Coomassie brilliant blue method. The determinations of protease, lipase, and enzyme solution protein concentration were all carried out according to the instructions of the kit (Nanjing Jiancheng Bioengineering Institute, Nanjing, Jiangsu).
2.4.5. INTESTINE AND HP HISTOLOGY
For section preparation, the intestinal and HP were subjected to ethanol dehydration, xylene clearing, and paraffin embedding. Sections (with a thickness of 5μm) were prepared using a Leikn RM2235 microtome (Germany), followed by HE staining and mounting to make permanent sections. The morphological characteristics of intestinal folds were observed and photographed under a light microscope (Nikon YS100 microphotography system). A micrometer was used to measure the height and width of intestinal epithelial folds, and the number of folds was counted (the total number of folds in the cross-section of the entire intestinal was counted).
2.4.6. INTESTINAL MICROBIAL STUDY
The sequencing experiment was entrusted to Shanghai Majorbio Bio-pharm Technology Co., Ltd. (China) for next-generation sequencing (NGS) library preparation and Illumina Miseq sequencing. The specific method is as follows:
Total microbial genomic DNA was extracted from the intestine using the FastPure Stool DNA Isolation Kit (MJYH, Shanghai, China) according to the manufacturer’s instructions. The quality and concentration of DNA were determined by 1.0% agarose gel electrophoresis and a NanoDrop® ND-2000 spectrophotometer (Thermo Scientific Inc., USA) and kept at -80 ℃ prior for further use. The hypervariable region V3-V4 of the bacterial 16S rRNA gene were amplified with primer pairs 338F (5’-ACTCCTACGGGAGGCAGCAG-3’) and 806R(5’-GGACTACHVGGGTWTCTAAT-3’) by an T100 Thermal Cycler (BIO-RAD, USA). The PCR reaction mixture including 4 μL 5 × Fast Pfu buffer, 2 μL 2.5 mM dNTPs, 0.8 μL each primer (5 μM), 0.4 μL Fast Pfu polymerase, 10 ng of template DNA, and ddH2O to a final volume of 20 µL. PCR amplification cycling conditions were as follows: initial denaturation at 95 ℃ for 3 min, followed by 27 cycles of denaturing at 95 ℃ for 30 s, annealing at 55 ℃ for 30 s and extension at 72 ℃for 45 s, and single extension at 72 ℃ for 10 min, and end at 4 ℃. All samples were amplified in triplicate. The PCR product was extracted from 2% agarose gel and purified. Then quantified using Synergy HTX (Biotek, USA).
Purified amplicons were pooled in equimolar amounts and paired-end sequenced on an Illumina NextSeq 2000 PE300 platform (Illumina, San Diego,USA) according to the standard protocols by Majorbio Bio-Pharm Technology Co. Ltd. (Shanghai, China). After demultiplexing, the resulting sequences were quality filtered with fastp (v0.19.6) and merged with FLASH (v1.2.11). Then the high-quality sequences were denoised using DADA2 plugin in the Qiime2 (version 2020.2) pipeline with recommended parameters, which obtains single nucleotide resolution based on error profiles within samples. Taxonomic assignment of ASVs was performed using the Naive bayes consensus taxonomy classifier implemented in Qiime2 and the SILVA 16S rRNA database (v138.2). Bioinformatic analysis of the gut microbiota was carried out using the Majorbio Cloud platform (https://cloud.majorbio.com).
2.5. STATISTICAL ANALYSIS
For statistical analysis, the tank was considered the experimental unit (n=4). All data were checked for normality (Shapiro-Wilk test) and homogeneity of variance (Levene’s test). The experimental data, which met the assumptions for parametric tests, were presented as mean ± standard deviation and analyzed using one-way analysis of variance (ANOVA) followed by Tukey’s multiple range test in SPSS 22.0. Statistical significance was determined at P < 0.05.
3. RESULTS
3.1. GROWTH PERFORMANCE
As shown in Table 2, the FBW, WG, survival, HSI and MI of E. sinensis in each group were significantly linearly and positively correlated with the dietary chitinase level (P < 0.05), while the FCR was linearly and negatively correlated with the dietary chitinase level (P < 0.05). The FBW, WG and HSI of groups D4 and D5 were significantly higher than those of group D1, and the FCR was significantly lower than that of group D1 (P < 0.05). The survival of groups D3, D4, and D5 was significantly higher than that of group D1 (P < 0.05). The MI of group D5 was significantly shorter than that of group D1 (P < 0.05). There was no significant difference in FI among groups (P > 0.05).
3.2. BODY COMPOSITION
As shown in Table 3, dietary chitinase content has a significant linear positive correlation with the crab crude protein content, and a significant linear negative correlation with the crab moisture content (P < 0.05). The crab moisture content in groups D4 and D5 was significantly lower than that in group D1, while the crab crude protein content was significantly higher than that in group D1 (P < 0.05). There was no significant difference in the crab crude fat and ash contents among all groups (P > 0.05).
3.3. Hepatopancreas (HP) DIGESTIVE ENZYMES
As shown in Table 4, the activities of HP protease and lipase were significantly linearly and positively correlated with the dietary chitinase level (P < 0.05). The activities of HP protease and lipase in groups D4 and D5 were significantly higher than those in group D1 (P < 0.05). There was no significant difference in the HP amylase activity among all groups (P > 0.05).
3.4. SERUM BIOCHEMICAL INDICATORS
As shown in Table 5, the activities of serum ACP, LZM, ALP, T-SOD, GSH-Px, T-AOC and CAT in E. sinensis were significantly linearly and positively correlated with the dietary chitinase level, and the MDA content was significantly linearly and negatively correlated with the dietary chitinase level (P < 0.05). The activities of serum ACP, LZM, ALP, T-SOD, GSH-Px and T-AOC in groups D4 and D5 were significantly higher than those in group D1, and the MDA content was significantly lower than that in group D1 (P < 0.05).
3.5. INTESTINE AND HP HISTOLOGY
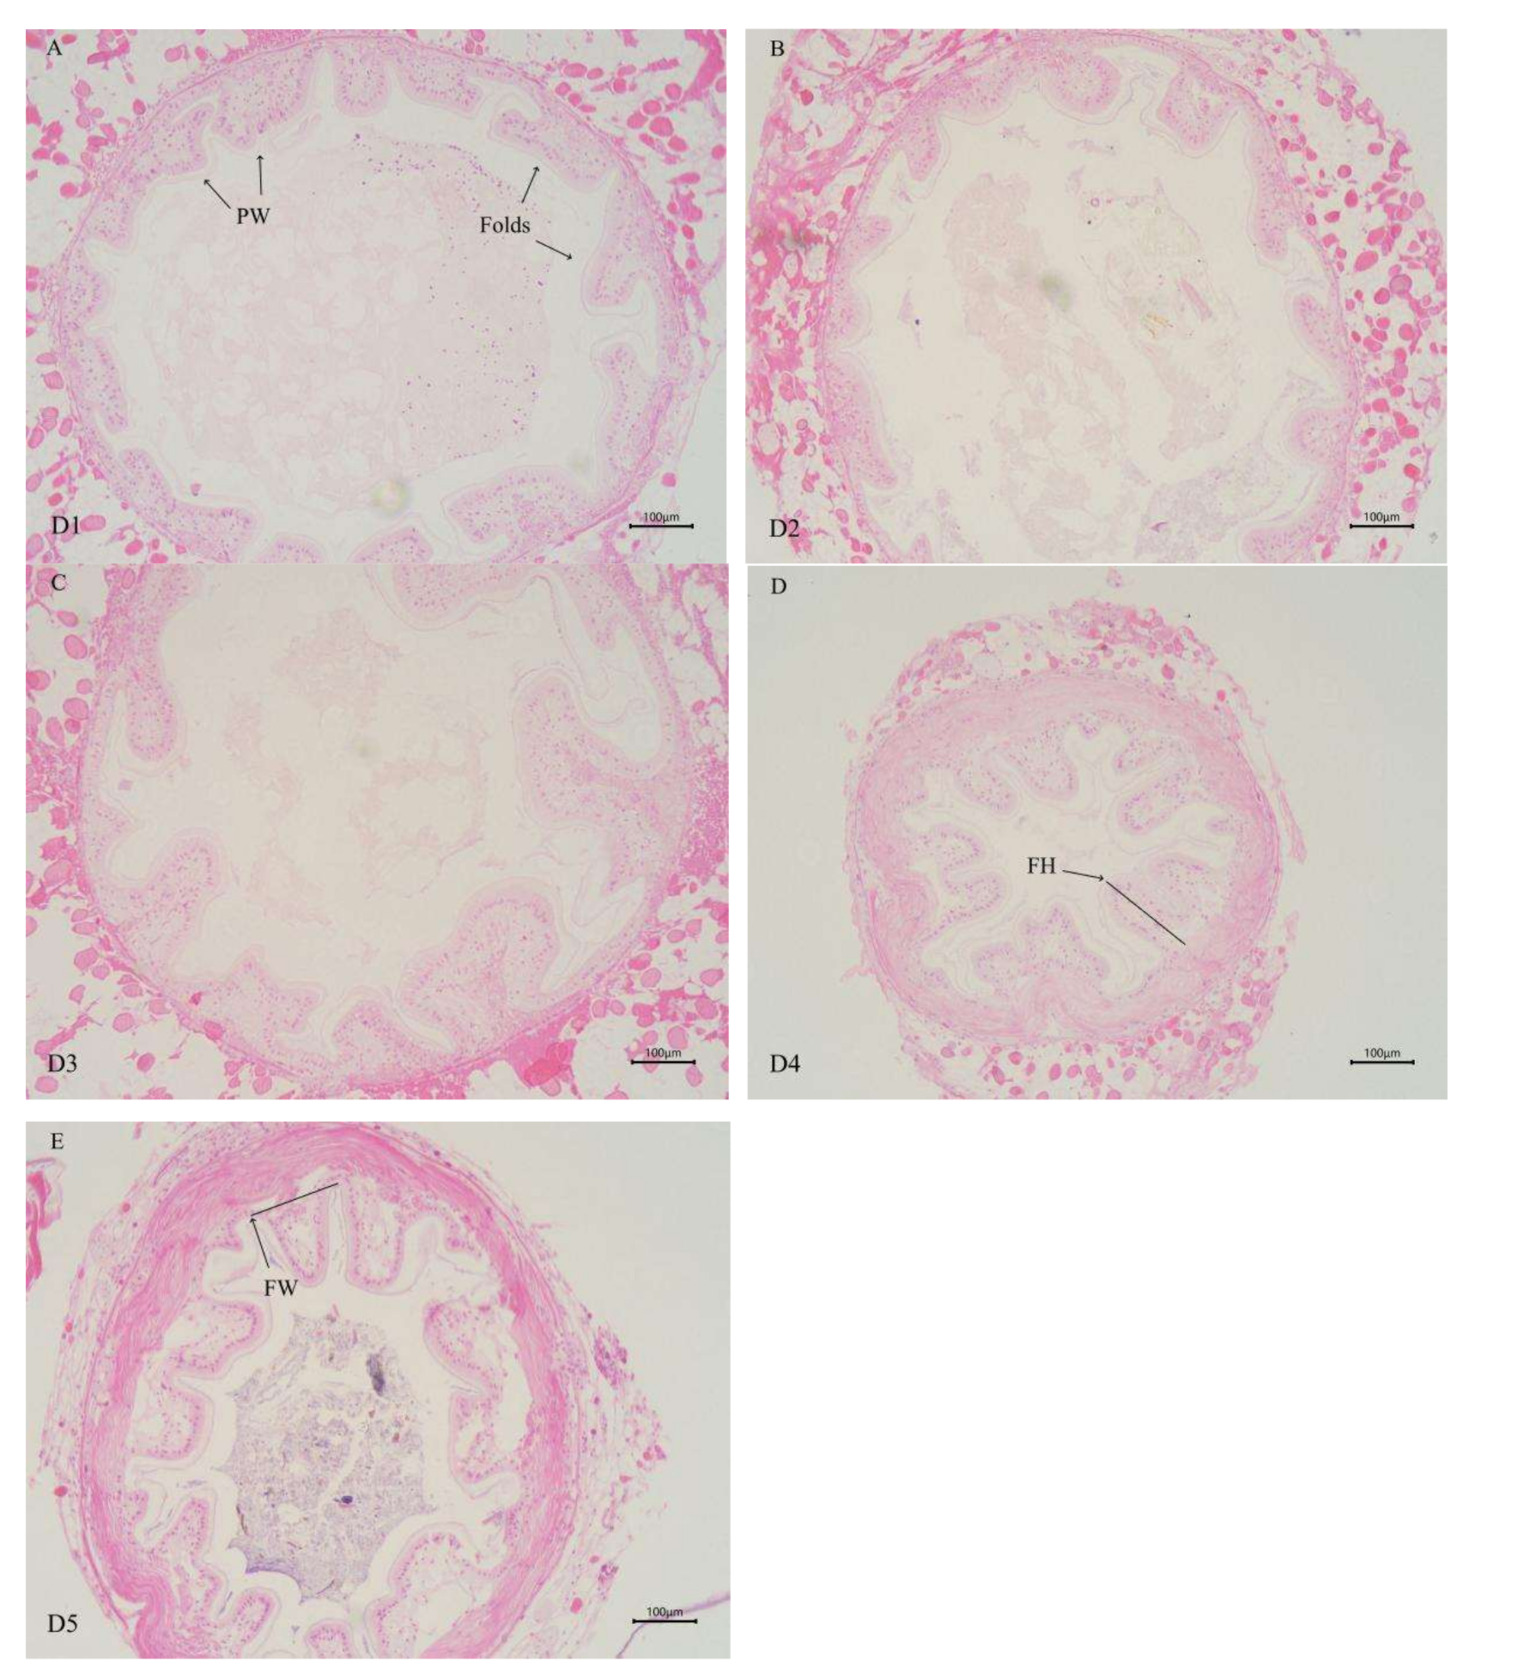
As shown in Table 6 (and Figure 1), the height of intestinal folds in E. sinensis was linearly influenced by the supplementation level of dietary chitinase (P < 0.05). The fold heights in the group of D3, D4, and D5 were significantly higher than those in D1 and D2 groups (P < 0.05), with the highest value observed in D5 group. No significant differences were observed in the number and the width of intestinal folds among all groups (P > 0.05).

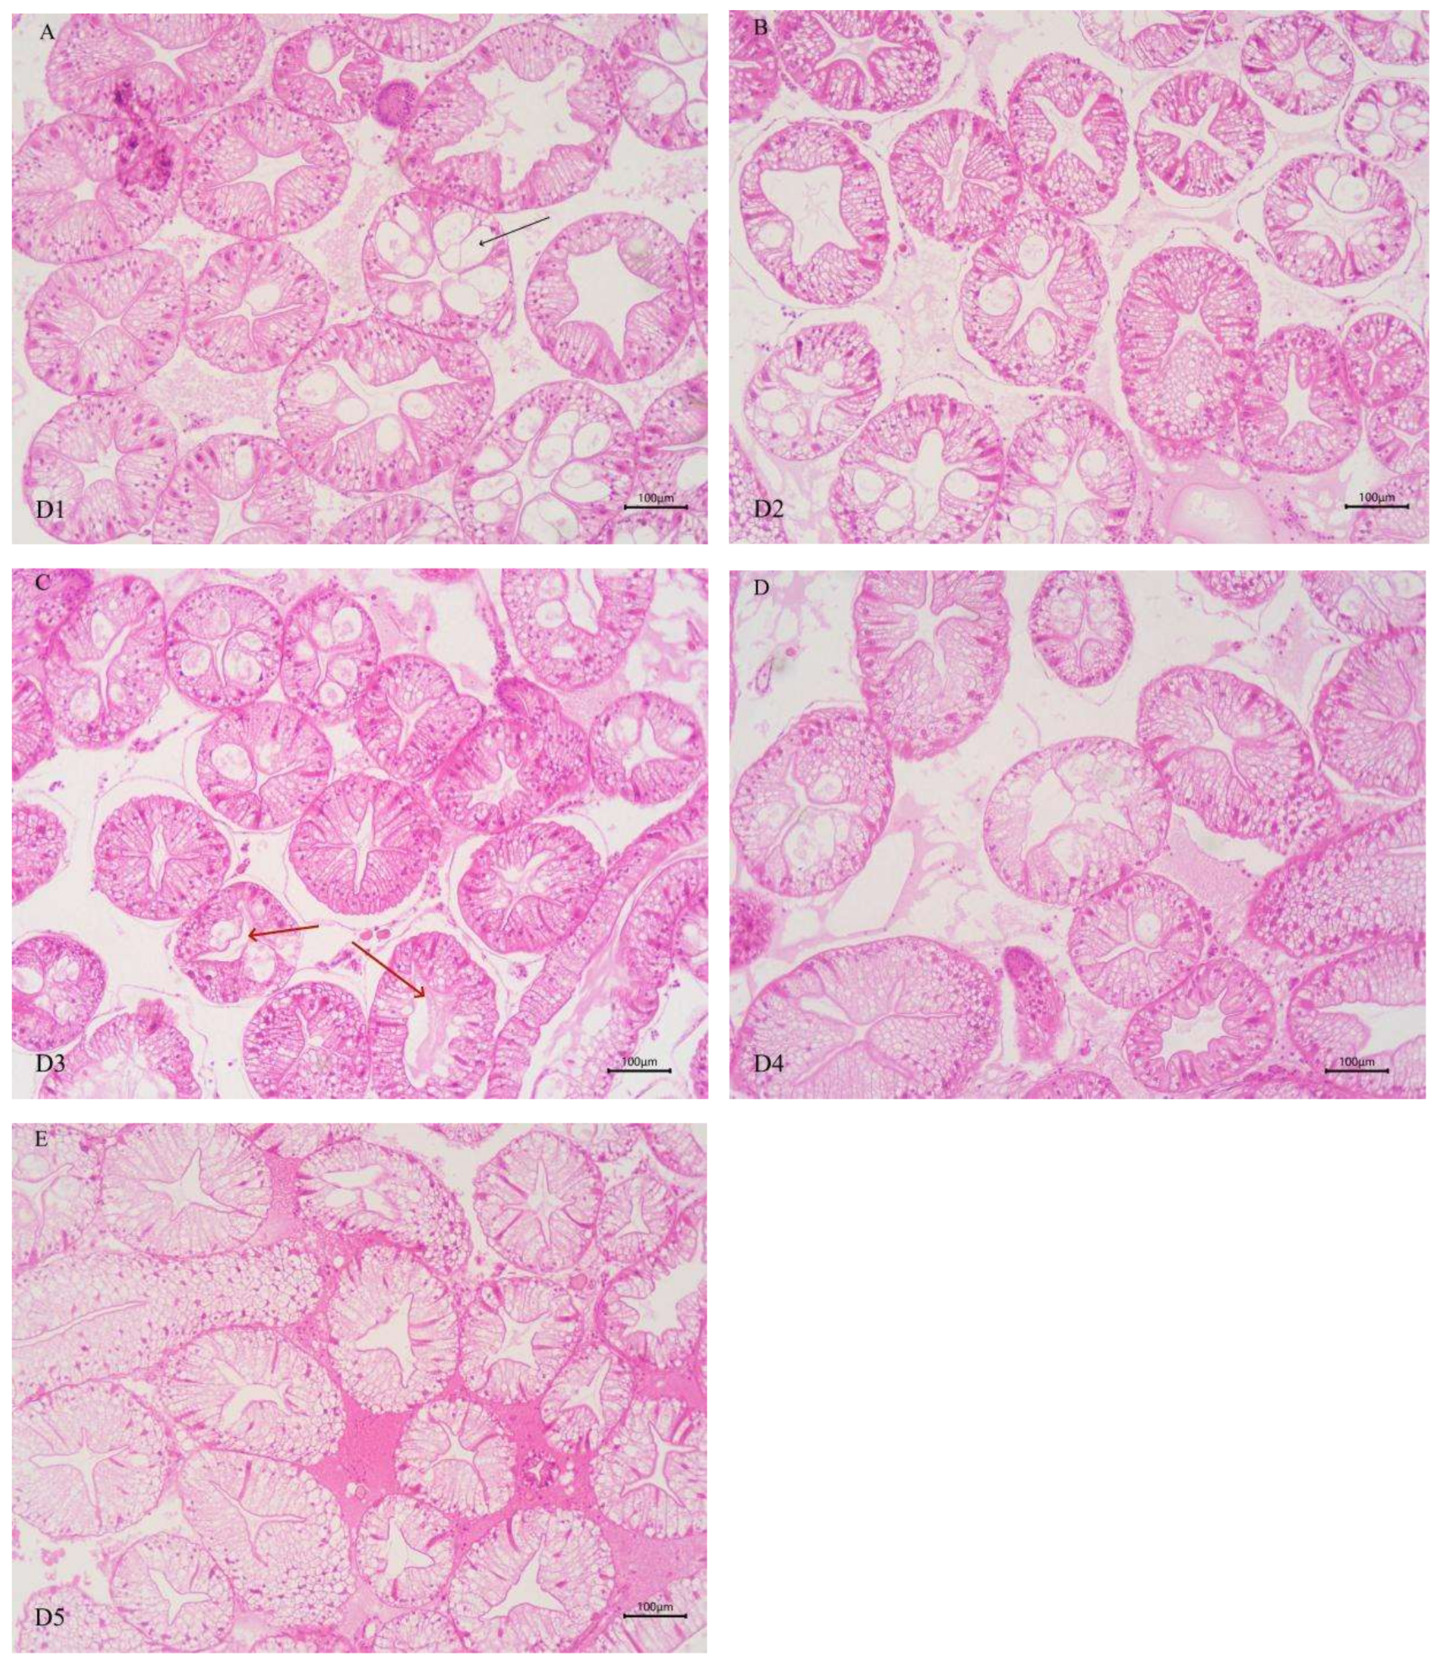
As shown in Figure 2, the morphology of some hepatopancreatic tubules of E. sinensis in groups D1 and D2 was altered, with slightly disordered cell arrangement and cytoplasmic vacuolization of hepatopancreatic tubular epithelial cells. With increasing chitinase supplementation, the degree of cytoplasmic vacuolization of hepatopancreatic tubular epithelial cells was alleviated. In groups D4 and D5, the epithelial cells between hepatopancreatic tubules were tightly connected, and the hepatopancreatic tubules presented a stellate polygonal structure with clear morphology, moderate lumen size and epithelial thickness.
.png)
3.6. INTESTINAL MICROBIOTA
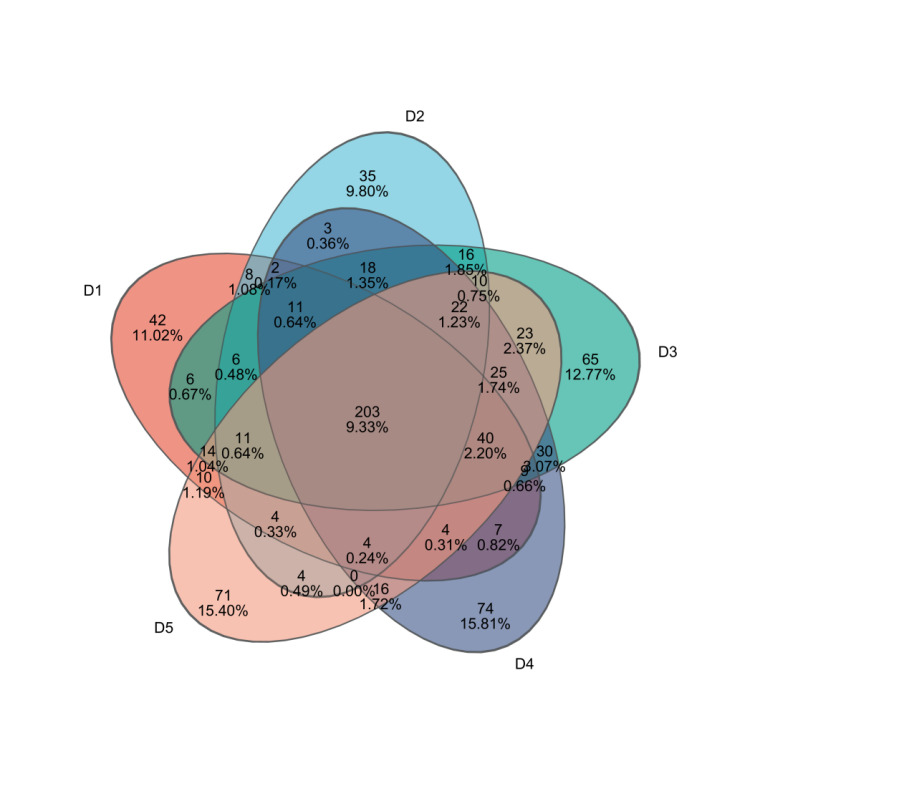
Through 16S rRNA sequencing, a total of 1,432,244 valid sequences were obtained, with 606,087,115 bp in length and an average sequence length of 423 bp. After clustering analysis of the obtained sequences, the five groups yielded 363, 349, 509, 403, and 445 representative OTUs (Operational Taxonomic Units) of microbial communities, respectively. The shared OTUs among the five treatment groups were 203, while the unique OTUs in each group were 42, 35, 65, 74, and 71, respectively (Figure 3).
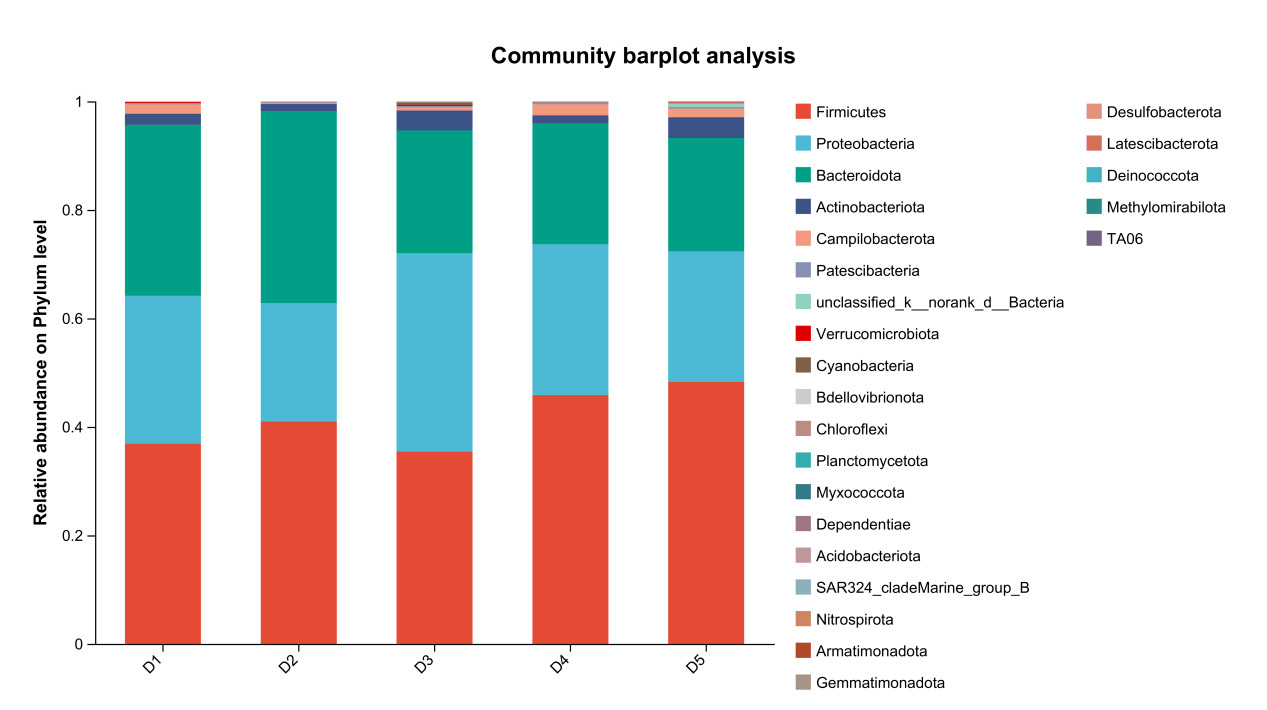
The results of species composition analysis showed that the dominant intestinal microbiota of E. sinensis in all treatment groups were Firmicutes, Proteobacteria, Bacteroidota, and Actinobacteriota. These four phyla accounted for 92.71%, 99.54%, 98.32%, 97.42%, and 97.07% of the intestinal microbiota in E. sinensis across the five groups, respectively. The remaining major phyla included Patescibacteria, Fusobacteriota, and Verrucomicrobiota, etc (Figure 4). There was no significant difference in the composition and abundance of microbiota among the treatment groups (P > 0.05) (as there was no difference, no bar plot was generated).
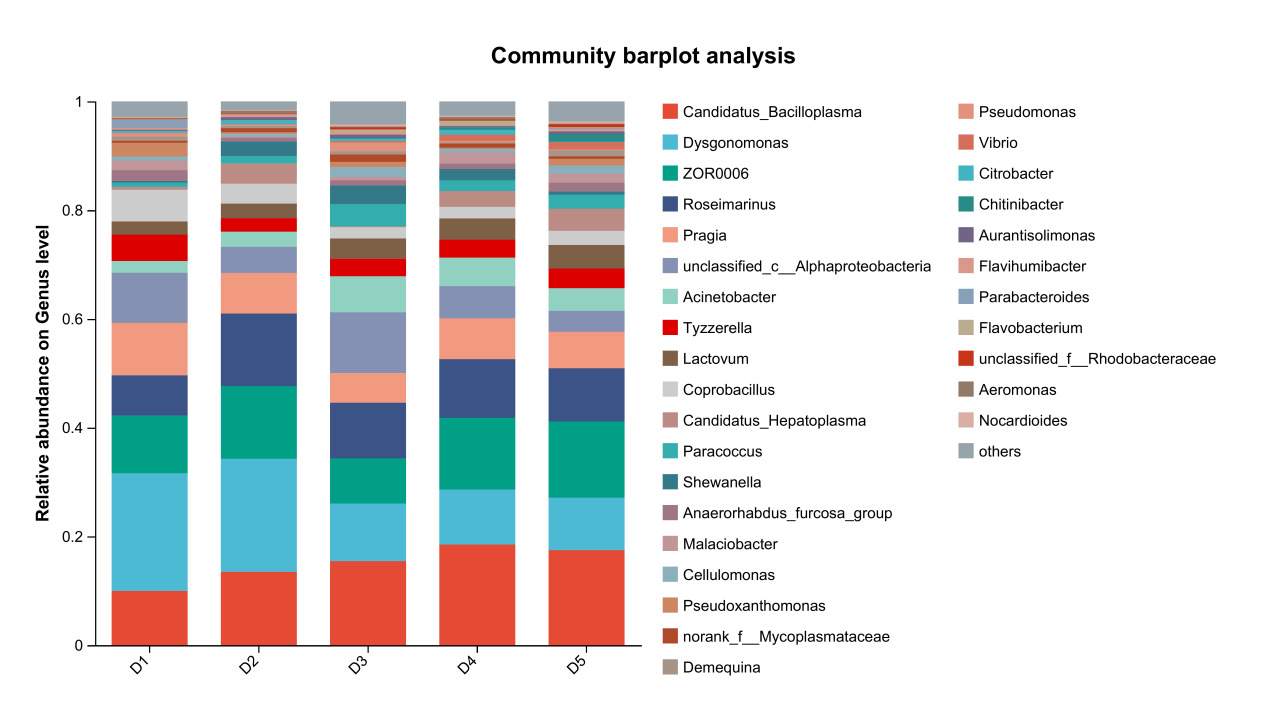
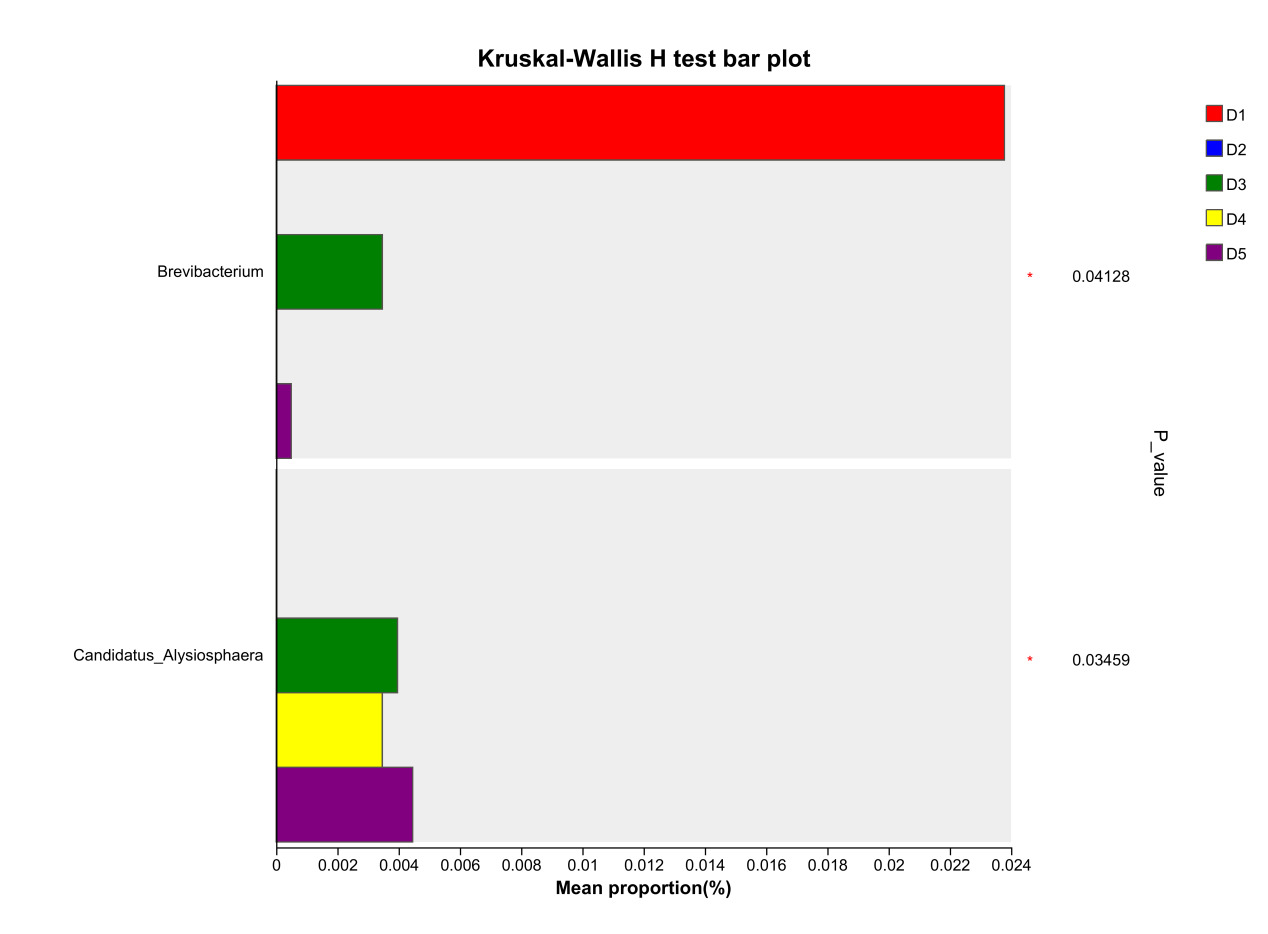
At the genus level, the dominant intestinal microbiota of E. sinensis in each treatment group were Candidatus_Bacilloplasma, ZOR0006, Dysgonomonas, Roseimarinus and Pragia. The remaining major genera included unclassified_c_Alphaproteobacteria, Acinetobacter, Tyzzerella, etc. (Figure 5). Significant differences were observed in the abundances Brevibacterium and Candidatus_Alysiosphaera among the treatment groups (P < 0.05) (Figure 6).
4. DISCUSSION
4.1. GROWTH PERFORMANCE
Chitinase has been extensively applied in diverse fields, including the aquaculture industry. However, no relevant studies have been reported on the effects of chitinase on E. sinensis up to now. Studies on aquatic animals have demonstrated that the supplementation of an appropriate amount of chitinase in diets can significantly improve the growth performance of farmed animals.19 In the present study, FBW, WG, and survival of E. sinensis in each group showed a significant positive linear correlation with dietary chitinase addition levels, and FCR exhibited a significant negative linear correlation (Table 2). When dietary chitinase addition reached 15 g/kg (groups D4 and D5), the growth performance of E. sinensis was significantly enhanced compared to the control group (Table 2), consistent with the aforementioned findings. These results indicate that appropriate dietary chitinase supplementation can effectively improve the growth performance of E. sinensis. This improvement may be attributed to the ability of chitinase to degrade chitin into chitooligosaccharides. Studies have reported that chitinase participates in the degradation of chitin-containing foods, thereby promoting digestion.20 Similar findings were observed in mud crab (Scylla paramamosain)21 and Chinese shrimp (Fenneropenaeus chinensis),22 where chitinase was confirmed to aid in the digestion of chitin-rich diets. Zhang et al.23 found that increased dietary chitooligosaccharide content significantly improved the growth rate and WG of red claw crayfish (Cherax quadricarinatus), with similar results were reported in Pacific white shrimp.24 These studies suggest that chitooligosaccharides enhanced the growth performance of aquatic animals, possibly by strengthening their immune capacity to reduce disease infestation or by inhibiting the proliferation of intestinal pathogens while promoting beneficial microbiota, thereby improving intestinal health.25 In summary, the improvement in the growth of crabs by dietary chitinase may be attributed to its ability to degrade the chitin in the feed.
Another potential reason for the improved growth performance of E. sinensis by chitinase may be related to its role in promoting molting in crustaceans.26 Studies on oriental river prawn (Macrobrachium nipponense)27 have confirmed that chitinase plays an important role in the molting and development of crustaceans. Similar findings were observed in this study, the molting interval of crabs in each group showed a significant negative linear correlation with dietary chitinase content, and the molting interval in group D5 was significantly shorter than that in group D1 (Table 2). Thus, the promotion of crustacean molting by chitinase may also be a key factor in enhancing the growth performance of E. sinensis.
Hepatopancreas (HP) as the main site for digestive enzyme secretion, plays a key role in promoting digestion. In this experiment, the hepatosomatic index, as well as the activities of HP protease and lipase, all shows a significant positive linear correlation with dietary chitinase addition level (Table 2). The hepatopancreatic lobule morphology in groups D3, D4, and D5 were better than that in group D1 (Figure 2), and the whole-crab protein content was also significantly higher than that in group D1 (Table 3). It can thus be inferred that appropriate dietary chitinase improved the HP health of the crabs, promoted the secretion of digestive enzymes, and enhanced feed protein deposition, thereby improving the growth performance of E. sinensis. This may be related to the function of chitinase in degrading chitin to produce chitooligosaccharides. Fernandes et al.28 found that increased chitooligosaccharide content significantly alleviated inflammatory damage to the HP, indicating that chitinase can improve the health status of the HP through degrading chitin into chitooligosaccharides. Zhang et al.29 observed in their study on loach that chitooligosaccharides promoted the secretion of digestive enzymes. Additionally, Liu et al.30 found in their research on rainbow trout (Oncorhynchus mykiss) that chitooligosaccharides enhanced the deposition of feed protein in the body, suggesting that chitooligosaccharides can promote protein deposition. In summary, appropriate dietary chitinase supplementation effectively improved the growth performance of E. sinensis. This improvement in growth performance may stem from the fact that chitinase can assist in degrading chitin to produce the functional component chitooligosaccharides, thereby reducing the molting interval of E. sinensis, improving the health of HP, promoting the secretion of digestive enzymes, and enhancing protein deposition.
4.2. INTESTINAL HEALTH
As an important digestive organ for aquatic animals, the intestine refers to the segment of the alimentary canal extending from the pylorus of the stomach to the anus. It is not only the longest component of the entire alimentary canal, but also a central structure responsible for performing crucial physiological functions such as digestion, absorption, and immune defense. Given the pivotal role of the intestine in the life activities of aquatic animals, its health status exerts a decisive effect on the overall health of the organism. Meanwhile, the microbial communities colonizing the intestine play an indispensable role in maintaining the host’s health homeostasis.31 Intestinal microbiota maintain a close symbiotic relationship with the host and can regulate the growth and development, immune response, and nutrient metabolism processes of aquatic animals through multiple pathways. Certain probiotic strains can not only maintain the homeostasis of the intestinal microecosystem, but also enhance the host’s tolerance to adverse environmental factors.32 In this experiment, the dominant intestinal microbiota of E. sinensis in all treatment groups were Firmicutes, Proteobacteria, Bacteroidota, and Actinobacteriota, accounting for 92.71%, 99.54%, 98.32%, 97.42%, and 97.07% of the total intestinal microbiota, respectively (Figure 4). This is consistent with the findings of Amoah et al.33 on E. sinensis. Although no significant differences were observed in the intestinal microbiota among all groups at the phylum level, the abundance of Brevibacterium, a pathogenic bacterial genus in the intestinal microbiota, showed a significantly negative linear correlation with the addition level of chitinase in the diet in each treatment group at the genus level (P < 0.05) (Figure 6). Brevibacterium are short rod-shaped, non-spore-forming, mostly non-flagellated, and non-motile bacteria. Ye et al.34 found in their study that Brevibacterium are the dominant endogenous spoilage bacteria in fresh Pacific white shrimp, causing spoilage and deterioration of shrimp. The decreased abundance of Brevibacterium in the intestine is probably associated with the antibacterial activity exerted by chitooligosaccharides, which are generated from the degradation of intestinal chitin by chitinase. Rimoldi et al.35 found in their research that chitin oligosaccharides positively regulated the intestinal microbial community of rainbow trout. Study on Nile tilapia36 have shown that dietary chitinase improved intestinal health to a certain extent. Similar findings were observed in studies on rainbow trout37 and gibel carp (Carassius auratus gibelio),38 where chitinase was found to improve intestinal microbiota and health through chitin degradation. However, the composition of the intestinal microbiota is not only determined by the diet ingested by aquatic animals, but also influenced by factors such as the aquaculture environment and animal species.39 Thus, the current results cannot be fully attributed to the sole effect of chitinase, and its specific contribution requires further verification through a controlled-variable experimental design.
In the present study, dietary chitinase level exhibited a significant positive linear correlation with the intestinal fold height of E. sinensis (P < 0.05) (Table 6), with the intestinal fold height in groups D3, D4, and D5 being significantly higher than that in group D1. Sun et al.40 reported similar results in gibel carp (Carassius auratus gibelio), demonstrating that an appropriate increase in chitooligosaccharide content significantly elevated intestinal fold height. This phenomenon is presumably attributed to chitooligosaccharides generated by chitinase-mediated chitin degradation, which improve the intestinal microbiota structure. These findings collectively indicate that dietary chitinase can positively regulate intestinal microbiota and enhance intestinal health. Nevertheless, Li et al.41 observed in their study on songpu mirror carp (Cyprinus carpio specularis) that a high-sugar diet led to a significant reduction in fold height. This might be due to excessive dietary sugar indirectly promoting histamine release, thereby inducing intestinal damage.42 Therefore, the amount of chitinase added to the feed should be appropriate. Since chitinase degrades chitin to produce chitooligosaccharides, excessive chitinase supplementation could result in an overabundance of chitooligosaccharides, triggering excessive histamine release, causing intestinal damage, and exerting adverse effects on intestinal health. In the current study, the highest chitinase addition level (20 g/kg) exerted a positive effect on the intestinal health of E. sinensis. Whether higher chitinase additions would lead to excessive oligosaccharides in the feed and thus affect intestinal health warrants further investigation.
4.3. ANTI-OXIDATIVE PROPERTIES
Aquatic animals can resist oxidative damage by virtue of their endogenous antioxidant enzyme defense system, which mainly consists of SOD, CAT, GSH-Px and T-AOC. In the present study, chitinase exerted a significant linear effect on the activities of T-SOD, GSH-Px, T-AOC, CAT, and MDA content in E. sinensis (P < 0.05). Specifically, the activities of T-SOD, GSH-Px, CAT, and T-AOC in the experimental groups increased with the dietary chitinase content, and MDA content decreased accordingly (Table 5). A similar finding was reported by Zhang et al.17 in Epinephelus guttatus, where dietary supplementation of chitinase enhanced the antioxidant capacity of aquatic animals. This phenomenon may be associated with chitooligosaccharide—the hydrolysis product of chitin catalyzed by chitinase. As one of the chitin hydrolysis products in crustaceans, chitooligosaccharide exhibits potent antioxidant activity. It can react with high-energy free radicals via the amino and hydroxyl groups on its pyranose ring, thereby facilitating the formation of stable composite molecules.43,44 In addition, chitooligosaccharide is capable of ameliorating oxidative stress either by activating the nuclear factor erythroid 2-related factor (Nrf2) pathway which is associated with inflammation, or by inhibiting the signaling pathways of nuclear factor kappa-B (NF-κB) and mitogen-activated protein kinase (MAPK).45 Niu et al.46 observed in their study on black tiger shrimp (Penaeus monodon) that increased dietary chitooligosaccharide content significantly improved the activities of CAT, SOD, GSH-Px, and T-AOC, and reduced MDA content. Similar findings were reported by Fu et al.47 in their study on E. sinensis, which aligns with the results of this experiment. In summary, dietary chitinase enhanced the anti-oxidative properties of E. sinensis by degrading chitin to increase chitooligosaccharide content, thereby promoting free radical scavenging.
4.4. NON-SPECIFIC IMMUNITY
Serum ACP, ALP, and LZM are important indicators for evaluating the nonspecific immunity of crustaceans. ACP is a hydrolase that catalyzes the hydrolysis of phosphomonoesters to produce inorganic phosphate under acidic conditions, and is a key component of phagolysosomes.33 ALP can catalyze the hydrolysis of phosphate esters to generate antibacterial substances, participating in the immune defense process of the organism.8 LZM is an alkaline enzyme capable of hydrolyzing mucopolysaccharides, mainly killing Gram-positive bacteria by breaking the β-1,4-glycosidic bond between N-acetylmuramic acid and N-acetylglucosamine in bacterial cell walls, leading to cell lysis.9 The activity levels of ACP, ALP, and LZM can reflect the pathogen resistance and immune status of crustaceans. Studies on orange-spotted grouper,17 and Asian seabass (Lates calcarifer)48 have shown that appropriate chitinase supplementation significantly improved the nonspecific immunity of farmed animals. Consistent with these findings, the present study revealed a significant positive linear correlation between chitinase addition and serum ACP, ALP, and LZM activities in E. sinensis (P < 0.05), with the activities of these three enzymes in groups D4 and D5 being significantly higher than those in the control group (Table 5). This indicates that chitinase supplementation enhanced the nonspecific immunity of E. sinensis. The ability of chitinase to enhance the nonspecific immunity of E. sinensis may be related to its involvement in immune defense responses and the antibacterial effect of chitin. Zhao et al.49 found in their study on Pacific white shrimp that chitinase activity increased in shrimp resisting viruses, suggesting that chitinase plays a role in antiviral defense. Gao et al.50 also reported that chitinase plays a key role in the mucosal immunity of turbot (Scophthalmus maximus L.) by preventing pathogen adhesion and invasion, indicating that dietary chitinase can enhance nonspecific immunity. In conclusion, appropriate chitinase supplementation can participate in the immune response of E. sinensis and improve its non-specific immune performance.
5. CONCLUSION
In summary, the addition of chitinase to the control diet (containing 28g/kg chitin) improved the growth, non-specific immunity, antioxidative capacity and intestinal health of E. sinensis. The optimal addition level of chitinase is 15.0-20.0 g/kg.
Acknowledgments
This work was supported by Jiangsu Agri-animal Husbandry Vocational College school level research project (NSF2025ZR08) and Jiangsu Haorun Biological Industry Group Co., Ltd. (S20240619).
Authors’ Contribution
Conceptualization: Chunyan Zhang (Equal), Wenxiang Yao (Equal). Data curation: Qi Liu (Lead). Funding acquisition: Wenxiang Yao (Lead). Investigation: Chunyan Zhang (Lead).
Methodology: Wenxiang Yao (Lead). Project administration: Jianguo Wang (Equal), Quan Wang (Equal). Software: Guoan Hua (Equal), Sizhe Zhao (Equal). Supervision: Jianguo Wang (Lead). Visualization: Quan Wang (Lead). Writing – original draft: Qi Liu (Equal), Sitong Zhao (Equal). Writing – review & editing: Chunyan Zhang (Lead).
Competing of Interest – COPE
No competing interests were disclosed.
Ethical Conduct Approval – IACUC
The animal experiment was approved by the Institutional Animal Care and Use Committee of Jiangsu Agri-animal Husbandry Vocational College (Permit number: jsahvc-2023-17).
Informed Consent Statement
All authors and institutions have confirmed this manuscript for publication.
Data Availability Statement
All are available upon reasonable request.