

Introduction
China’s marine fish aquaculture industry has advanced markedly in recent years, with a total production of 2.16 million tons in 2024.1 The turbot (Scophthalmus maximus) is a significant species in China’s marine aquaculture, classified under the phylum Chordata, class Osteichthyes, and order Pleuronectiformes. The turbot is recognized for its swift growth,2–5 significant commercial worth,6,7 and remarkable adaptability to controlled settings.8,9 Wild turbot populations are primarily found in the northern Atlantic Ocean, residing in benthic habitats as a cold-water commercial species. Turbot aquaculture originated in Scotland during the 1970s.6 In 1992, turbot was introduced to China, commencing systematic domestication trials and establishing an industrialized aquaculture system that combines greenhouse facilities with deep-well seawater extraction equipment.10–13 The progress of industrialized systems has markedly reduced dependence on natural environmental conditions, establishing China as the leading authority in turbot aquaculture.12,14
Despite certain achievements, recent volatility in turbot prices and critical components of the turbot supply chain have posed challenges to the profitability of several operators, prompting their exit from the market.15 Simultaneously, there are two production strategies in the turbot market: single-batch and sequential-batch culture. Identifying the strategy that improves culture efficiency has now become a pressing issue, with direct consequences for operational success.4,9,16
Given these challenges, a scientific examination of diverse aquaculture practices worldwide, along with an integration of the current state of China’s turbot industry, is necessary to offer an economic feasibility assessment. The economic analysis of the European Union’s turbot industry reveals that the geographical positioning of production facilities within the natural distribution range of turbot, a conducive institutional framework, and the financial and technological capabilities of the enterprises are critical determinants.17 This serves as a significant reference for strategy development among aquaculture growers in China. The application of cost-benefit analysis techniques has advanced the scientific progress of aquaculture. Shang et al. asserted that the analysis of cost structure and economic efficiency indicators is essential in aquaculture economic research.18 The economic viability of various aquaculture systems is influenced by factors like operational scale, technological proficiency, and management approach. For instance, small-scale aquaculture in Ghana, while marginally successful (cost-benefit ratio = 1.14), necessitates a payback period of 7 to 9 years.19 Conversely, capital-intensive systems must be expanded to attain economic feasibility: Submerged cage aquaculture in Taiwan is financially viable only with a minimum of 8 units established, yielding optimal returns at 24 units (internal rate of return = 20.84%).20 The RAS offers varied culture scenarios for distinct species: goldfish culture necessitates over 20 cubic meters of water capacity for profitability,21 whereas zebra (Hypancistrus zebra) is economically viable solely in small-scale, high-quality models, yielding an internal rate of return of up to 74.71%.22
Utilizing the scientific framework of cost-benefit analysis, numerous researchers employ instruments such as net present value (NPV) and cost-profit ratio to examine the viability of various aquaculture modes. Nyberg et al. employed NPV to evaluate the economic advantages of releasing juvenile Atlantic salmon.23 Shi et al. assessed the economic performance of monoculture (kelp or scallop) and diversified culture (kelp-scallop) systems by NPV and cost-profit ratio methodologies, and analyzed the profitability of various production models.24 Kaiser et al. performed a cost-benefit analysis of platform-based open mariculture and concluded that repurposing previously demolished structures for aquaculture could be advantageous.25 Liao et al. conducted a comparative analysis of three aquaculture methods for Chinese sea bass (Lateolabrax maculatus)—pond culture, normal cage culture, and deep-water cage culture—and determined that the overall culture cost per kilogram of Chinese sea bass cultivated in ponds was the lowest at 2.33 USD/kg.26 Yang et al. examination of Paralichthys olivaceus culture in China indicates that cage culture incurs the highest expense (5.01 USD/kg) and yields the lowest profitability, whereas industrial culture has a moderate cost (4.52 USD/kg) and achieves the maximum return. Pond culture has the lowest cost (3.75 USD/kg) and modest profitability.27
In summary, the literature on turbot mostly encompasses pathology and immunity,28–31 reproduction and breeding,32 nutrition,33 aquaculture technology,34,35 molecular biology,36,37 and initial economic assessments.38 From an economic feasibility standpoint, there are limited comparative analyses regarding the economic advantages of recirculating aquaculture turbot projects across varying diets, strains, sizes, and cycles. This paper tackles this shortcoming.
The contributions of this study are as follows: Firstly, the cost dynamics of the turbot recirculating aquaculture process are examined, encompassing fixed costs, variable costs, cost structure, monthly cost distribution, breakeven yields, and prices. Secondly, a cost-benefit analysis of various compound feeds for the recirculating aquaculture of different turbot strains was conducted, providing a reference for identifying the optimal strain-feed combination. Thirdly, the economic analysis of various culture scales and life cycles of aquaculture projects provide a decision-making basis for determining the optimal scale and duration of the project.
The structure of this paper is as follows. The second section presents the turbot RAS, devises and contrasts two aquaculture strategies through data collection, and enumerates the primary cost-benefit analysis methodologies employed in this study. The third section presents the results. The cost structure and monthly distribution of cultured turbot were thoroughly assessed, leading to the determination of break-even yield, price, optimal genetic strain and feed combination, suitable culture scale, and project life cycle. The fourth section examines and interprets the principal findings of this study in conjunction with pertinent literature and proposes appropriate recommendations. Finally, the fifth section outlines this study’s principal findings.
Materials and Methods
Introduction to the RAS for Turbot
The primary process of the RAS includes water treatment components such as microfiltration, fluidized sand-bed biofiltration, degasification towers, Low-Head Oxygenators (LHO), foam separators, and ozone reaction towers. It is outfitted with an automatic monitoring and control system for water temperature, salinity, pH, dissolved oxygen, and ORP, as well as a seawater source heat pump temperature control system. The system is distinguished by extensive equipment, elevated efficiency, compact footprint, and a significant level of automation.39 Due to the modular design, each connection can be improved and upgraded separately and changed simply, which is advantageous for standardized operation and standardized management. This study assumes the utilization of identical recirculating aquaculture facilities as referenced by Wang & Ma.4,40 To mitigate the model’s complexity, this study incorporates additional preset conditions: there is no heterogeneity among turbot individuals.
Data Collection
This study, conducted by China’s national marine fish industry technology system industrial economy research team, involved collecting data from 19 comprehensive test stations and over 90 coastal counties in major aquaculture regions. The research focused on coastal aquaculture areas, gathering quarterly data on marine fish farming species, stocks, sales, prices, areas, aquaculture producers, and input factors (such as seedlings, feed, and fish medicine) relevant to China’s marine fish farming industry. This study also acquired aquaculture data from existing literature sources.41,42
Design and Methodology of Two Culture Strategies for Turbot
This study developed and evaluated two culture management strategies: single-batch culture strategy and sequential-batch culture strategy. The two strategies operate on the same culture period within the same RAS system, but differ in how the fish batches are stocked and harvested.
The single-batch culture strategy employs the conventional all-in and all-out method, utilizing the system’s maximum biological carrying capacity to produce turbot to the largest feasible size during the culture cycle. The sequential-batch culture strategy separates the production cycle into two successive identical phases. Despite the reduced output per cycle in sequential-batch culture strategy, the total production is higher after two consecutive operational cycles. The sequential-batch culture strategy optimizes the utilization of the RAS system, while the increased listings of turbot enhance operational efficiency.
The prediction of growth trajectories was conducted by fitting the body weight progression of turbot within the specified system using the Gompertz growth model, as derived from experimental data provided by Wang & Ma.4,40 The 3-parametric Gompertz function is most suitable in describing the growth curve of turbot and creates the most realistic predictions of future growth.5 Analyses of turbot growth conducted in Germany and China have both validated the Gompertz model as the most appropriate for describing its growth pattern.4,5
The hatching time of turbot is typically stated as t = 0, and the fish growth model describes the entire process from hatching to adult fish. In actuality, turbot adult fish farming businesses in China often begin operations three months after hatching. This study modified the time variable t to t + 3, which is comparable to shifting the growth curve to the left for three months, in order to align the model’s starting point with the actual culture starting point. The model formulation is expressed as follows:
W(t)=2788.11∗exp{−8.6∗exp[−0.12∗(t+3)]},
The growth of turbot is shown by its body weight, which is given in grams and written as Wt. Based on past operations (survival rate of 98.8 percent in 320 days),9 the daily mortality rate is approximately 0.00375%. The single-batch culture strategy is expected to achieve an overall survival rate of 97.26% (1-0.00375%×365×2), while the sequential-batch culture strategy is expected to achieve an overall survival rate of 98.63% (1-0.00375%×365). The survival rates utilized in this study are derived from actual farming data collected from advanced recirculating aquaculture systems and leading aquaculture enterprises within the Chinese turbot industry. Given that this study aims to evaluate the farming potential under optimized management conditions, survival rate that reflect the current technological advancements were employed.
Based on the original release quantity, these survival rates are used to figure out the final harvest quantity. The starting quantity of seedlings was established according to the maximum biological carrying capacity of the RAS. The carrying capacity is influenced not only by engineering parameters like the supply of dissolved oxygen and the ammonia removal efficiency of biofilters, but also by the biological traits of turbot. Previous studies have shown that excessively high stocking densities can compromise fish welfare, impede fish growth, and increase the incidence of diseases.43,44 Conversely, insufficient stocking densities can lead to reduced utilization of rearing space and may be associated with elevated juvenile mortality rates.45,46 This study, drawing on the findings of Person-Le Ruyet,47 Rurangwa et al.,48 Jia,9 and Han et al.,49 along with insights from aquaculture professionals, posits that in RAS, the maximum instantaneous biomass density for 1-year-old turbot is 52.30 kg/m2, while for 2-year-old turbot, it is 75 kg/m2. The maximum instantaneous biomass density varied significantly with turbot size.
The RAS utilized by the aquaculture company supporting this research has a total culture area of 360 m². According to the growth curve (Equation 1), the average body weight of one-year-old turbot is 672.87 g, while that of two-year-old turbot is 1,990.84 g. Consequently, the maximum stocking capacity of this system is 27,981 one-year-old turbot or 13,562 two-year-old turbot.
Based on the observed survival rates, the initial stocking density for the sequential-batch strategy was calculated to be 28,370 individuals. In contrast, the single-batch culture strategy required an initial stocking of 13,944 individuals. For the single-batch culture strategy, 13,944 juvenile fish were stocked at t = 0 and cultured for 24 months, reaching an average body weight of 1.99 kg at harvest. The single harvest event yielded an estimated 13,562 individuals, resulting in a total production of 27,000 kg. The sequential-batch culture strategy began with an initial stocking of 28,370 juveniles at t = 0. After 12 months, the first cohort was harvested, and a second cohort was immediately restocked to be harvested at t = 24 months. Each harvest event yielded an estimated 27,981 individuals, resulting in a total production of 37,656 kg (Table 1).
Methodology for Cost-Benefit Analysis of Recirculating Aquaculture of Turbot
Sales prices are determined based on average historical market prices, while the total cost of aquaculture encompasses both fixed and variable costs.50 Let S denote sales revenue, P the unit price of the product, Q the quantity produced, C the total cost, F the fixed costs, and v the variable cost per unit. Thus, the relationships are as follows:
S=P×Q
C=F+v×Q
Break-even occurs when sales revenue equals total cost, i.e.,
P×QF+v×Q
When P is set to the average historical price of turbot, denoted as P₀ (6.91 USD/kg), the corresponding break-even yield is given by:
Breakeven yield=CP0
At maximal production capacity, referred to as Q₀, the break-even price can be articulated as:
Breakeven price=FQ0+v
The cost-profit ratio is utilized to assess the efficiency of cost management:
Cost-Profit Ratio =( profit cost )×100%
Profitability is evaluated using the sales profit margin, which denotes the ratio of profit to sales revenue.
Sales Profit Margin =(profitsalesrevenue)×100%
The marginal contribution rate, defined as the ratio of (sales revenue less variable costs) to sales revenue, is utilized to evaluate a product’s capacity to contribute to the firm.
Contribution Margin Ratio=(sales revenue−variable costssales revenue)×100%
Net Present Value (NPV) is a crucial financial metric for assessing the economic feasibility and investment possibilities of a project. The calculation involves the disparity between the present value of expected future net cash flows and the initial investment.51,52 The formula for calculating NPV is presented in Equation (10):
NPV=T∑t=1Pt(1+I)t−C
where NPV = net present value; Pt = net cash flow in year, n; I = discount rate; and c = initial cost of investment.52
The Internal Rate of Return (IRR) is the actual rate of return on the investment with proper accounting for the time value of money.51,52 A greater internal rate of return suggests that the project’s earnings prospects are higher.
The payback period denotes the duration required to fully recoup the initial capital investment of a project.51,52 It can be quantified using Equation (11) as follows:
P=IE
where P = payback period in years; I = amount of investment; and E = expected annual net revenue.
In conducting the cost-benefit analysis, all financial data initially reported in Chinese Yuan (CNY) were converted to US Dollars (USD). The conversion utilized the average USD/CNY exchange rate for July 2023, recorded at 1 USD = 7.1619 CNY.
All data collection, statistical analysis, and figure and table construction in this study were conducted using Microsoft Excel Professional Plus 2021.
Results
Fixed Cost Analysis
Aquaculture Facility Buildings
The facility encompasses a 600 m² factory building, with a construction cost of 139.63 USD per m², resulting in a total investment of 83,776.65 USD. This comprises ten containers, each with an area of 36 m²; a circulating water system covering 120 m²; a service alley of 60 m²; and an additional 60 m² of auxiliary space allocated for pump houses, power substations, and warehouses. The asset is projected to be depreciated over a period of 20 years, incurring a monthly fixed cost (Cfb) of 331.62 USD, with a residual value of 4,188.83 USD at the end of the term.
RAS
The cost of the RAS was 69,813.88 USD. The 10-year linear depreciation plan stipulates a monthly fixed cost (Cras) of 552.69 USD, with a residual value post-depreciation of 3,490.69 USD.
Fiberglass Tanks
The unit price for 10 fiberglass tanks is 3,071.81 USD, resulting in a total capital investment of 30,718.11 USD. The depreciation term is ten years, the monthly fixed cost (Cft) is 243.19 USD, and the residual value is 1,535.91 USD.
Backup Generator
The cost of acquiring a backup generator is 27,925.55 USD, which is discounted linearly over a decade. The monthly fixed cost (Cg) is 221.08 USD, while the residual value is 1,396.28 USD.
Electrical Substation
The electrical substation is worth 13,962.78 USD. The residual value is 698.14 USD and the monthly fixed cost (Cs) is 110.54 USD following ten years of linear depreciation.
Well Drilling, Pipeline, and Electrical Distribution
The overall investment of 4,635.64 USD for the seawater intake infrastructure comprises drilling to a depth of 25 meters (628.32 USD), installation of a 1,000 meters 110 mm PE pipeline (2,513.30 USD), and deployment of a 1,000-meter distribution system utilizing 35 mm² aluminum cable (1,494.02 USD). The asset depreciation time is ten years, the monthly fixed cost (Cwpe) is 36.70 USD, and the residual value is 231.78 USD.
Water Pumps
Water pumps, with a unit cost of 279.26 USD and a service life of one year, were procured under different strategies for each culture model. For the single-batch culture strategy (2-year cycle), two units were purchased at t=0 (Cwp = 558.51 USD). For the sequential-batch culture strategy (1-year cycle), one unit was purchased at t=0 (Cwp = 279.26 USD).
Land Rent
The land rental rate (Crl), adopted from the National Seawater Fish Industry Technology System’s Industrial Economics Team, is set at a fixed monthly rate of 83.78 USD.
Fixed Staff Salary
The fixed monthly personnel cost (Cps) was set at 698.14 USD, corresponding to the salary of one full-time employee responsible for management, operational and technical tasks.
Warehouse Costs
In accordance with prevailing industry practice, feed storage is accommodated within the existing facility infrastructure. No dedicated storage cost was therefore allocated, yielding a warehouse cost (Cwh) of zero.
Variable Cost Analysis
Seedling Costs
Seedling acquisition constitutes a one-time capital outlay at the onset of the production cycle. Based on data from the National Seawater Fish Industry Technology System’s Industrial Economics Team, the total seedling cost (𝐶tf) is defined as 𝐶tf = 0.21 × 𝑁𝑠, where 0.21 USD represents the price per tail and 𝑁𝑠 is the total number of seedlings stocked.
Feed Costs
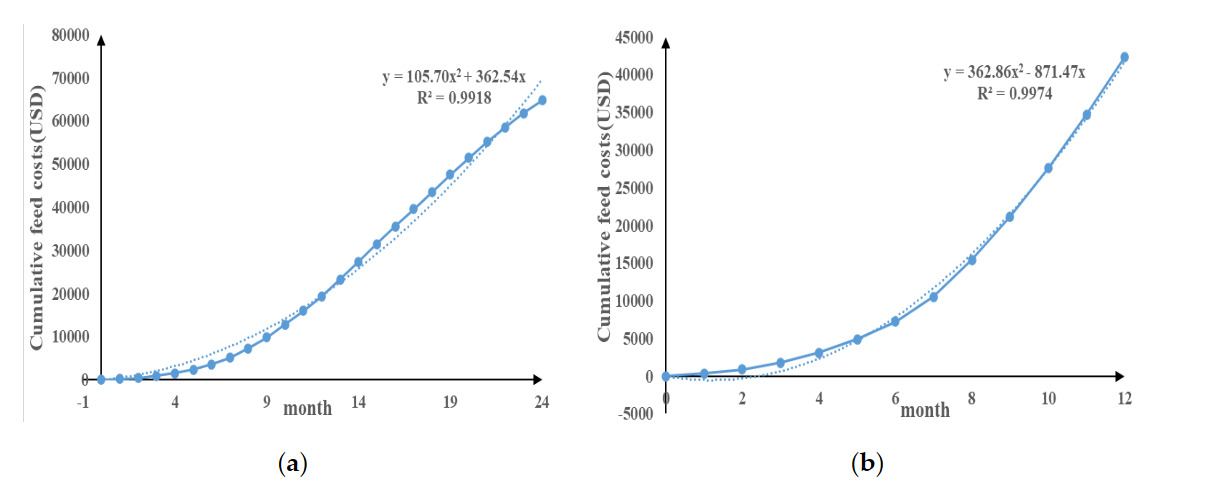
This section quantifies the costs associated with turbot cultured in RAS according to two distinct strategies: a single-batch culture strategy with a 2-year full production cycle (Table 2, Figure 1a) and a sequential-batch culture strategy implemented during the first year of operation (Table 3, Figure 1b). The weight increment data utilized in the calculations were obtained from the growth curve of turbot.4,8,40,53 Key zootechnical parameters, including stocking density and survival rate, were sourced directly from the experimental work of Jia Rui.9

The feed coefficient (FCR) exhibited variation according to fish size. The examination of FCR in scientific literature indicates that for 10g juvenile fish, the ratio was 0.8:1, which increased to 1.1:1 during the 10g to 2kg stage, and ultimately reached 1.3-1.8 for market-sized fish (> 1.5kg).9,47–49 This study was designed using scientific literature and feed conversion ratio data sourced from aquaculture farm. The feed history was obtained from the industrial economic database of Chinese national marine fish industry technology system, indicating an average price of 2.23 USD/kg. This study predicted feed demand and calculated costs based on the specified FCR parameters and feed price data.
The relationship between feed cost (Cf, Sin-B) and time t (month) in a single-batch culture strategy can be further derived using the aforementioned methods and data, resulting in equation 12. Equation 13 represents the relationship between feed cost (Cf, Seq-B) and time t (month) in the sequential-batch culture strategy.
Cf,Sin−B=105.70t2+362.54t
Cf, Seq-B =362.86t2−871.47t
Electricity Costs
The aquaculture site for this study is assumed to be located in Qingdao, Shandong Province, where turbot culture commonly relies on deep well seawater. According to Lei Jilin,12 the depth of seawater wells in the intertidal zone ranges between 13 and 20 meters, with the water temperature remaining consistently between 13°C and 18°C throughout the year. This stable temperature profile of deep well seawater effectively mitigates the risks associated with temperature fluctuations, thus supporting the continuous, year-round growth of turbot.54 In this study, it is assumed that both the deep well seawater and the RAS water maintain a constant temperature range of 13°C to 18°C.
During winter in Qingdao, when the average outdoor temperature falls below 13°C, it is necessary to heat the circulating water to sustain the appropriate culture temperature for turbot. Conversely, during summer, when the average ambient temperature surpasses 18°C, the flowing water must be chilled to sustain the temperature range necessary for aquaculture. Empirical data indicate that in Qingdao, when the average minimum temperature attains 0°C, the temperature of the aquaculture water in the circulatory system declines by around 2°C daily. The heat wasted by the fiberglass tank is presumed to be equivalent to the heat absorbed.
This study assumes a specific heat capacity of seawater of 4200 J/(kg·°C) and a density of 1.025 × 10³ kg/m³. The electricity cost for aquaculture was 0.0768 USD/kWh, and the volume of aquaculture water in the circulating system was 180 m³. The operational experience data of the circulating water system suggests that the temperature decrease within the system over a single day is proportional to the difference between the external temperature and the minimum culture temperature of 13 °C during winter. As external temperatures decline, there is a corresponding increase in the decrease of aquaculture water temperatures. Table 4 and Table 5 indicate that the mean outdoor temperature in January is 0 °C. Consequently, for a particular date in January:
The heating power consumption is calculated as: 4200 J/(kg·°C) × 1.025 × 10³ kg/m3 × 180 m3 × 2°C = 1.5498 × 10⁹ J.
The electricity cost for temperature regulation is given by: 0.0768 USD/kWh × (3.6 × 10⁶) -1 kWh/J × 1.5498 × 10⁹ J = 33.06 USD.
The operational rules of RAS stipulate a daily water exchange rate of roughly 5% to sustain normal aquaculture productivity. According to information from Qingdao General Aquaculture Co., Ltd., the recirculating water system functions at a power of 8 kW, incurring a daily electricity expense of 14.74 USD. The operational electricity cost is calculated as follows: 0.0768 USD/kWh × 8kW × 24h = 14.74 USD.
When the culture density exceeds 55 kg/m², the system’s power increases to 11 kW, raising the daily electricity cost to 20.27 USD: 0.0768 USD/kWh × 11kW × 24h = 20.27 USD.
From the physical work needed to extract deep well seawater to the actual power consumption, then to the electricity cost of water intake, the following formula computes the entire process. In the first step, the mechanical work (in joules) needed to theoretically overcome gravity is calculated using the water’s density (1025 kg/m3), volume (9 m3), gravity acceleration (9.8 m/s2), and lifting height (25 m). Nevertheless, energy is lost during the pump’s real operation. Since the working efficiency of the pump is assumed to be 50% in this case, multiplying 2 indicates that the real power consumption is double the theoretical mechanical effort. Since 1 kWh is equivalent to 3600000 Joules, the second step is to divide the computed total Joule number by 3600000 and convert it to power consumption (kilowatt-hour). Ultimately, the ultimate electricity cost for water extraction is calculated by multiplying it by the unit price of USD 0.0768 per kilowatt-hour: 0.0768 USD/kWh × (3.6 × 10⁶) -1 kWh/J × 1.025 × 10³ kg/m3 × 9 m3 × 9.8 m/s2 × 25 m × 2 = 0.10 USD.
Therefore, the total electricity cost for January is calculated as: January electricity cost = 31days × (33.06 + 14.74 + 0.10) USD /day = 1484.95 USD. Similarly, electricity costs for other months can be computed based on the temperature variations, as detailed in Table 4.
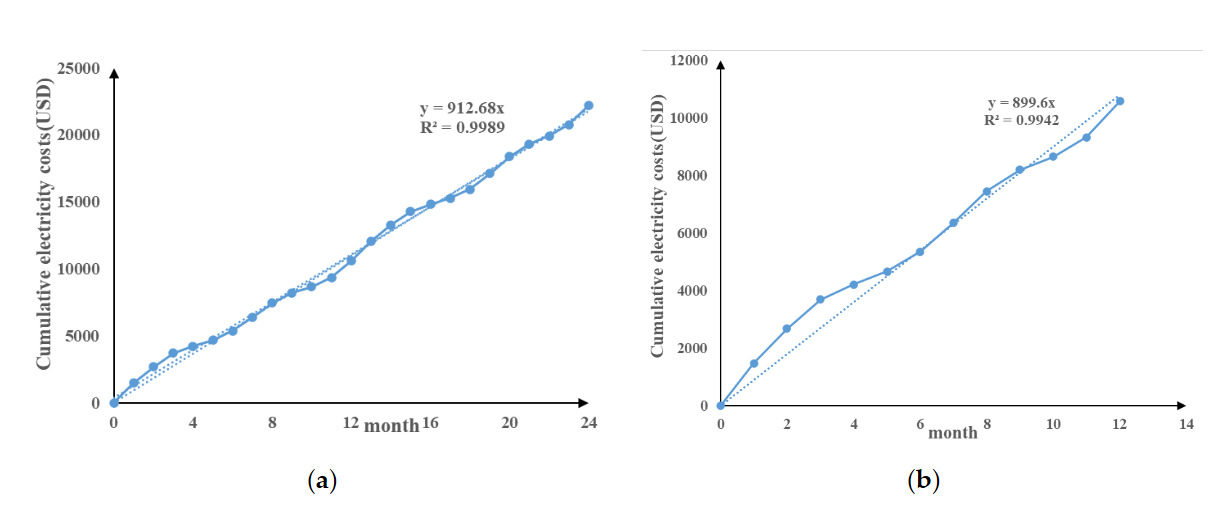
The cumulative electricity costs for both culture strategies are modeled as linear functions of time t (month). For the Single-batch culture strategy (Table 4, Figure 2a), the relationship is described by the following linear function:
Ce,Sin−B=912.68t
Similarly, for the Sequential-batch culture strategy (Table 5, Figure 2b), the cumulative electricity cost is described by the following linear function:
Ce, Seq-B=899.6t

Temporary Employee Wages
The temporary employee cost associated with RAS tank administration encompass daily feeding, water quality assessment, and system maintenance. The cost of a temporary employee (𝐶ts) for a 10-day period is 279.26 USD per month, with a daily cost of 27.93 USD.
Liquid Oxygen Cost
As defined by Niu Huaxin et al.42 and the National Seawater Fish Industry Technology System’s Industrial Economics Team, the liquid oxygen cost in this model is formulated as a function of time: Clo = 125.66 t, where ‘t’ represents time in months, and the coefficient 125.66 carries the unit of USD/month.
Maintenance and Fuel Cost
The monthly equipment maintenance cost is 139.63 USD, as indicated by the operating data of Qingdao General Aquaculture Co., Ltd. It is represented by Cmt = 139.63t, where ‘t’ represents the cumulative time in months. The fuel cost is solely incurred when the generator is activated as a result of a power outage on the farm.
Fish Medicine and Animal Health Costs
This study determined a fixed monthly cost of water treatment chemicals to be 13.96 USD, based on the cost analysis conducted by Niu Huaxin et al.42 and the industrial economic team of the national marine fish industry technology system. The process involves cleaning the vacant fish tank and aquaculture environment, utilizing hydrogen peroxide and bleach for equipment disinfection, and augmenting seawater alkalinity. Consequently, the expense for fish medication and animal health costs is represented by 𝐶𝑚d = 13.96 t, where ‘t’ denotes the cumulative time in months.
Water Resource Cost
Given that the extraction of deep well water—a primary source for most RAS in northern coastal China—is an unpriced natural resource, the water resource cost (𝐶𝑤) is assumed to be zero in this model.
Transportation Cost
Transportation costs in RAS operations primarily encompasses logistics and management activities associated with sales. Most farms primarily engage in adult fish farming. Upon harvesting, the majority of the cultured turbot is collected by the sales company. The proportion of administrative expenses is minimal and exhibits a limited direct correlation with aquaculture production. Consequently, this calculation excludes transportation costs. The transportation cost is formalized as 𝐶𝑡𝑟 = 0, a determination that is consistent with reported data from multiple surveyed enterprises.
Aquaculture Insurance
Based on surveys conducted in the main producing areas, no insurance product is available for the stock within the turbot aquaculture sector. Consequently, the cost of aquaculture insurance (𝐶ai) is assumed to be zero in this model.
Monthly Cost Proportions
Figure 3a illustrates the monthly cost ratio of the single-batch culture strategy, emphasizing the variations across different months. During the intermediate and later phases of breeding, feed expenses constitute a significant portion. The power expense exhibits notable seasonal variation, while the other expenses demonstrate minimal variability.
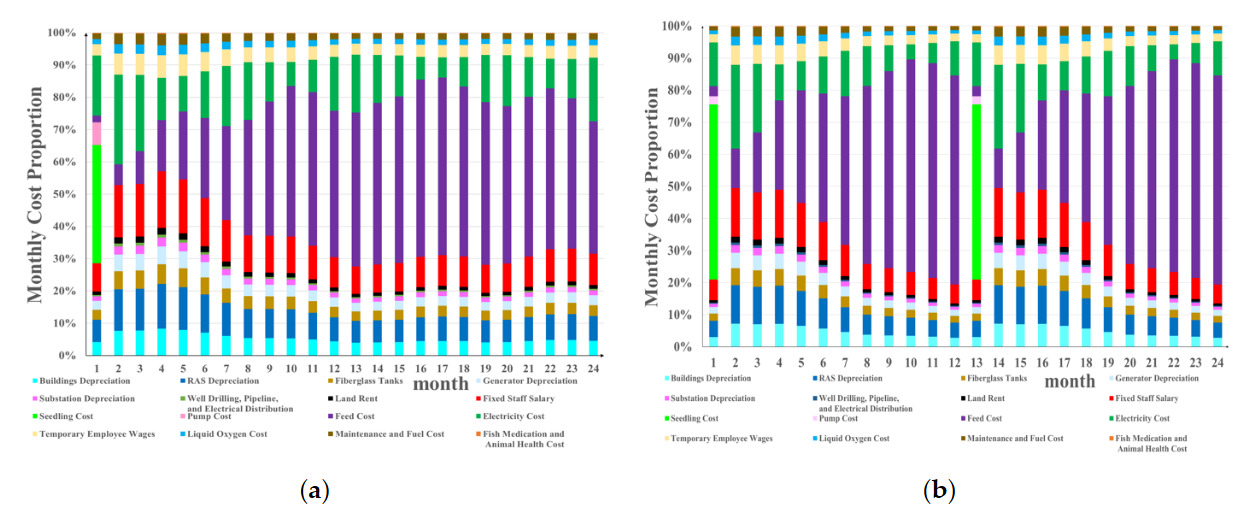
Figure 3b illustrates the monthly cost ratio of the sequential-batch culture strategy. Throughout the two-year culture period, the cost ratio between the first and second years remained constant. Feed expenses constitute the predominant component of the overall cost structure throughout the culture cycle. The cost of electricity varies significantly each year. Aside from the initial expenditure on seedlings and pumps, other expenses often exhibited a declining tendency during the one-year culture cycle.
Cost Structure
Table 6 presents the cost structure associated with the single-batch culture strategy and the sequential-batch culture strategy in turbot recirculating aquaculture. The table indicates that feed costs, electricity costs, and employee wages constitute the largest share of the total expenses. The feed cost constitutes over 40% of the total expenditure in turbot RAS. A comparative analysis of the cost structure of the two strategies reveals significant differences in the proportion of seedling costs. The seedling cost ratio for the single-batch culture strategy was 1.84%, whereas the seedling cost ratio for the sequential-batch culture strategy was 6.38%.
Break-even Analysis
The break-even analysis indicates that the production risk associated with single-batch culture strategy exceeds that of the sequential-batch culture strategy. Table 7 presents the break-even analysis for turbot recirculating aquaculture. The break-even yield is the quantity of culture required to cover the culture costs. In the single-batch culture strategy, the break-even yield was 20,765 kg, whereas in the sequential-batch culture strategy, it was marginally lower at 20,740 kg.
Actual yield capacity denotes the highest output that an aquaculturist can attain. The actual yield capacity of the single-batch culture strategy was 27,000 kg, whereas the real yield capacity of the sequential-batch culture strategy was 37,656 kg. The utilization rate of current yield capacity at the break-even point is defined as the ratio of break-even yield capacity to actual yield capacity. At the break-even point, the utilization rate of the single-batch culture strategy is 76.91%, whereas the utilization rate of the sequential-batch culture strategy is 55.08%.
The break-even price denotes the price point at which sales revenue equals total culture costs. The break-even price for the single-batch culture strategy is 5.87 USD/kg, whereas the break-even price for the sequential-batch culture strategy is 4.95 USD/kg. Assuming a sales price of 6.91 USD/kg, the single-batch culture strategy exceeds the break-even price by 1.04 USD/kg, but the sequential-batch culture strategy surpasses the break-even price by 1.96 USD/kg. The outcomes of break-even analysis indicate that the sequential-batch culture strategy possesses a reduced break-even price and an enhanced profit potential.
Economic Analysis of Recirculating Aquaculture Benefits for Two Strains of Turbot Fed with Three Types of Compound Feeds
This section examines the economic advantages of two turbot strains using three types of compound feed.41 To achieve this objective, this study conduct a secondary analysis of the original experimental data reported by Liu et al.41 The two turbot strains consisted of selective breeding strains from the commercial breeding program (Weihai Shenghang Aquatic Technology Co., Ltd.) and a control group of unselected wild-type turbot. The experiment utilized market-specific fish aged 450 days, aligned with the time point t = 12 on the conventional growth curve.
This study established three diets with varying nutritional and protein contents to assess the relationship between strains and dietary formulations. Each strain comprised three treatment groups, with three parallel groups established within each of the six treatment groups. The diets were as follows: the high-fat, low-polysaccharide diet contained 8.0% lipid and 13.0% polysaccharide; the standard diet, used as a control, comprised 70% fishmeal; and the fishmeal-reduced, plant-protein-supplemented diet reduced fishmeal content to 60%, substituting the difference with a 7.0% soybean concentrate supplementation.
The study duration was 30 days, and the turbot were subjected to a 24-hour fasting period post-experiment. Subsequently, thirty individuals were randomly chosen for weight assessment. The unit prices for three varieties of compound feed are determined based on the current market prices for feed raw materials: the high-fat, low-carbohydrate diet at 2,262.26 USD/ton, the standard diet at 2,234.10 USD/ton, and the fishmeal-reduced, plant-protein-enhanced diet at 2,200.57 USD/ton, as detailed in Table 8. This study conducted an economic analysis of the culture process utilizing cost data from the single-batch culture strategy, comparing and analyzing the economic benefits of two turbot strains across three formulated feeds, as presented in Table 9.
Economic Analysis of Three Aquaculture scales in Recirculating Aquaculture of Turbot
The analysis indicates that larger-scale aquaculture operations generally yield higher economic benefits. The survey data from aquaculture institutions, including Qingdao General Aquaculture Co., Ltd. and Shandong Institute of Resources and Environment Research, presents the cost composition of Single-batch culture strategy and Sequential-batch culture strategy (over two years) for three production scales of turbot recirculating aquaculture, as illustrated in Table 10. The wage distribution for fixed and temporary employees is characterized by a ratio of 1:3:9 across micro, medium, and large enterprises, respectively. Survey data indicate that the discount rate for other costs in medium-scale production is 98%, while for large-scale production, it is 95%.
Assuming a sales price of turbot at 6.91 USD/kg, the associated economic analysis, based on the cost structures in Table 10 is detailed in Table 11. The sequential-batch culture strategy demonstrates significant economic advantages compared to the single-batch culture strategy across all aquaculture scales. Moreover, employing the same culture strategy, an expansion in aquaculture scale would result in elevated cost-profit ratio, sales profit margin, and contribution margin ratio in comparison to small-scale operations. The findings demonstrate a scale effect in turbot recirculating aquaculture, as evidenced by financial simulation analysis.
Economic Analysis of Three Production Cycles in Recirculating Aquaculture of Turbot
The examination of the culture period indicates that the 20-year culture period is more economically viable than both the 10-year and 30-year culture periods. Table 12 presents the statistical outcomes of cash flow throughout the forthcoming decade under the two culture strategies. The findings indicate that the variations in stocking fingerlings and harvesting operations during the initial and subsequent years of each 2-year cycle in the single-batch culture strategy result in distinct cash flow patterns between the two strategies over the 10-year duration. Negative cash flow has been identified in the single-batch culture strategy, as half of the culture years incur running expenditures without yielding any revenue. Conversely, the sequential-batch culture strategy incurred negative cash flow solely during the investment and construction phases, while generating positive cash flow annually for the subsequent 10 years of culture. The sequential-batch culture strategy ensures uniform stocking fingerlings and harvesting activities annually, leading to stable cash flow for the initial nine years. Single-batch and sequential-batch culture strategies boost cash flow in the 10th year due to fixed asset residual value revenue.
Table 13 illustrates that the financial performance indicators, including NPV, IRR, and payback period, consistently demonstrate that the sequential-batch culture strategy possesses greater economic viability than the single-batch culture strategy over the 10-year, 20-year, and 30-year culture periods. Over the 10-year culture period, the NPV of the sequential-batch culture strategy amounted to 109,312.56 USD, whereas the NPV of the single-batch culture strategy was − 55,060.89 USD. The IRR for the sequential-batch culture strategy was 20.06%, markedly above that of the single-batch culture strategy at 5.39%. The payback period for the single-batch culture strategy is 8 years, but the payback period for the sequential-batch culture strategy is 5 years, indicating a more rapid return on investment.
Over the 20-year breeding period, the NPV of the sequential-batch culture strategy rose to 184,379.46 USD, whereas the NPV of the single-batch culture strategy was -43,367.08 USD. The IRR for the sequential-batch culture strategy rose to 21.46%, whilst the IRR for the single-batch culture strategy persisted at 7.53%. Over the 30-year culture period, the NPV of the sequential-batch culture strategy amounted to 200,628.07 USD, whereas the NPV of the single-batch culture strategy remained negative at -51,551.53 USD. The IRR for the sequential-batch culture strategy was 21.43%, whereas the IRR for the single-batch culture strategy was 7.24%. The statistics demonstrate that the sequential-batch culture strategy yields superior financial returns throughout all culture periods.
The comparative study of the investment period for the aquaculture project reveals the following hierarchical structure of financial indicators for the single-batch culture strategy: The 20-year NPV exceeds the 30-year NPV, which in turn surpasses the 10-year NPV; similarly, the 20-year IRR is greater than the 30-year IRR, which is also greater than the 10-year IRR. The ideal culture period for the single-batch culture strategy is 20 years. The financial metrics of the sequential-batch culture strategy and the single-batch culture strategy are inconsistent: the 30-year NPV surpasses both the 20-year and 10-year NPVs; conversely, the 20-year IRR exceeds the 30-year IRR, which in turn exceeds the 10-year IRR. Subsequent study indicates that when the 30-year period exceeds the 20-year period by 10 years, the NPV of the 30-year period is merely 8.81% more than that of the 20-year period, however the NPV of the 20-year period is 68.67% higher than that of the 10-year period. The statistics indicate that the optimal culture period for the single-batch and sequential-batch culture strategy is 20 years.
Sensitivity Analysis
The study evaluates the financial performance of two culture strategies, concentrating on a decade of turbot recirculating aquaculture. Figure 4a illustrates the sensitivity analysis of the NPV (discount rate: 10%) for the single-batch culture strategy. In the baseline scenario, the NPV is −55,060.89 USD. The influence of fish price on NPV was the most pronounced. For each 10% rise in fish price, the NPV climbed to -458.37 USD, and for each 10% decline in fish price, the NPV declined to -109,663.41 USD. The feed price significantly influences the NPV. The NPV increases to -35,558.42 USD with a 10% reduction, whereas it decreases to -74,563.36 USD with a 10% increase.
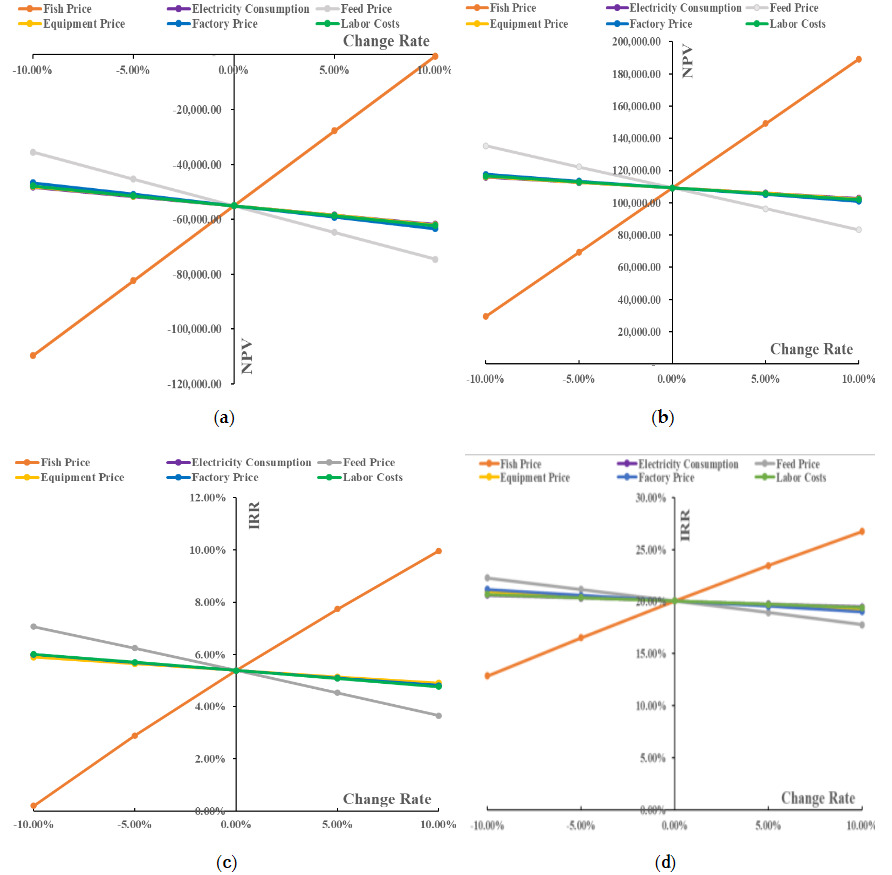
Figure 4c illustrates the sensitivity analysis of the IRR for a single-batch culture strategy. The initial IRR was 5.39%. For 10% increase in fish price, the IRR ascends to 9.96%, but for 10% reduction, it descends to 0.21%. The cost of feed is the second most significant element impacting expenses. For 10% reduction in feed price, the IRR increases to 7.07%. For 10% rise in feed price, the IRR diminished to 3.66%.
Figure 4b presents a sensitivity analysis of the NPV associated with the sequential-batch culture strategy. The initial NPV was 109,312.56 USD. The influence of fish prices is significant, resulting in a 10% increase in NPV to 189,272.50 USD, and a 10% decrease in NPV to 29,352.63 USD. A 10% reduction in feed price results in an NPV of 135,329.91 USD, while a 10% increase leads to an NPV of 83,295.22 USD. Variations in other parameters, like electricity, equipment, and labour costs, exert a diminished influence.
Figure 4d illustrates the IRR sensitivity of the sequential-batch culture strategy. The initial IRR was 20.06%. The price of fish increased by 10%, and the IRR ascended to 26.75%. Fish prices decreased by 10%, while the IRR declined to 12.85%. The feed price was decreased by 10%, and the IRR was elevated to 22.28%. Upon a 10% rise in feed price, the IRR dropped to 17.79%.
In both strategies, the price of fish is the primary determinant influencing NPV and IRR. The price of feed is a significant cost component, whereas fluctuations in electricity usage, equipment costs, facility expenses, and labour costs exert a lesser influence on overall financial success.
Discussion
This study employed financial analysis tools, including cost-benefit analysis, to comprehensively assess the economic performance of recirculating aquaculture turbot. The findings indicate substantial disparities in the economic performance of various culture strategies. The variable cost of the single-batch culture strategy accounted for 63.03%, while the fixed cost accounted for 36.97%. The variable cost of the sequential-batch culture strategy accounted for 68.57%, while the fixed cost accounted for 31.43%. The break-even analysis indicates that the capacity utilization rate at the break-even point for the single-batch culture strategy is 76.91%, markedly exceeding 55.08% of the sequential-batch culture strategy. The disparity between the sales price and the break-even price of the single-batch culture strategy is 1.04 USD/kg, markedly lower than the 1.96 USD/kg of the sequential- batch culture strategy, signifying that the single-batch culture strategy entails greater culture risks and inferior economic returns. A higher break-even point necessitates increased output and sales for farms to commence profit generation, hence diminishing their capacity to adapt to market volatility.51
According to Huang et al.,55 the economic viability of offshore cage culture is significantly influenced by critical factors such as survival rate and feed cost. Our research in turbot RAS farming corroborates this bioeconomic concept, demonstrating that profitability is profoundly influenced by feed costs and market price variations. The observed similarities indicate that alterations in the cost structure are essential determinants of the break-even point and financial risk across various aquaculture systems.
The sensitivity analysis identified fish prices and feed costs as the primary factors influencing net profit. This discovery aligns with the fundamental bio-economic concept of aquaculture, wherein, within a stable production system, fish prices directly influence income.56,57 As the principal input driving growth, feed cost volatility is a critical factor affecting cost-effectiveness, a finding consistent with numerous studies,57 even though sensitivity to feed price can vary among aquaculture projects.56 Consequently, improving feed cost efficiency is crucial to enhancing economic efficiency while maintaining nutritional quality.
Ibarra-Castro et al.56 conducted a focused case study on break-even analysis of seed output in spotted rose snapper (Lutjanus guttatus). Nevertheless, while the study identified the break-even threshold, it did not thoroughly examine the critical factors that influence it. Our research enhances understanding of aquaculture economics by elucidating the critical influence of the cost structure, specifically the fixed-cost ratio, on financial results and risk exposure.
The combined impact of feed nutrients and genetic strains is another factor contributing to variation in financial performance, alongside the culture strategy chosen. Out of all the combinations, Selected-group-ST produced the highest profit (5,624.35 USD) and cost-profit margin (57.34%). This is primarily attributed to the enhanced ability of the selected strain to tolerate and utilize carbohydrates, enabling more efficient conversion of polysaccharides in the ST diet into energy for growth.
This finding corroborates the conclusions drawn from extensive research on rainbow trout (Oncorhynchus mykiss): studies have demonstrated that the absence of carbohydrate feed severely impedes fish growth and elucidated its potential molecular mechanism, characterized by a substantial increase in muscle protein degradation rate (KD), leading to muscle atrophy and inadequate protein accumulation.58 This demonstrates the significant function of carbohydrates in inhibiting protein breakdown and promoting net protein deposition. Consequently, this study posits that the inherent advantage of the selected strains in efficiently utilizing polysaccharides within the ST diet may optimise protein turnover metabolism; specifically, by minimising unnecessary protein degradation and directing more energy derived from carbohydrates towards protein deposition and growth, ultimately resulting in enhanced economic benefits.
In contrast, the fishmeal-reduced diet (FP), while having the lowest total cost, generally yielded lower economic returns, indicating that reducing feed costs alone is insufficient to guarantee economic benefits. Recent research has clearly stated that common plant proteins, such as soybean concentrate, fundamentally impair the protein synthesis capacity of carnivorous fish by inhibiting the mTORC1 signaling pathway and triggering a hepatic energy crisis.59 This explains at a mechanistic level why simple substitution often fails, and is also consistent with the earlier view that “an appropriate supply of animal protein is crucial for maintaining the production performance of turbot”.60 The application of enzymes to hydrolyze soy protein, together with other processing methods, is anticipated to enhance feed efficacy by rejuvenating the anabolism of turbot liver and stimulating ribosomal activity.59 Consequently, the essential factor in enhancing economic performance is the accurate alignment of genetic strains and nutritional techniques.
The disparities in economic performance across strategies can be attributed to the cost structure of RAS. Unlike the conventional pond culture model examined by Liao et al.,26 the RAS necessitates substantial initial fixed asset investment and incurs ongoing power expenses, leading to a marked escalation in fixed costs. The sequential-batch culture strategy significantly increased yield per unit area to 52.3 kg/m², resulting in greater profit per unit area. The approach employs capital and technological investment to achieve enhanced space utilization efficiency and economic advantages. This study aligns with the scholarly agreement that the green aquaculture model can attain both economic and environmental benefits simultaneously.24 This affirms that, despite varying technical methodologies, such as the RAS employed in this study and the integrated multi-trophic aquaculture (IMTA) system referenced in the literature, achieving environmental sustainability objectives through technological innovation can yield substantial financial returns. The elevated ratio of fixed expenses renders the unit cost especially responsive to aquaculture scale, hence offering theoretical justification for the scale effect identified in this study.
The study revealed that the 20-year operation period yielded the most favourable economic results. This period aligns with the economic depreciation cycle of the farm building, which is twice as long as the equipment depreciation cycle.51,61 This period maximises the project’s NPV while mitigating the uncertainty associated with excessively long cycles. In long-term simulations, the absolute advantage of current aquaculture technology may diminish due to future disruptive innovations. However, the primary objective of this study is to develop an evaluation framework to analyze the impact of different management strategies on economic performance under specific technological conditions. The results indicate that optimized management strategies can significantly enhance economic benefits within the established technological parameters, and this conclusion is applicable across technological generations.
Despite achieving the maximum stocking density of 75 kg/m² at 24 months, the single-batch culture strategy inadequately utilized the culture space during the initial phase, resulting in a negative NPV and low IRR over the 10-year culture period, thereby demonstrating the financial infeasibility of the strategy. Although the multi-batch culture strategy is economically viable, there are two drawbacks: the possibility of disease transmission and rising labor expenses. In reality, two factors will directly increase the risk of pathogen transmission: (1) the accumulation of pathogens in the water; and (2) an increase in the frequency of cross-operation. Inadequate biosafety management could completely undermine the strategy’s benefits due to disease outbreaks. In this study, it is assumed that the RAS system operates efficiently. The safety of the culture process can also be ensured by routine equipment disinfection. Using new, disease-resistant cultivars also reduces the risk of illness. Thus, under optimal biosafety conditions, the study’s findings represent the maximum attainable economic potential. To develop robust solutions that balance efficiency and biosafety, future research must integrate economic and epidemiological models. The farms analyzed for this study exhibit high levels of management flexibility, prompt labor allocation, and flexibility in adjusting operating pace without hiring more staff. Therefore, the conclusion that the multi-batch culture strategy doesn’t raise labor costs applies only to production systems with effective labor scheduling and flexible management; otherwise, the farm will have to pay the temporary labor costs required for multiple batches of operations.
This study has specific limitations. The financial analysis adopted is essentially static and does not fully account for the dynamic fluctuations of market prices for turbot, as well as cost components such as feed expenses. This static simplification may affect the estimation accuracy of key economic decisions, such as the optimal culture period and optimal aquaculture scale. Moreover, the model concentrated on internal production efficiency and failed to consider the intricate interactions between the production system and the wider environmental framework. The conclusions of this case study are limited by specific climatic conditions, fish species, and market environments, making them unsuitable for direct extrapolation to other regions that differ significantly. However, the core value of this research lies in the proposed analytical methods and decision-making framework. This framework integrates biological growth models, cost data, and market price information, utilizing system simulation to evaluate and optimize management strategies, demonstrating broad applicability. Aquaculturists or researchers in other regions can adopt this methodology by inputting local parameters to generate optimal decision-making solutions tailored to their specific contexts. Future study ought to use dynamic modelling methodologies alongside real-time data to more accurately depict these interactions.
The economic performance of turbot in RAS can be enhanced by optimising culture strategies, leveraging economies of scale, and establishing a feasible business cycle. Farmers are advised to adopt a small-scale, multi-batch, high-density culture strategy, select the ideal genetic strain and its suitable diet, and monitor market swings in fish prices and feed costs to mitigate risks and achieve sustainable development.
Conclusions
This paper presents a thorough economic assessment of turbot recirculating aquaculture, encompassing financial analysis, experimental economic analysis, and simulation modelling. The examination of the two culture strategies demonstrates that the sequential-batch culture strategy outperforms others regarding profitability and risk management, while the break-even analysis highlights its capacity to maintain profit margins amid market volatility.
The selection of feed has emerged as a crucial element in enhancing economic viability. Standard diets markedly improve key financial metrics, including the cost-profit ratio, sales profit margin, and contribution margin ratio. This indicates that feed selection significantly reduces culture costs and enhances profitability. Sensitivity analysis shows that farm income is highly sensitive to market pricing and feed costs. The results show that farmers can obtain better financial returns by selecting a sequential-batch culture strategy, selecting excellent strains, standard diets, and large-scale operations, and a 20-year culture period.
Acknowledgments
The authors would like to express their gratitude to Liu Ying from Shandong Academy of Marine Sciences, Han Huizong, Xiang Zhiwei, and Wang Chengqiang from Shandong Academy of Marine Resources and Environment for their valuable data support and insightful suggestions.
Authors’ Contribution
Conceptualization: Zhiyuan Zhao (Lead). Methodology: Zhiyuan Zhao (Lead). Formal Analysis: Zhiyuan Zhao (Lead). Investigation: Zhiyuan Zhao (Lead). Writing – original draft: Zhiyuan Zhao (Lead). Writing – review & editing: Zhiyuan Zhao (Equal), Qilei Ding (Equal). Resources: Hesen Zhang (Lead). Funding acquisition: Qilei Ding (Lead). Supervision: Qilei Ding (Lead).
Competing of Interest – COPE
Author Hesen Zhang was employed by the company Qingdao General Aquaculture Co., Ltd.. The remaining authors declare that the research was conducted in the absence of any commercial or financial relationships that could be construed as a potential conflict of interest.
Ethical Conduct Approval – IACUC
All financial and culture data utilized in this study are sourced from published academic literature and databases. The animal experiments described in the original studies have been reported to have received approval from the relevant institutional animal ethics committees and have adhered to principles of animal welfare. This research constitutes a secondary data analysis and does not involve any new animal experimentation.
Informed Consent Statement
All authors and institutions have confirmed this manuscript for publication.
Data Availability Statement
All are available upon reasonable request.