Introduction
Feed is the largest input in aquaculture, directly shaping the growth, health, and productivity of cultured species. However, the rising costs and constrained supply of conventional feed ingredients pose significant challenges to the long-term sustainability of the aquaculture sector. Global feed challenges, including rising costs and competition for resources, directly impact shrimp aquaculture. This has prompted the search for mushroom-based alternatives that can provide both nutritional and functional benefits. Ensuring the resilience of aquaculture, therefore, requires the development of alternative, renewable, and functionally beneficial feed ingredients that provide essential nutrients while supporting animal health.
Soybean meal is the predominant plant-based protein source in aquafeeds, valued for its high protein concentration and well-balanced amino acid composition. However, its price volatility, land-use implications, and limited availability raise concerns over sustainability. Moreover, modern aquaculture diets are expected not only to meet nutritional requirements for growth and reproduction but also to enhance host immunity and resilience against stressors and pathogens.1 These challenges have prompted growing interest in alternative protein sources, including insect meals, algae, single-cell proteins, and mycoproteins, which can fulfill both nutritional and functional roles.2–4 This has led to the exploration of alternative proteins, including insect meals, algae, single-cell proteins, and fungal-derived proteins.
Mushrooms have recently gained attention as functional feed ingredients, offering high protein content (20-40%), essential amino acids, vitamins, minerals, and bioactive compounds.5,6 Beyond their nutritional value, mushroom-derived compounds exhibit immunomodulatory and prebiotic properties that can enhance gut microbial balance and host defense mechanisms.7,8 Recent aquaculture studies have demonstrated improved feed efficiency and immune responses in finfish and tilapia when mushroom-based substrates were incorporated into diets.9,10
Straw mushrooms (Volvariella sp.) were selected due to their local abundance, cost-effectiveness, and presence of bioactive polysaccharides (β-glucans, chitin) with immunomodulatory potential. Compared to other mushrooms, such as Lentinula edodes and Ganoderma lucidum, straw mushrooms offer comparable bioactive compounds while being more readily accessible in the Philippines. Their wide availability and low production cost further strengthen their suitability as candidates for aquafeed formulation. Shrimp physiology is highly sensitive to dietary protein sources and immune modulation, making Litopenaeus vannamei an ideal model for testing the effects of fungal proteins.
This study addresses a critical gap in evaluating mushroom-derived proteins within shrimp nutrition. The hypothesis tested was that straw mushroom-based myco-meal can partially replace soybean meal in Litopenaeus vannamei diets while supporting growth performance, feed utilization, and immune responses through its bioactive and prebiotic compounds. Moderate inclusion was anticipated to enhance gut microbial balance and hemocyte counts, whereas excessive substitution could impose metabolic trade-offs. These findings highlight the importance of optimizing inclusion levels to maximize nutritional and functional benefits while minimizing physiological costs.
Materials and Methods
Preparation of Myco-Meal and Experimental Diets
Freshly harvested straw mushrooms (Volvariella sp.) obtained from local farms in Carmen, Davao del Norte, were oven-dried at 65°C for 18-24h, ground, sieved through a 60μm mesh, vacuum-packed, and stored until use. Processing into powder extended shelf life while preserving essential amino acids.11
Five isonitrogenous diets were formulated at the Nutrition Laboratory, University of the Philippines Visayas, Miag-ao, Iloilo. The control diet contained soybean meal (42g/100g), while the experimental diets substituted soybean meal with myco-meal (straw mushroom) at 25%, 50%, 75%, and 100% replacement levels, designated as MM25, MM50, MM75, and MM100, respectively. All dried ingredients were sieved through a 150μm mesh, weighed, thoroughly mixed, pelleted, oven-dried at 60°C for 12h, and crumbled into appropriate pellet sizes. Diets were stored in airtight containers until use. The formulation and proximate composition of the experimental diets, including straw mushroom meal, are presented in Tables 1 and 2, respectively.
Experimental Shrimps and Rearing Conditions
Specific pathogen-free (SPF) Litopenaeus vannamei postlarvae (PL12) were obtained from a commercial hatchery located in Guimbal, Iloilo Province, Philippines. Shrimp were acclimated for seven days with ad libitum feeding prior to the experiment. Following acclimation, 20 post larvae were randomly stocked per 70-L tank, and outcome assessments (growth, hemocyte counts, microbial assays) were conducted under blinded conditions to minimize bias. Each tank was provided with continuous aeration and covered with mesh to prevent contamination and shrimp escape. Tanks were maintained in a recirculating seawater system equipped with mechanical filtration to ensure stable water quality within optimal ranges.
Water quality parameters (temperature, salinity, pH, dissolved oxygen, ammonia, and nitrite) were monitored daily using standard aquaculture probes and test kits. Values were maintained within optimal ranges for shrimp culture (temperature 27-29 °C; salinity 28-32 ppt; pH 7.8-8.2; dissolved oxygen>5 mg·L⁻¹; ammonia <0.05 mg·L⁻¹; nitrite <0.1 mg·L⁻¹).
Shrimps were fed their respective diets three times daily at 0800h, 1300h, and 1800h. The feeding rate was adjusted biweekly according to biomass, beginning at 20% body weight and gradually reduced to 10% toward the end of the trial. The feeding trial lasted 60 days. Mortality was recorded daily, and bulk weights were measured every 15 days to adjust feed accordingly.
Growth Performance and Feed Utilization
Estimation of growth performance and feed utilization provides a quantitative basis for comparing dietary treatments and determining the efficiency of nutrient conversion into biomass. These indices are widely applied in aquaculture nutrition studies to evaluate the biological and economic viability of experimental diets. Growth performance indices and feed utilization were calculated using the following equations:
WG (%) = Fw (g) - Iw (g) x 100
Iw (g)SGR (%) =ln Fw - ln Iw x100
Days of experimentPER = WG (g)
Pi (in decimal)FCE (%) = Live WG (g) x 100
Feed consumed (g)Survival (%) = TNMe x 100
TNMs
Note:
WG = Weight Gain
SGR = Specific Growth Rate
PER = Protein Efficiency Ratio
FCE = Feed Conversion Efficiency
Fw = Final weight
Iw = Initial weight
Pi = Protein intake
TNMe = Total no. of shrimp at the end of culture period
TNMs = Total no. of shrimp stocked
Proximate Composition and Nutrient Utilization
The proximate composition of the shrimp carcass, myco-meal, and test diets were analyzed using standard procedures of the Association of Official Analytical Chemists.12 Crude lipid content was determined following the method of Bligh and Dyer.13 Protein and lipid retentions in shrimp were subsequently calculated according to the formula described by Hardy and Barrows.14
NR (%) = CNCfinal - CNCinitial × 100
NI
where:
NR = Nutrient retention
CNCinitial = carcass nutrient content; initial
CNCfinal = carcass nutrient content; final
NI = nutrient intake during the feed trial
Physiological, Immunological, and Microbial Health Indices
To evaluate the effects of dietary treatments on shrimp health, representative indicators of physiological, immunological, and microbial status were measured. Blood glucose concentration was determined as a marker of metabolic response, total hemocyte count (THC) was measured to evaluate cellular immune activity, and lactic acid bacterial (LAB) count was analyzed to reflect intestinal microbial balance. Together, these parameters provide complementary insights into the overall health status of Litopenaeus vannamei under the experimental diets. The procedures for lactic acid bacterial count, total hemocyte count, and blood glucose determination are described below.
Lactic Acid Bacterial Count. Shrimp samples were transported to the laboratory, rinsed with sterile distilled water, and surface disinfected with 70% ethanol. The digestive tract was aseptically excised, homogenized in sterile saline solution, and subjected to ten-fold serial dilutions. From each dilution, a 0.1 mL aliquot was spread onto De Man-Rogosa-Sharpe (MRS) agar (TM Media, India) supplemented with 2% NaCl. Plates were incubated at room temperature for 48 h following the method of Vieira et al.15 LAB colonies were enumerated and expressed as log10 colony-forming units (CFU) per gram of tissue.
Total Hemocyte Count. Hemolymph was withdrawn from the ventral sinus of shrimp using a sterile 1 mL insulin syringe preloaded with chilled (4°C) anticoagulant solution (10 mM EDTA-Na₂, 45 mM NaCl, 10 mM KCl, 10 mM HEPES, pH 7.3) at a ratio of three parts anticoagulant to one-part hemolymph, as described by Traifalgar et al.16 A drop of fixed hemolymph was loaded onto a hemocytometer, incubated with Rose Bengal solution (1.2% in 50% ethanol) for 2 min to ensure consistent staining, and hemocytes were counted under a light microscope at low magnification.
Blood Glucose Concentration. Blood glucose concentration was assessed as a physiological indicator of shrimp metabolic response to dietary treatments, given that hemolymph glucose is a well-recognized marker of stress and nutritional status in crustaceans.17–19 Measurements were obtained using a human glucometer, a technique previously applied in crustacean studies. However, validation for shrimp hemolymph remains limited, and this limitation is acknowledged as a methodological constraint. Hemolymph was withdrawn from the ventral sinus using sterile 1 mL insulin syringes preloaded with chilled anticoagulant solution (10 mM EDTA-Na₂, 45 mM NaCl, 10 mM KCl, 10 mM HEPES, pH 7.3) at a ratio of three parts anticoagulant to one-part hemolymph, following Traifalgar et al.16
Hemolymph samples (100 µL) were collected from juveniles, ensuring volumes remained within safe physiological limits, and immediately placed on ice to minimize metabolic activity. For glucose determination, a drop of hemolymph was applied to disposable test strips compatible with the Glucoleader Value monitoring system. The glucose meter was calibrated prior to use, and each sample was analyzed in triplicate to ensure accuracy.
Statistical Analyses
All statistical analyses were performed using IBM SPSS Statistics for Windows, Version 27.0 (IBM Corp., Armonk, NY, USA). Data are presented as mean ± standard error of the mean (SEM). Prior to analysis, data were tested for normality (Shapiro-Wilk test) and homogeneity of variances (Levene’s test). One-way analysis of variance (ANOVA) was conducted to evaluate the effects of dietary treatments, with significance accepted at P<0.05. When significant differences were detected, Tukey’s honestly significant difference (HSD) test was applied for post-hoc multiple comparisons. In addition, polynomial regression analysis was employed to estimate the optimum dietary inclusion level of myco-meal based on specific growth rate (SGR).
Results
Growth Performance and Feed Utilization
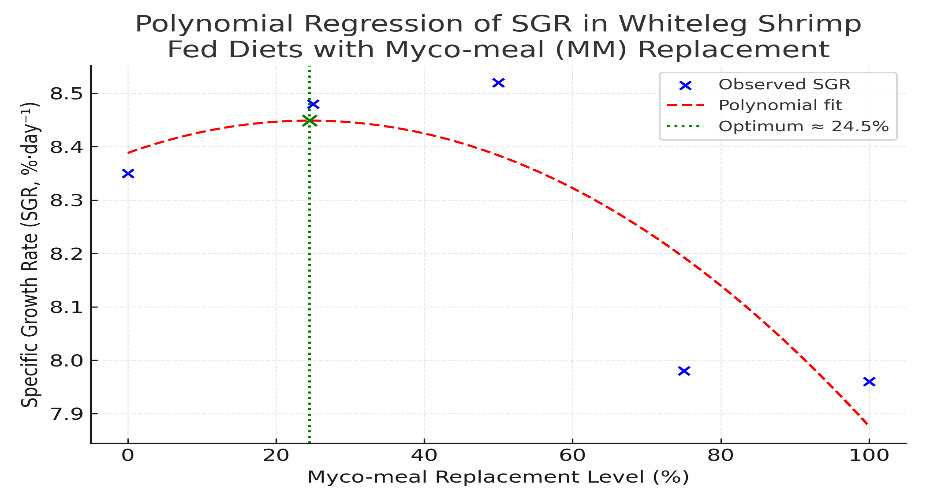
Shrimp fed diets with varying levels of myco-meal as a replacement for soybean meal (0-100%) exhibited significant differences in growth responses (Table 3). Weight gain (WG), specific growth rate (SGR), and feed conversion efficiency (FCE) were significantly higher (P<0.05) in shrimp fed MM25 and MM50 compared with the control and higher substitution groups. The polynomial regression of SGR values (Figure 1) showed a significant quadratic response to myco-meal inclusion, with the optimum replacement level estimated at approximately 48% (SGR=7.92+0.022x-0.00023x²; R²0.96). This aligns with the observed data, where the highest growth was recorded at MM50, followed by a decline at higher substitution levels (MM75 and MM100). No significant differences were observed in protein efficiency ratio (PER), feed intake (TFI), or survival (P>0.05).
_of_whiteleg_shrimp_fed_diets_with_myco-meal_(mm)_as_a_soybean_m.png)
Carcass Proximate Composition
The proximate composition of shrimp carcass biomass following the 60-day feeding trial is presented in Table 4. Crude protein content increased significantly (P<0.05) in MM25, MM50, and MM100 compared with the control. Crude lipid levels were not significantly different among treatments (P>0.05). Ash content tended to increase in MM25, MM50, and MM75, whereas moisture remained comparable across treatments. These results indicate that partial substitution with myco-meal supported improved carcass protein deposition without compromising lipid or ash balance.
Nutrient Retention
Protein and lipid retention patterns in shrimp fed experimental diets are summarized in Table 5. Crude protein retention was highest in MM100 (19.29%), followed by MM25 and MM50, although no significant differences (P>0.05) were detected among treatments. In contrast, crude lipid retention differed significantly (P<0.05), with MM25 showing the highest value (20.27%), while MM100 had the lowest (2.49%). These findings suggest that partial substitution improved lipid retention efficiency, whereas full substitution reduced it markedly.
Physiological, Immunological, and Microbial Health Indices
Dietary inclusion of Myco-meal significantly influenced shrimp health indices. As shown in Table 6, gut lactic acid bacteria (LAB) counts increased with higher levels of MM substitution, reaching the highest value at MM75 before declining at MM100. Total hemocyte count (THC) also increased progressively with increasing MM levels, with the highest at MM100. In contrast, blood glucose levels remained relatively stable in the control, MM25, and MM50 groups but declined significantly at MM75 and MM100, indicating a possible metabolic adjustment at higher substitution levels. Taken together, these results suggest that moderate MM inclusion enhances microbial and immune responses, whereas excessive substitution may impose metabolic costs on shrimp.
The elevated LAB counts at MM75 suggest that moderate to high levels of myco-meal may promote beneficial microbial proliferation in the shrimp gut, potentially enhancing digestive efficiency and competitive exclusion of pathogens. The progressive increase in hemocyte counts with higher MM inclusion indicates an immunostimulatory effect, consistent with the presence of bioactive compounds in fungal meals that can activate cellular defenses. Conversely, the decline in blood glucose at MM75 and MM100 may reflect increased metabolic demands or stress adaptation at higher substitution levels, suggesting that while immune and microbial benefits are evident, excessive replacement could alter energy homeostasis.
Discussion
This study demonstrated that partial replacement of soybean meal with myco-meal significantly affected growth, hemolymph parameters, and microbial health of L. vannamei. Polynomial regression indicated an optimum inclusion level of approximately 48-50%, consistent with the highest growth at MM50. Beyond this threshold, performance declined, suggesting that while MM is a functional protein source, excessive inclusion compromises nutrient utilization and metabolic balance.
Growth Performance and Nutritional Implications
The enhanced growth observed at moderate MM inclusion supports the hypothesis that fungal-derived proteins can provide a balanced amino acid profile and bioactive compounds that are beneficial for shrimp growth. Fungal meals are rich in essential amino acids, nucleotides, and cell wall polysaccharides such as β-glucans and chitin, which may contribute to improved nutrient utilization and immune stimulation (Li et al., 2008b; Traifalgar et al.16). Recent advances in fungal protein production, such as Enifer’s PEKILO®Aqua, have demonstrated that partial replacement of fishmeal or soybean meal with mycoproteins can enhance survival, growth, and health status in Litopenaeus vannamei under experimental and semi-commercial conditions.20 These findings align with the present study, where growth performance peaked at approximately 50% MM substitution, indicating that fungal proteins can serve as sustainable alternatives to conventional feed ingredients.
The decline in growth performance at higher inclusion levels (MM75 and MM100), however, highlights potential limitations. Performance decline may also involve other anti-nutritional factors such as nucleic acid overload, secondary metabolites, or mycotoxin traces. Without biochemical assays, causal mechanisms remain speculative. Palatability issues may also arise, as excessive fungal inclusion can alter feed texture and flavor, reducing feed intake. Similar trends have been reported in classical studies on yeast and fungal meals in aquafeeds, where moderate inclusion improved growth and immunity, but excessive replacement led to reduced performance.21,22 These findings suggest that while fungal proteins are promising, their optimal use requires careful balancing to avoid negative effects on growth efficiency. This highlights the importance of processing strategies (e.g., enzymatic hydrolysis, fermentation) to improve fungal biomass digestibility at higher inclusion levels.
From a sustainability perspective, the ability of MM to replace up to 50% of conventional protein sources without compromising growth is highly significant. Fishmeal remains a costly and environmentally constrained resource, and soybean meal production is associated with land use and ecological concerns. Incorporating fungal proteins into shrimp diets therefore contributes to reducing the ecological footprint of aquaculture while maintaining productivity.18–20
Immunological and Microbial Responses
Hemolymph analysis revealed a progressive increase in total hemocyte count (THC) with higher levels of MM inclusion, highest at MM100. This trend suggests a potential immunostimulatory effect, likely attributable to fungal cell wall components such as β-glucans, chitin, and mannoproteins, which are reported modulators of crustacean immunity.16 While these compounds are known to activate prophenoloxidase pathways and enhance phagocytosis, it should be noted that no biochemical or molecular assays were conducted in this study to confirm such mechanisms. Similar immunoenhancing effects have been reported in classical studies using yeast and fungal derivatives in aquafeeds, where β-glucans elevated hemocyte activity and disease resistance.23,24
Gut lactic acid bacterial (LAB) counts also increased with MM inclusion, reaching the highest levels at MM75 before declining at MM100. This pattern indicates that straw mushroom-derived myco-meal may serve as a prebiotic substrate, selectively stimulating beneficial microbial proliferation up to an optimal threshold. Recent reviews on fungal polysaccharides emphasize their prebiotic potential, noting that they can enhance the abundance of lactic acid bacteria and other beneficial taxa, thereby improving gut health and nutrient assimilation.25 Comparable findings in shrimp and fish nutrition have shown that dietary yeast or fungal supplements modulate gut microbiota composition, leading to improved growth and enhanced resistance against opportunistic pathogens.17–19 The decline in LAB counts at MM100, however, suggests that excessive inclusion of straw mushroom meal may disrupt microbial balance, possibly due to reduced digestibility or accumulation of indigestible cell wall fractions. The dose-dependent LAB response suggests that MM may act as a selective modulator of gut microbiota, but excessive inclusion risks dysbiosis.
Physiological Response: Blood Glucose
Blood glucose levels remained stable in control, MM25, and MM50 groups but declined significantly at MM75 and MM100. Hemolymph glucose is widely recognized as a sensitive indicator of stress and metabolic status in crustaceans, reflecting the balance between energy mobilization and utilization.17 The observed decline at higher MM inclusion levels may indicate increased metabolic demands associated with immune activation or reduced dietary energy availability due to the lower digestibility of straw mushroom biomass. This finding is consistent with classical observations that stressors or dietary imbalances can disrupt glucose homeostasis in shrimp, often leading to hypoglycemia under prolonged or excessive metabolic strain.26
Recent studies further support this interpretation. Shi et al.27 demonstrated that dietary modulation of glucose metabolism in Litopenaeus vannamei is highly sensitive to nutrient composition, with imbalances leading to oxidative stress and altered energy regulation. Similarly, Cheng et al.28 reported that environmental stressors such as salinity fluctuations impair shrimp disease resistance through AMP-activated protein kinase (AMPK) pathways, but that glucose availability plays a key role in maintaining energy homeostasis. The decline in glucose at MM75 and MM100 likely reflects a physiological trade-off, where energy is diverted toward immune activation and microbial modulation at the expense of circulating glucose.
This study has some limitations. Digestibility, amino acid balance, and potential anti-nutritional factors were not assessed, and stress biomarkers beyond hemolymph glucose were not measured. Feed intake was estimated rather than directly quantified, and future studies should address these gaps to strengthen the nutritional interpretation of straw mushroom meal in shrimp diets.
Conclusions
Dietary inclusion of myco-meal significantly influenced growth, immunity, microbial balance, and physiology in L. vannamei. Growth was optimized at approximately 50% substitution, supporting MM as a sustainable alternative to soybean meal. Moderate inclusion enhanced protein deposition, hemocyte counts, and gut LAB, while excessive levels reduced glucose homeostasis, indicating metabolic costs. These findings underscore the importance of optimizing inclusion levels to strike a balance between nutritional and functional benefits, while minimizing reliance on conventional protein sources. Importantly, the functional explanations provided here are potential interpretations supported by literature, as no molecular or biochemical assays were performed in this study.
Recommendations
-
Nutritional studies. Conduct detailed digestibility trials specific to straw mushroom meal, including amino acid utilization and enzyme activity assays, to clarify nutrient conversion pathways and improve efficiency at higher inclusion levels.
-
Immunological studies. Expand immune profiling beyond THC to include phenoloxidase activity, respiratory burst, and immune-related gene expression, ensuring mechanisms are validated rather than inferred.
-
Microbiome studies. Employ high-throughput sequencing to capture broader microbial community shifts and functional interactions beyond culturable LAB, focusing on the specific effects of straw mushroom meal.
-
Physiological studies. Assess additional biomarkers such as glycogen reserves, lipid metabolism, and oxidative stress indicators to provide a holistic view of energy regulation.
-
Applied research. Validate MM inclusion through long-term farm-scale trials under commercial conditions, coupled with techno-economic analyses to assess cost effectiveness and scalability.
-
Synergistic strategies. Explore combinations of MM with probiotics, prebiotics, or other functional additives to maximize both nutritional and health-promoting benefits in sustainable aquaculture feed production.
ACKNOWLEDGEMENTS
The authors sincerely thank the staff of the University of the Philippines Visayas Multi-Purpose Hatchery and the College of Fisheries and Ocean Sciences-Institute of Aquaculture (CFOS-IA) Laboratory for their invaluable technical support in sample preparation, processing, and data collection, as well as for maintaining optimal experimental conditions. This study was supported by the Department of Science and Technology (DOST) and the Commission on Higher Education (CHED) K to 12 Scholarship Program.
AUTHOR CONTRIBUTIONS
Investigation: Cyril Tom B. Ranara (Lead). Conceptualization: Cyril Tom B. Ranara (Lead), Rex Ferdinand M. Traifalgar (Equal). Formal Analysis: Cyril Tom B. Ranara (Lead), Rex Ferdinand M. Traifalgar (Equal), Ludevito S. Batilong (Equal). Writing – original draft: Cyril Tom B. Ranara (Lead). Writing – review & editing: Cyril Tom B. Ranara (Lead), Rex Ferdinand M. Traifalgar (Supporting). Methodology: Rex Ferdinand M. Traifalgar (Lead), Ludevito S. Batilong (Equal), Sharon N. Nuñal (Equal), Jose P. Peralta (Equal), Liberato V. Laureta (Equal).
COMPETING INTEREST
The authors state that there are no conflicts of interest associated with this research.
ETHICAL CONDUCT
All experimental procedures were conducted in accordance with internationally recognized standards for the humane treatment of research animals. Euthanasia was performed through rapid cooling followed by immersion in ice-chilled water, following the American Veterinary Medical Association29 Guidelines for the Euthanasia of Animals for small-bodied fishes. This method is widely accepted as humane for aquatic species and, under applicable regulations, did not require institutional ethical clearance or certification.
INFORMED CONSENT STATEMENT
All authors and their affiliated institutions have reviewed and approved the final version of this manuscript for publication.
DATA AVAILABILITY STATEMENT
The data supporting this study are confidential and managed in compliance with relevant privacy and ethical guidelines.