INTRODUCTION
Biofloc technology (BFT) is commonly used in intensive aquaculture to maintain water quality and provide an additional protein source for fish, thereby enhancing growth.1–4 An efficient BFT system aggregates microorganisms and other organic particles suspended in water, achieving a subtle balance between converting nutrient waste into microbial biomass.5–7 Controlling inorganic nitrogen by manipulating the carbon-to-nitrogen ratio is a potential control method for aquaculture systems.8 When the ratio of carbon to nitrogen is well balanced in a culture system, heterotrophic bacterial proliferation is promoted, and nitrogen is taken up through the production of microbial proteins (including bacteria, microalgae, protozoa, and other organic detritus), which can be further consumed by aquatic animals.9 These bioflocs serve a dual purpose: they function as an in-situ biofilter, maintaining water quality, and they can be consumed by the cultured animals as a nutrient-rich supplemental feed, potentially improving feed utilization and growth performance.6,10
The carbon/nitrogen (C/N) ratio is a critical operational parameter in BFT systems. A low C/N ratio (typically <10) favors the growth of slow-growing autotrophic nitrifying bacteria, which oxidize ammonia to nitrate. In contrast, a high C/N ratio (>15) promotes the proliferation of fast-growing heterotrophic bacteria that assimilate ammonia directly into cellular protein.8,11 Therefore, optimizing the C/N ratio is essential for effectively managing nitrogenous waste and shaping the microbial community within the system. Numerous studies have investigated the effects of different C/N ratios on various aquaculture species. For Pacific white shrimp (Litopenaeus vannamei), optimal C/N ratios ranging from 15:1 to 20:1 have been reported to enhance growth, improve water quality, and modulate gut and water microbial communities.3,4,12 Similarly, for Nile tilapia (Oreochromis niloticus), a C/N ratio of 15~20:1 has been shown to be beneficial for growth and immune response.13,14 The growth of the microbiome can be stimulated by adding carbon-rich substrates to raise the C/N ratio to >15/1.8 To date, much remains unknown about the effects of searching for an optimal C/N ratio on crucian carp growth performance, water quality, and the crucian carp’s microbial community cultured in a biofloc system.
Crucian carp, Carassius auratus, is an omnivorous freshwater fish distributed across Asia, Europe, and North America, and is one of the main freshwater aquaculture species in China. Among traditional polycultures in China, C. auratus prefers the bottom of the water and eats detritus as its main food.2 The detritus is composed of bacteria, protozoa, metazoans, grass fragments, and feces, with a structure and function similar to biofloc.12,15 Wang et al. provided foundational knowledge by demonstrating that manipulating the C/N ratio in zero-water-exchange tanks could significantly improve water quality (reducing TAN and nitrite) and that supplementing feed with dried bioflocs enhanced the growth performance of crucian carp.2 However, their study did not investigate the microbial community structure within the bioflocs themselves—the very engine driving these water quality improvements. Understanding how different C/N ratios shape the biofloc microbial community is crucial, as these microorganisms are directly responsible for nitrogen transformations16 and can profoundly influence fish health through the production of bioactive compounds, competitive exclusion of pathogens, and modulation of digestive enzyme activity.1,17,18
Therefore, the present study was conducted with the following hypotheses: (1) increasing the C/N ratio from 8:1 to 18:1 and 22:1 will improve water quality by reducing the accumulation of toxic inorganic nitrogen species (TAN and NO₂⁻-N); (2) these different C/N ratios will significantly alter the structure, diversity, and composition of the biofloc microbial community; and (3) these changes in the microbial community will, in turn, affect the growth performance and survival of crucian carp. By testing these hypotheses, we aim to provide a scientific basis for optimizing C/N ratios in BFT systems for crucian carp culture and to elucidate the microbial mechanisms underlying system performance.
MATERIALS AND METHODS
MATERIALS
Healthy Carassius auratus of similar size were chosen. The initial body weight and body length of the fish were 56.60 ± 0.65 g. Before the experiment, the fish were fed a basic diet for 7 days to adapt to the environment and the feed. Crucian carp pellet feed with 30% crude protein was used as the basic feed (C/N 8:1). Nutrients in the feed consisted of 30% crude protein, 3% crude fat, 10% crude fiber and 13% crude ash. The mean nitrogen content was 5.45% of feed dry matter, and the mean carbon content was 45.47% of feed dry matter (Elementar Vario EL III, Germany). In experiments, glucose monohydrate (C6H12O6H2O, 99% purity, 36.0% C content) was used as the exogenous carbon source to add to the culture water. The control group was fed with basic feed, and the experimental groups were fed basic feed and added glucose, according to the method of Avnimelech,8 with the C/N ratios adjusted to 8:1 (group A), 18:1 (group B) and 22:1 (group C), respectively.
EXPERIMENT MANAGEMENT
The study was conducted at the Fisheries Science Research Center, College of Aquatic Sciences, Xinyang Agriculture and Forestry University. Nine 1.0 m3 circular polyester resin tanks (1.5 m in diameter) were used indoors. Thirty fish were stocked in each tank, and the experiment was run in triplicate.
The study lasted 30 days. In the experiment, fish were fed twice daily at 7:00 am and 7:00 pm (UTC+8). Based on different C/N ratios, glucose was added 2 h after feeding to maintain the ratios in each group.
During the entire culture period, water was maintained at a temperature of 25–30 °C and pH of 7.0–8.5, with the tanks aerated continuously to maintain a DO of above 5 mg/L. There was no water exchange throughout the experimental period; however, a sufficient amount of fresh water was supplied to compensate for water loss due to evaporation and for water quality measurements.
FEED INTAKE MONITORING AND UNEATEN FEED RECOVERY
During the 30-day feeding trial, fish in all tanks were fed to apparent satiation twice daily at 7:00 am and 7:00 pm. Apparent satiation was determined when fish no longer actively approached the water surface to consume feed, and no feed pellets remained on the water surface within 30 min after feeding.
To accurately determine feed intake, uneaten feed and feces were collected 1 h after each feeding using a siphon method. The collected material was allowed to settle, and the supernatant was carefully discarded. The settled residue was then transferred to a Petri dish, and uneaten feed pellets were manually separated from feces under a magnifying lens. The separated feed pellets were rinsed gently with distilled water to remove salt and debris, then dried at 65 °C for 24 h to constant weight.
The actual feed consumed (g) for each tank was calculated as:
Feed consumed (g) = Feed offered (g) – Uneaten feed recovered (g) (dry weight basis)
The Feed Conversion Ratio (FCR) was then calculated using the actual feed consumed, as described in Section “Growth and Physical Indicators”.
MEASUREMENT INDICATORS AND METHODS
GROWTH AND PHYSICAL INDICATORS
At the end of the experiment, the fish were not fed for 24 h. They were then collected, and the total weights of fish in each tank were measured, and specific growth rate (SGR), feed conversion ratio (FCR) and survival rate (SR) were calculated as per the following equations:
Specific growth rate (SGR): SGR = [(ln W2 - ln W1)/ (t2 - t1)] × 100
Feed conversion ratio (FCR): FCR = feed consumed (kg)/ fish biomass increase (kg)
Survival (%) = 100 (Nf-Ni)/ Ni
where W1 and W2 are the weights at times t1 and t2 (first and last days of the experiments, respectively), n is the number of fish, F is the weight of total feed (g), Ni is the initial number of fish, and Nf is final number of fish.
WATER QUALITY
Water temperature, pH, and DO were measured at 7:00 am every day, and ammonia nitrogen, nitrite nitrogen, nitrate nitrogen, and total nitrogen were measured every 4 days. Temperature and DO were determined using an optical dissolved oxygen meter (YSI Pro ODO, Yellow Spring Instruments, Ohio, USA), and pH value was measured using a pH meter (PSH-3C, INESA Instrument, Shanghai, China). Concentration of ammonia nitrogen in the culture water was measured using Nessler reagent colorimetric determination, concentration of nitrite was measured using naphthylethylenediamine spectrophotometry, concentration of nitrate nitrogen was determined using ultraviolet spectrophotometry by measuring light absorption value at 220 nm to confirm nitrate nitrogen in accordance with Water and Wastewater Monitoring Analysis, and concentration of total nitrogen was analysed using alkaline potassium persulfate digestion ultraviolet spectrophotometry (State Environmental Protection Administration of China, 2002). The water samples’ detection of TAN, nitrite, and nitrate was taken after 0.45 μm membrane filtration. Biofloc volume (FV-15min) was determined every 7 days using an Imhoff cone, following the method of Pinho et al (2017).19
MICROBIAL DETECTION
Water samples containing bioflocs were taken at the end of 30 days of experimentation, and all samples were filtered through a 0.22 μm sterilized membrane. The membranes were stored at -80℃. Total microbial genomic DNA was extracted from bioflocs samples using the E.Z.N.A.® soil DNA Kit (Omega Bio-tek, Norcross, GA, U.S.) according to manufacturer’s instructions. The quality and concentration of DNA were determined by 1.0% agarose gel electrophoresis and a NanoDrop2000 spectrophotometer (Thermo Scientific, United States) and kept at -80 ℃ prior to further use. The hypervariable region V3-V4 of the bacterial 16S rRNA gene were amplified with primer pairs 338F (5’-ACTCCTACGGGAGGCAGCAG-3’) and 806R(5’-GGACTACHVGGGTWTCTAAT-3’) by T100 Thermal Cycler PCR thermocycle (BIO-RAD, USA). Purified amplicons were pooled in equimolar amounts and paired-end sequenced on an Illumina Nextseq2000 platform (Illumina, San Diego, USA) according to the standard protocols by Majorbio Bio-Pharm Technology Co. Ltd. (Shanghai, China). Prior to analysis, the integrity of all downloaded sequencing files was verified using the MD5 checksum method to ensure data completeness and absence of corruption during transmission. Taxonomic annotation of each representative OTU sequence was performed against the SILVA 16S rRNA database (Release 138) using the RDP Classifier (version 2.11) with a confidence threshold of 0.7. Operational taxonomic units (OTUs) were clustered with 97% similarity cutoff. All bioinformatics analyses were conducted on the Majorbio Cloud Platform (www.majorbio.com).
STATISTICAL ANALYSIS
The data obtained from this study were analyzed using SPSS (version 22.0 for Windows) and Excel 2019. Furthermore, the independent sample t-test was conducted to evaluate the results of water parameters, fish growth performance and microbial structures in different treatments at a significance level of p-value < 0.05. All experimental values were stated as Means ± Standard Deviations (Mean ± SD). Artworks were performed through Origin 2018.
RESULTS
GROWTH PERFORMANCE OF CARASSIUS AURATUS
The growth performance of Carassius auratus was summarized in Table 1. Obviously, final mean weight and SGR were significantly higher in group C than in group B (P< 0.05), while FCR was significantly higher in experimental groups than in group A (P< 0.05), nevertheless, the higher SR was found in group A (P< 0.05).
WATER QUALITY VARIATION DURING CULTIVATION
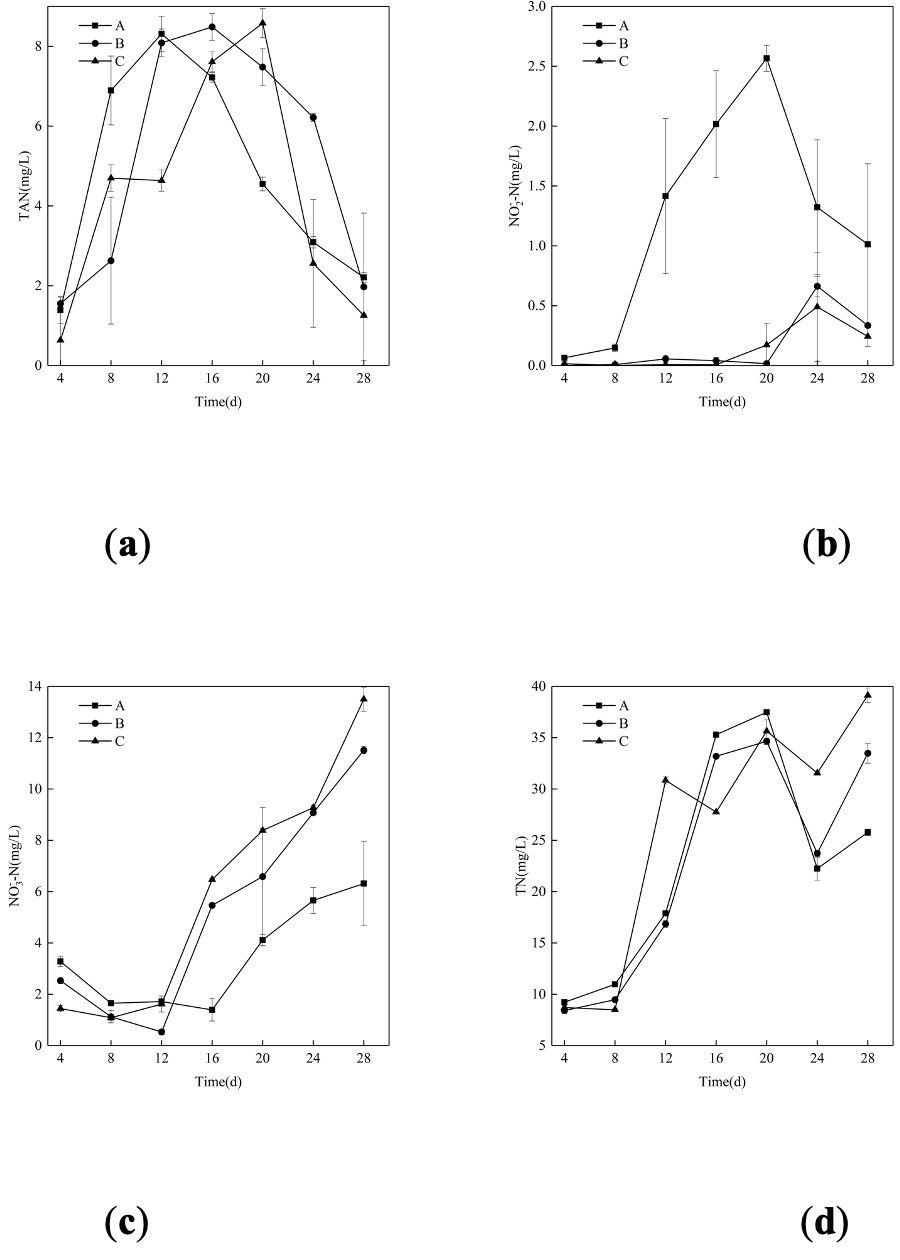
Fig. 1 shows the variations in N compounds in bioflocs across different C/N ratios over 30 days of cultivation. The TAN contents in both the control and experimental groups showed an initial increase followed by a decrease, there was no significant difference among the three groups at the end of the experiment (p>0.05) (Fig. 1a). The NO2--N in the experiment groups changed consistently and both returned to near 0 level ultimately, while the nitrite concentration in the control group showed considerable variation (Fig. 1b). For NO3--N in all groups assumed an upward trend throughout the course of the experiment except for a slight decline between day 8th to 12th (Fig. 1c). TN in three groups exhibited a consistent increasing trend till the end of the experiment except a decline between day 20th to 24th (Fig. 1d). Biofloc volume (FV-15min) was monitored throughout the experiment; it increased from an initial value of 2.85 ml/L to a peak of 37.66 ml/L, then decreased and stabilized at approximately 28.00 ml/L by the end of the 30-day culture period.
_(a)__nitrite_(b)__nitrate_(c)__and_total_nit.png)
BIOFLOC MICROBIAL COMMUNITY ANALYSIS
BACTERIAL DIVERSITY
The indices describing the diversity of microbial communities through Shannon, Ace, and Chao1 are presented in Table 2. The Shannon index, which measures microbial diversity, was highest in the C (3.35 ± 0.49) and B (3.36 ± 0.42) groups, indicating greater diversity than in the A group (2.62 ± 0.33). The Simpson index, reflecting community dominance, was similarly low in the C (0.10 ± 0.05) and B (0.09 ± 0.03) groups, suggesting a more even distribution of microbial species, whereas the A group showed a slightly higher Simpson index (0.22 ± 0.05), indicating a more dominant species presence. The Ace and Chao1 indices, which estimate species richness, were also higher in the C (476.80 ± 135.11 and 463.24 ± 134.05, respectively) and B (439.92 ± 129.63 and 425.23 ± 124.16, respectively) groups compared to the A group (408.62 ± 62.38 and 399.50 ± 59.56, respectively). These results suggest that both the C and B treatments supported a more diverse, species-rich microbial community than the A group. The coverage for all groups was 1.0, indicating comprehensive sequencing depth and reliable community representation.
DISTINCT BACTERIAL COMPOSITION OF BIOFLOCS
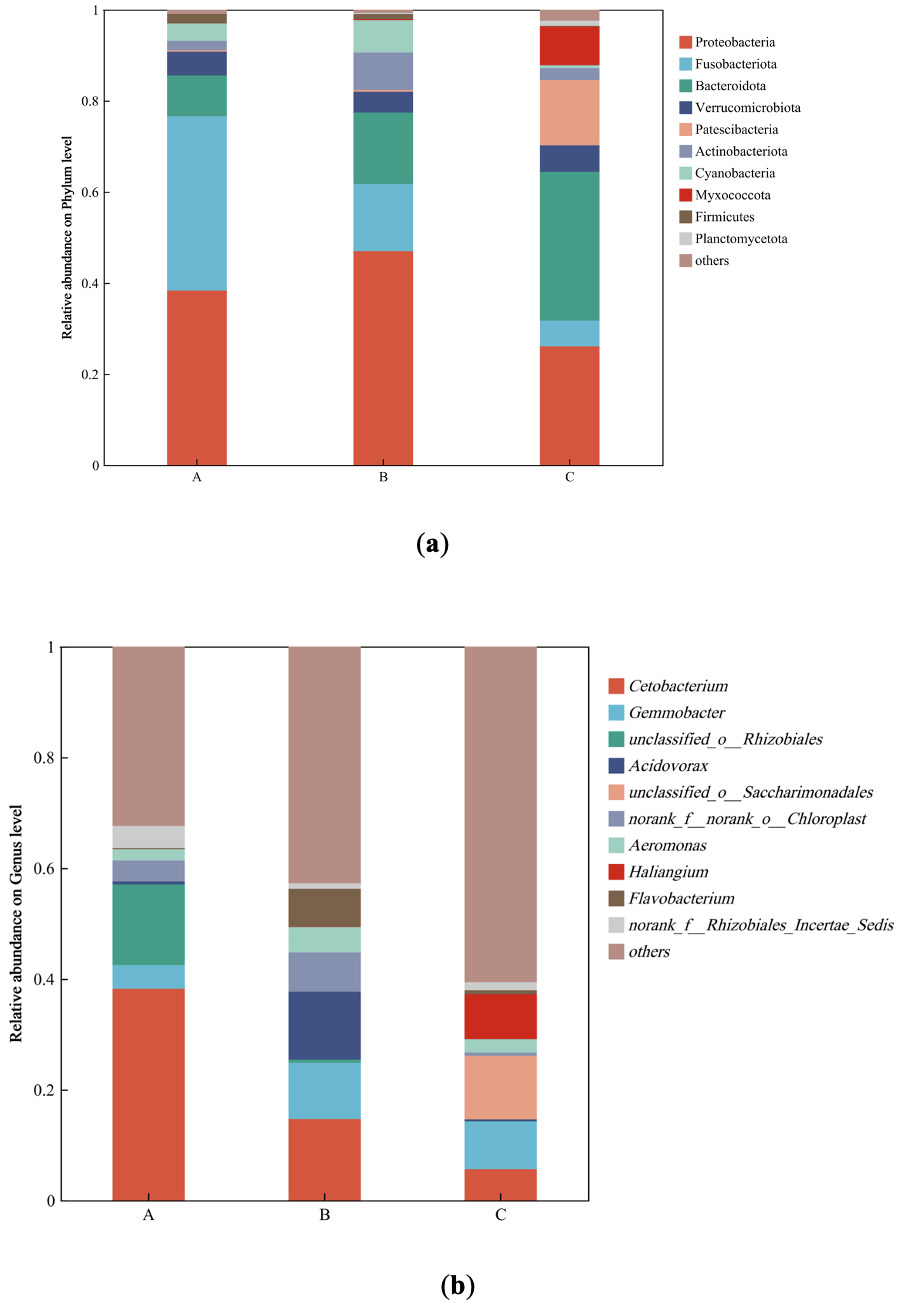
The dominant phyla and genera of different bioflocs on day 30th were presented in Fig. 2. The phyla Proteobacteria, Bacteroidota, and Fusobacteriota were the dominant phyla shared among the three groups, but their relative abundance varied across groups. The relative abundance of Proteobacteria was highest in Group B at 50.7%, which was 13.3% and 12.4% higher than that in Group C and Group A, respectively. Bacteroidota was most abundant in Group C at 29.9%, exceeding Group B and Group A by 9.9% and 20.9%, respectively. In contrast, Fusobacteriota showed the highest relative abundance in Group A at 38.2%, which was 27.6% and 29.8% higher than that in Group B and Group C, respectively. Additionally, the abundance of Acidobacteriota in Group B was relatively high at 7.9%. Unique phyla in Group C included Patescibacteria and Myxococcota, with relative abundances of 8.7% and 4.3%, respectively. It is worth noting that Cyanobacteria was relatively abundant in Group A and Group B, accounting for 3.8% and 4.1%, respectively, while it constituted only 0.5% in Group C. Cetobacterium was the dominant genus shared among Groups A, B, and C in this study. Its relative abundance was highest in Group A at 38.2%, exceeding that in Group B and Group C by 27.6% and 29.8%, respectively. The abundance of Bacteroides in Group A was 4.7%, which was 3.9% and 3.5% higher than that in Group B and Group C, respectively. The dominant genera in Group B were Aeromonas, Acidovorax, Runella, and Shinella. Among these, Aeromonas had the highest relative abundance at 7.2%, which was 4.8% and 5.1% higher than that in Group A and Group C, respectively. The relative abundance of Acidovorax was 7.6%, exceeding that in Group A and Group C by 7.0% and 5.5%, respectively. In Group C, the dominant genera were Flavobacterium and Sphaerotilus. The relative abundance of Flavobacterium was relatively high at 6.6%, which was 3.0% and 6.4% higher than that in Group B and Group A, respectively. The relative abundance of Sphaerotilus was highest at 8.9%, exceeding that in Group B by 7.4%, while it was undetected in Group A. The genus Gemmobacter showed relatively high abundance in Group B and Group C, at 11.1% and 12.5%, respectively, whereas its abundance in Group A was only 4.3%. The dominant genera in Group A were Cetobacterium and Bacteroides.
_microbial_community_structure_on_phylum_lev.png)
DISCUSSION
Biofloc technology has demonstrated positive results in the aquaculture of various aquatic species such as Litopenaeus vanname,4,20 Oreochromis niloticus,14 Carassius auratus,21 Mugil cephalus,22 Rhamdia quelen,23 Clarias gariepinus.24 In this study, a key finding regarding growth performance was that the high C/N ratio group C achieved a final mean weight and Specific Growth Rate (SGR) that were statistically comparable to those of the control and significantly higher than those of the intermediate C/N group B. This suggests that a C/N ratio of 22 was more effective than 18:1 in promoting growth within the BFT system. By regulating the C/N ratio, the biofloc system fostered a more conducive microbial community structure and enhanced nutrient recycling in the water column. This established an optimal growth environment that directly supported enhanced growth and weight gain in crucian carp. This study confirms findings from earlier research on Litopenaeus vannamei10 and Clarias gariepinus,24 demonstrating that the addition of an external carbon source significantly increases the weight gain rate and specific growth rate of farmed fish. However, this benefit came with significant trade-offs. However, the significantly higher Feed Conversion Ratio (FCR) values in Groups B (1.80 ± 0.19) and C (1.53 ± 0.07) compared to the control (1.32 ± 0.10) warrant critical analysis. This elevated FCR represents a well-documented trade-off in carbon-supplemented BFT systems.8,11 Mechanistically, this can be explained by the partitioning of organic carbon and nitrogen between two competing pathways: direct assimilation into fish biomass versus incorporation into the microbial loop. When exogenous carbon (glucose) is added to achieve high C/N ratios, heterotrophic bacterial growth is stimulated. These bacteria assimilate ammonia-nitrogen into microbial protein, effectively diverting a portion of the feed-derived nitrogen away from the fish and into biofloc biomass.11,25 This microbial protein synthesis, while beneficial for water quality, represents an energetic cost that manifests as increased FCR.
The dynamics of nitrogenous compounds provide critical insights into the functionality of the biofloc systems.2 The characteristic initial rise and subsequent decline in Total Ammonia Nitrogen (TAN) observed in all groups signal the establishment of nitrification.26 Crucially, the lack of significant difference in TAN concentrations by the end of the experiment, despite the zero-water-exchange regime, underscores the efficacy of the biofloc systems in controlling this primary toxicant.27–29 The consistently low and stable nitrite (NO₂⁻-N) levels in the BFT groups throughout the experiment, in contrast to the considerable fluctuation in the control, suggest that a more robust and stable nitrification process was established in the carbon-amended tanks. The overall increasing trend in Total Nitrogen (TN) was expected in these closed systems, reflecting the continuous nitrogen input from feed.30 The observed FV-15min dynamics—an initial increase followed by stabilization—are consistent with typical biofloc maturation patterns in zero-exchange systems.26 The peak value of 37.66 mL/L and subsequent stabilization at approximately 28 mL/L fall within the recommended range (10~50 mL/L) for biofloc systems,19 confirming that the system functioned optimally. However, due to equipment limitations at the time of the experiment, additional parameters such as total suspended solids (TSS), volatile suspended solids (VSS), and floc particle size were not measured. Future studies should include these parameters for a more comprehensive characterization of biofloc dynamics and strengthen the link between C/N ratio manipulation and system performance.
The microbial community analysis revealed profound structural and compositional shifts driven by the C/N ratio. The significantly higher Shannon index and lower Simpson index in Groups B and C indicate a more diverse and evenly distributed bacterial community compared to the control (Group A).31 Enhanced microbial diversity is often correlated with greater ecosystem stability and functional resilience in aquaculture systems,32,33 potentially explaining the more stable water quality observed in these groups.
At the phylum level, the high relative abundance of Fusobacteriota (dominated by the genus Cetobacterium) in Group A is typical of systems relying on the intrinsic decomposition of fish waste and uneaten feed.34 Cetobacterium is known for its fermentative metabolism, producing short-chain fatty acids that may benefit fish health.35 In contrast, the BFT groups exhibited a marked increase in Proteobacteria and Bacteroidota, key phyla involved in heterotrophic assimilation of ammonia and biofloc formation.35–37 The particularly high abundance of Bacteroidota in Group C (29.9%) is notable, as this phylum is renowned for degrading complex organic matter,38 potentially contributing to the more favorable growth performance in this group.
At the genus level, microbial composition provides a plausible explanation for the observed environmental and performance outcomes. The dominance of Cetobacterium in Group A aligns with a conventional, non-BFT system.39 The emergence of genera like Aeromonas (a genus containing potential pathogens) and Acidovorax in Group B is intriguing and may have contributed to the reduced survival observed in this group.40 The proliferation of Aeromonas specifically in Group B (C/N 18:1) suggests that this C/N ratio created an ecological niche that favored this taxon. This finding aligns with studies showing that Aeromonas can be enriched in certain biofloc environments36 and may explain the significantly lower survival rate observed in Group B (86.42%). The microbial profile of the best-performing Group C was distinct, characterized by a high abundance of Flavobacterium—known for degrading organic compounds and contributing to water quality1—and Sphaerotilus, which forms sheathed structures fundamental to biofloc aggregation.38 The high abundance of Gemmobacter in both BFT groups further supports the presence of active heterotrophic metabolism.41 From a biosecurity and sustainability perspective, these findings have profound implications. They demonstrate that C/N ratio manipulation is not merely a tool for water quality control, but also a powerful lever for shaping the microbial community to enhance fish health and reduce disease risk.
Conclusions
In conclusion, manipulating the C/N ratio to 22 through glucose addition successfully established a functional biofloc system for Carassius auratus culture, as evidenced by effective ammonia control and the development of a diverse microbial community. While growth in Group C was competitive with the control, the associated increase in FCR and the significant decrease in survival present major challenges. Therefore, optimizing the C/N ratio is critical to maximize the water quality and growth benefits of BFT while mitigating its negative impacts on feed efficiency and fish survival. From a mechanistic perspective, this study establishes critical links between operational parameters (C/N ratio), microbial community dynamics, and system-level outcomes. The findings underscore that BFT optimization requires balancing the water quality benefits of high C/N ratios against their negative impacts on feed efficiency and survival.
For commercial application, these results provide a practical target (C/N 22:1) for farmers, while highlighting the need for comprehensive economic analyses that account for feed costs, water savings, disease mitigation, and the nutritional value of bioflocs. Future research should focus on identifying the causes of mortality in high C/N systems and exploring the nutritional contribution of the bioflocs to the fish’s diet to better evaluate the overall economic and zootechnical feasibility of BFT for crucian carp.
Acknowledgements
The authors thank Majorbio Bio-Pharm Technology Co. Ltd. (Shanghai, China) for helping in transcriptomic analysis. This research was funded by Natural Science Foundation of Henan (Grant number 252300421681); the Aquatic Seed Industry Research Project in Henan Province; the Investigation of Aquatic Biodiversity and Environmental Conditions in Key Waters of Henan Province.
Author Contributions
Conceptualization: Chenxi Tan (Equal), Zhiguo Hu (Equal). Writing – original draft: Chenxi Tan (Lead). Methodology: Feng Zhu (Lead). Visualization: Feng Zhu (Lead). Software: Chenxi Ju (Lead). Supervision: Chenxi Ju (Lead). Validation: Lanlan Zhao (Equal), Miaomiao Cao (Equal), Yuyan Liu (Equal). Formal Analysis: Jialu Xue (Lead). Project administration: Jialu Xue (Lead). Data curation: Kunjie Wu (Lead). Investigation: Jiahui Liu (Lead). Writing – review & editing: Jiahui Liu (Lead). Resources: Xusheng Guo (Lead). Funding acquisition: Xusheng Guo (Lead).
Ethical Statement
The study protocol was approved by the Ethics Committee of Xinyang Agriculture and Forestry University (protocol code: XYNL-2025-0013; approval date: 13 March 2025), and followed the legal requirements or guidelines in China for the care and use of animals.
Conflict of Interest
The authors declare that they have no known competing financial or non-financial, professional, or personal conflicts that could have appeared to influence the work reported in this paper.
Informed consent statement
All authors and institutions have confirmed this manuscript for publication.