
Introduction
Aquaculture and catch fisheries collectively employ nearly 40 million people worldwide. This sector is essential to maintaining global food security in addition to providing coastal populations with a means of subsistence. Overfishing and ecological stresses are now the two main problems facing global fisheries resources. The Food and Agriculture Organization of the United Nations (FAO) has proposed the “Blue Transition” approach, which promotes the synergistic growth of social and economic benefits under the premise of ecological sustainability, aiming to create sustainable change. As the largest fishing country in the world, China’s excellent fisheries development is strategically important for achieving stable economic growth and the sustainable use of marine resources.
The guiding concept of the new era is high-quality development, and Total Factor Productivity (TFP) is the primary statistic used to assess the potential for corporate development and the quality of economic growth. The crucial issue facing both countries and businesses is how to shift growth drivers through innovation and efficiency improvements, as the marginal advantages of traditional factor-driven models decline. This problem is especially severe for the fishing industry: the extensive model, which depends on labor and capital development, is unsustainable due to tighter resource restrictions, rising production costs, and inadequate supply chain resilience. Fishery production is highly dependent on natural resources, characterized by a long supply chain, high sensitivity to natural conditions, and perishable products. This renders it particularly vulnerable amid current global uncertainties, including shifting geopolitical dynamics, intensifying climate anomalies, and frequent adjustments to trade policies. Any disruption in any supply chain link could ripple through the entire chain, potentially causing production halts, inventory depletion, or market failures, ultimately eroding corporate efficiency and competitiveness. In light of this, increasing TFP is not only a crucial strategy for fishing businesses to boost their competitiveness, but it is also a necessary option for creating a contemporary fishing system and incorporating into the framework of global sustainable governance.
Global supply chain risks have increased significantly in recent years due to market volatility, extreme weather conditions, and geopolitical crises. In addition to directly interfering with corporate operations,1 these disruptions also have systemic consequences through their impact on network architecture.2 Chinese fishing companies are particularly vulnerable to supply chain disruptions due to the long-chain nature of their operations, which include hatcheries, aquaculture, cold chain logistics, and export. However, an organization’s risk perception capability—that is, management’s capacity to see and anticipate possible disruptions and uncertainties—is what actually affects efficiency, not risk itself. By proactively adjusting demand projections, preventing unreasonable expansion, and optimizing inventory turnover, this cognitive ability helps businesses turn external uncertainty into catalysts for internal efficiency gains.
Academic attention to this problem is still lacking, despite the fact that several major companies (like CNFC’s overseas fisheries business) have improved supply chain resilience by developing “industry + risk perception” collaborative platforms. Existing studies focus on technical efficiency or macro-policy effects in fisheries, neglecting the micro-level mechanisms and the pivotal cognitive variable of supply chain risk perception. This study examines how risk perception influences the TFP of China’s listed fisheries firms through management behavior, aiming to fill this gap.
TFP research predominantly centers on manufacturing, relying on assumptions of continuous processes and flexible adjustments less applicable to fisheries. Fisheries face inherent volatility due to natural conditions, perishable products that require precise cold-chain logistics, and long, regulated cross-border value chains. Applying generic TFP frameworks risks overlooking these unique risk-efficiency dynamics.
Within supply chain management, risk perception is recognized as a critical subjective assessment.3 Text-analysis methods now capture this forward-looking cognition from corporate reports,4 revealing its potential to drive strategic initiatives, such as innovation collaboration.5 However, this literature rarely examines the high-risk, regulated fisheries context, and the specific behavioral pathways from perception to efficiency remain empirically untested.
Fisheries efficiency studies have identified drivers like ESG performance6 and capital allocation issues.7 Yet, they omit the dynamic cognitive process of risk perception that precedes and shapes strategic and operational decisions in uncertain environments.
This study’s marginal contributions are threefold: First, it quantifies proactive supply chain risk perception using textual analysis, shifting the perspective from passive response to strategic cognition. Second, it integrates this cognitive variable into fisheries TFP research, addressing the theoretical gap in “efficiency sources” for resource-based, high-uncertainty industries. Finally, it constructs and tests a “Cognition-Strategy-Operations” mediation model, systematically explaining how risk perception enhances TFP by reducing demand uncertainty, curbing strategic overreach, and improving inventory turnover. This provides novel micro-evidence on the risk perception-efficiency link in fisheries, responding to calls for research on supply chain information and firm resilience.
Literature review
It has long been believed that Total Factor Productivity (TFP), a key indicator of the quality of economic development and the effectiveness of resource allocation, is a composite of management skills, institutional optimization, and technical advancement. According to neoclassical growth theory, TFP represents the percentage of production growth that cannot be attributed to conventional factor inputs, such as labor and capital.8 TFP takes on deeper meanings when viewed through the lens of endogenous growth theory; it represents not just technological innovation but also human capital accumulation, institutional environment improvement, and increased organizational efficiency.9,10 Enhancing TFP has become a crucial route for creating new productive forces as China’s economic development has shifted from high-speed growth to high-quality development in recent years. The significance of total factor productivity has increased, particularly in the fishing industry, which is characterized by severe ecological constraints, substantial market volatility, and a heavy reliance on resources. Fisheries production is a classic resource-based industry that is highly dependent on external supply chains and natural conditions. In recent years, escalating global uncertainties—including climate-induced fluctuations in aquaculture environments, trade barriers stemming from geopolitical tensions, and sudden public health crises—have further exacerbated the inherent vulnerabilities of the fisheries supply chain. While some studies have begun examining the impact of external shocks on the fisheries economy, most remain confined to macro-level analyses or isolated case studies, failing to delve into the cognitive and behavioral response mechanisms at the enterprise level. This presents two challenges to TFP improvement: on the one hand, ecological carrying capacity and the non-renewable nature of natural resources limit widespread expansion; on the other hand, global trade barriers, stricter food safety regulations, and increased geopolitical risks increase market uncertainty. In light of this, it is no longer viable to rely just on growing aquaculture areas or intensifying fishing. The sector has to adopt an organic growth model that is efficiency-driven. After examining data from Chinese listed fisheries companies between 2009 and 2021, Liu et al.6 discovered that ESG performance greatly increases TFP in the fishing industry, mostly by encouraging technical innovation. This suggests that TFP in fisheries incorporates the deeper logic of sustainable growth and regulatory compliance in addition to reflecting techno-logical efficiency. Li7 adds that although the majority of listed fishing firms have financing capability and low debt-to-asset ratios, their short operational cycles and poor long-term investment willingness lead to inefficient capital allocation, which limits TFP growth. As a result, increasing TFP in fishing businesses necessitates systematic improvements through institutional optimization, technology advancement, and improved risk management skills rather than depending just on conventional factor inputs.
Notably, the majority of current research is on TFP drivers in the manufacturing or distribution sectors, with the fisheries sub-sector receiving little attention. These studies usually rely on the following premises, which are fundamentally problematic in the fishing industry: continuous manufacturing processes, flexible factor modifications, and effective inventory buffering First, it is challenging to completely minimize variations through standardized procedures since production shows a considerable dependency on natural circumstances, with output directly impacted by uncontrolled elements as climate and disease outbreaks; Second, goods have limited shelf life and are very perishable, necessitating exact demand forecasting and strict cold-chain management. Significant losses might result from small supply chain interruptions. Third, the sector has several cross-border segments and extensive value chains. It involves several legal and commercial access restrictions, ranging from seedling cultivation and aquaculture to processing and export sales. Losses in overall efficiency might result from disruptions at any rate. As a result, bringing the TFP analysis methodology directly to the fishing industry from the manufacturing or distribution sectors runs the danger of ignoring its own risk transmission mechanisms and efficiency limitations.
Because of this, adding supply chain risk perception—a dynamic cognitive variable—to fisheries TFP research provides as a critical test of “sources of efficiency” theory in resource-based, high-uncertainty industries while also contextualizing the body of previous studies. We can only precisely determine the real processes propelling the rise of the fisheries sector’s total productivity factor by firmly establishing analysis in the sector’s intrinsic production logic and risk structure.
Supply chain risk perception is the subjective evaluation of possible risks based on information processing and strategic judgment by businesses rather than the objective risk itself. Chen and Fan4 used text analysis to create supply chain risk perception indicators from the “risk warnings” parts of the annual reports of listed companies, demonstrating how businesses use language to show their awareness of supply chain uncertainties. Risk perception is a dynamic, endogenous strategic cognitive process that is influenced by variables including information exchange and business size, according to Sreedevi and Saranga3 and Yan et al.11 More importantly, recent studies emphasize the enabling attributes of risk perception: Ni et al.5 proposed the “strategic initiative perspective,” arguing that risk perception can drive enterprises to engage in industry-academia-research collab-oration and enhance technological autonomy.
The majority of the literature currently in publication concurs that risk perception affects firm total factor production (TFP) via a number of intermediate routes. First, a key channel is the effectiveness of resource allocation. Research has found that digital logistics significantly enhances total factor productivity (TFP) in the circulation industry by improving regional resource allocation. Additionally, empirical confirmation has shown that data factor utilization promotes firm-level TFP growth through a “factor allocation effect.” In a similar vein, fishing businesses may invest in cold chain infrastructure, expedite localized procurement, or optimize inventory tactics in response to supply chain disruption concerns, all of which improve the efficiency of resource usage. Second, another crucial route is represented by technical innovation. Liu et al.6 confirm that ESG performance increases fishing TFP by encouraging technological innovation; Yang et al.12 show that industry-academia-research integration fosters breakthroughs in key technologies by improving human capital and R&D skills. By encouraging business investment in digital technologies like blockchain traceability, AI early-warning systems, and smart aquaculture, risk perception may improve reaction times and production accuracy. Attention should also be paid to institutional reaction systems. Research has discovered that by encouraging businesses to undergo green transformation, the “Green Factory Certification” policy improves TFP. From a financial openness perspective, Guo13 showed that easing financial limitations encourages fishing TFP. Fishing businesses may respond more aggressively to government regulations, take part in industry standard-setting, or look for policy assistance if they are motivated by their perception of risk. As a result, they are able to get institutional dividends and legitimate resources, which in turn increases production efficiency. The twin routes of “information effects” and “innovation effects” proposed by Zhang et al.14 also provide theoretical foundations for understanding the relationship between risk perception and sustainable performance. Although the material now in publication provides a strong theoretical basis for this investigation, there is still opportunity for further development: First, the majority of research focuses on risk perception and TFP in manufacturing or generic samples, but they don’t specifically examine the fishing business, which is a high-risk, highly regulated sector. Second, risk perception is frequently defined by retrospective performance or macro-level proxy variables, which may not accurately reflect management’s forward-thinking thinking. Finally, no study has systematically empirically tested or mechanistically analyzed the intrinsic behavioral chain through which risk perception specifically translates into optimized management and enhanced efficiency within fishery enterprises.
The purpose of this study is to close the aforementioned gaps. We quantify this key explanatory variable by directly extracting management attention to supply chain risks from business annual reports using Chen et al.4 technique. The study will concentrate on examining how this forward-thinking thinking eventually influences certain management strategies to increase the TFP of fisheries operations. This method extends the analytical viewpoint from passive response to proactive strategic adaptation in addition to responding to Chiu et al.15,16 study of the connection between supply chain information and company resilience. It aims to provide new micro-level evidence for the theoretical link between risk perception and efficiency improvement in the unique context of the fisheries industry.
Theoretical Analysis and Research Hypotheses
A company’s subjective estimate of supply chain risks has a significant impact on its internal resource allocation and operational choices, in addition to reflecting its evaluation of external environmental uncertainties. Listed fisheries companies that rely heavily on external inputs (feed, seedlings, cold chain) and are vulnerable to terminal market volatility must be vigilant about supply chain disruptions, cost surges, or information distortions in order to optimize production rhythms, modify investment directions, and bolster operational resilience. This cognition-driven behavioral adaptation has a favorable impact on total factor productivity by enhancing capital efficiency and minimizing resource misallocation. Therefore, the basic hypothesis H1 is put out in this paper:
H1: Supply chain risk perception exerts a significant positive influence on the total factor productivity of fishery enterprises
Additionally, this work develops a model of a tripartite mediation mechanism called “Cognition-Strategy-Operations.” First, supply chain risk perception helps businesses recognize and predict changes in market demand more precisely, which effectively lowers demand uncertainty (cognitive layer). Building on this basis, businesses typically employ cautious and adaptable development plans (strategic layer) in place of high-risk strategic inclinations, such as aggressive expansion or excessive investment. Ultimately, these modifications result in improved inventory turnover efficiency and a reduced inventory backlog, thereby enhancing the allocation of operational resources (operational layer). Together, these three interrelated levels demonstrate how supply chain risk perception leads to observable increases in total factor productivity through methodical management responses. This framework not only aligns with the fisheries industry’s inherent constraints—perishability, long supply chains, and high volatility—but also deepens research into the micro-level pathways through which risk perception influences corporate efficiency.
First, supply chain risk perception reflects a company’s awareness of external disruptions and modifies its framework for understanding and assessing the market environment at the cognitive level. Since the fishing industry is a prime example of a “pond-to-plate” business chain, its terminal demand is highly susceptible to a range of external shocks, including unforeseen food safety incidents, modifications to international trade regulations, shifts in consumer preferences, and seasonal variations in consumption. Notably, early supply chain indicators of declining market demand, such as international port congestion, sudden shipping price changes, or delays in the delivery of critical intermediate items, often precede declines in terminal demand.17 Management proactively increases down-stream market monitoring and research when they identify such risks through yearly reports, supplier interactions, or industry opinion. Examples include using big data analytics to monitor retail inventory levels, tracking consumption trends, and forecasting regional demand shifts by combining holiday and weather data.18 By improving the accuracy of their forecasting demand, businesses may successfully reduce the uncertainty they confront thanks to this information processing mechanism that is triggered by supply chain concerns.
In order to minimize decision blind spots, managers in high-uncertainty contexts should improve their situational interpretation and information search skills, ac-cording to behavioral strategy theory.19 This cognitive improvement causes businesses in the fishing industry to switch from the conventional “production-driven sales” strategy to adaptable “demand-driven production” tactics. This strategy optimizes product portfolios to meet the needs of specialized markets while avoiding overcapacity and price crashes resulting from blind expansion. Increased supply-demand alignment immediately lowers inventory accumulation and resourcing waste, increasing the marginal production efficiency of labor, capital, and natural resources. Effectively lowering demand uncertainty is a crucial precondition for increasing total factor productivity, according to existing research.20
Therefore, this research argues that supply chain risk perception significantly reduces demand uncertainty that businesses face by promoting advancements in information gathering and demand forecasting skills. As a result, resource misallocation is reduced, providing a basis for informed decision-making and ensuring long-term TFP growth efficiency. This leads to the proposal of Hypothesis H2:
H2: By lowering demand uncertainty, supply chain risk perception increases fishing firms’ total factor productivity
Second, companies’ long-term investment and strategic decision inclinations are significantly influenced by their assessment of supply chain risks at the strategic level. While some research suggests that external shocks may spur firms’ “strategic proactivity”,5 encouraging them to seek breakthroughs through techno-logical innovation or model transformation, this reasoning needs to be applied cautiously in industries like fisheries, which are known for their heavy asset specificity, high natural dependency, and extremely irreversible production processes. In particular:
First, there is a great deal of expertise in fishing assets. Once constructed, core assets such as cold-chain storage facilities, deep-water net pens, recirculating aquaculture systems, and distant-water fishing vessels are difficult to repurpose for other sectors or areas, resulting in very high conversion costs. Businesses may find themselves in a “locked-in” situation as a result of blind expansion motivated by miscalculated market trends. This can lead to significant sunk costs that seriously impair capital return rates.
Second, hazards are extremely unexpected since natural factors control industrial operations. Significant production volatility is caused by frequent and un-predictable natural disturbances, such as abnormal water temperatures, red tide outbreaks, disease outbreaks, and harsh weather. In light of this, rapid expansion is unable to use economies of scale to reduce hazards. Instead, it amplifies losses due to inflexible capacity—for instance, a regional disease outbreak can instantly wipe out hundreds of millions of dollars in aquaculture assets.
Third, the cycles of fisheries production are long and uninterrupted. The process frequently takes months or even years, from the discharge of seedlings to fish that are ready for the market, and there is little flexibility to change the rate of output. Businesses are extremely sensitive to price collapses and inventory depreciation because they are unable to quickly curtail production or stockpile perishable items in the event that terminal market demand declines owing to trade obstacles, changing consumer tastes, or food safety problems.
Together, these traits imply that “strategic initiative” in fisheries may quickly turn into “strategic overreach” in the absence of accurate risk forecasting, whereas “strategic retrenchment” is a logical adaptation strategy based on realistic limitations. Management frequently proactively reduces strategic aggressive-ness—limiting high-risk, high-leverage departures from industry norms—when they spot recurrent disruption signals from supply chain data. Examples include aggressive short-term debt financing for aggressive development, cross-industry acquisitions of unrelated companies, and careless aquaculture expansion.
This strategic “convergence” is an efficiency-driven approach to risk minimization rather than a passive retreat. According to Bloom’s21 groundbreaking study, businesses often delay irreversible expenditures in order to avoid misallocating resources when faced with uncertainty. According to Chen et al.,20 businesses that perceive a high degree of uncertainty significantly cut down on capital expenditures and mergers and acquisitions in order to preserve their financial stability. Limiting unreasonable strategic growth in the fishing industry helps prevent overcapacity, asset idleness, and debt concerns resulting from overconfidence. This improves resource allocation precision and long-term total factor productivity by allowing scarce resources to focus on ESG compliance, supply chain resilience development, and core technology updates. In a similar vein, Research has discovered that businesses were able to achieve consistent TFP growth under environmental regulatory pressure by limiting non-essential development and concentrating on improving core company efficiency.
Therefore, this research argues that supply chain risk perception enables fishing firms to avoid high-risk strategy deviations, implement prudent investment strategies, and focus on core activities, thereby successfully mitigating agency difficulties and investment distortions. This establishes the financial and institutional framework for long-term TFP growth. In light of this, we suggest Hypothesis H3:
H3: By preventing strategic over-aggression, supply chain risk perception increases the overall factor productivity of fishing businesses
Lastly, fishing enterprises frequently proactively modify their inventory management techniques at the operational level in response to supply chain disruption threats. Due to the short shelf life, high perishability, and heavy reliance on cold chains of aquatic goods, any delays in logistics, changes in demand, or misinformation can result in significant inventory accumulation and value loss.3,22 In this situation, management typically adopts leaner operating models when they foresee supply chain disruption threats, such as port congestion, skyrocketing transportation prices, or supplier fulfillment uncertainties. These include encouraging small-batch, high-frequency procurement, reducing inventory holding cycles, bolstering production-sales coordination systems, and even experimenting with Just-in-Time (JIT) concepts to lower inventory risks. This risk-driven inventory optimization significantly frees up working capital tied up in inefficient inventory, enhancing capital allocation efficiency while also reducing asset impairment losses resulting from product spoilage or market mismatches. More significantly, it has been extensively shown that total factor productivity (TFP) and inventory turnover rate, a key indicator of operational efficiency, are highly correlated. Effective inventory management reverses the vicious cycle of “resource idleness—rising costs—declining efficiency,” directly increasing TFP by optimizing factor combinations, according to a manufacturing study by Li.23 Similarly, research has shown that increasing inventory turnover through digital technology can significantly enhance overall productivity and resource allocation efficiency for distribution companies. An increased inventory turnover rate for fishing businesses means that more sales may be produced with less inventory investment per unit of time. This provides an operational basis for long-term TFP growth by lowering storage and loss costs per unit output and improving the company’s responsiveness to market shifts. Thus, this article contends that perception of supply chain risk is more than just a passive protection mechanism. Rather, it turns external uncertainty into an internal driver for efficiency gains by promoting streamlined processes, especially through improved inventory turnover efficiency. In light of this, we suggest Hypothesis H4:
H4: Supply chain risk perception enhances total factor productivity in fishery enterprises by improving inventory turnover rates
Empirical Analysis
Data Sources
The research subjects were selected based on the industry classification standards issued by the China Securities Regulatory Commission in 2012, specifically including fishery enterprises that meet these standards (Table 1). To ensure comparability of results, enterprises with ST (Special Treatment) indicators or lacking supply chain risk perception data were excluded, and continuous variables underwent 1% trimmed tailing to eliminate the influence of extreme values. The final research subjects comprised relevant data from seven Chinese listed fishery enterprises between 2012 and 2023. Annual report data were sourced from the CNRDS database, while financial and governance data were obtained from the CSMAR database. Word frequency statistics and keyword expansion were conducted using the WinGo text analysis database.
Variable Selection
(1) Dependent Variable: Total Factor Productivity (TFP)
Existing studies primarily employ Ordinary Least Squares (OLS), Olley-Pakes (OP), and Levinsohn-Petrin (LP) methods to measure TFP. This study employs the semiparametric estimation method proposed by Olley and Pakes24 to measure the total factor productivity (TFP) of listed fishery enterprises, effectively mitigating the simultaneity bias inherent in traditional OLS estimation. This method introduces enterprise investment as a proxy variable for productivity shocks and combines it with a GMM framework to achieve consistent estimation of the production function.
Specifically, the production function is assumed to follow the Cobb-Douglas form (1):
Yit=AitKβkitLβLit
Where denotes the actual output of firm i in year t (measured by operating revenue), represents net fixed assets (capital input), signifies the number of employees or total wages (labor input), and is the estimated total factor productivity (i.e., the technical efficiency term).
The core idea of the OP method is to treat as a state variable and assume its dynamic evolution satisfies the first-order Markov property (as in Equation 2):
Ait+1=E[Ait+1|Ait|,Kit,Iit]+εit+1
Where represents the firm’s current investment (measured by net fixed asset additions), serving as a proxy for the unobservable productivity variable Through a two-step nonparametric regression (first estimating the investment function, then the output function), the output elasticities of capital and labor, and can be identified, thereby deriving total factor productivity (as shown in Equation 3):
^TFPit=lnYit−^βKlnKit−^βLlnLit
In practice, following the methodology of Lu and Lian,25 this study substitutes intermediate inputs (raw materials, fuel, and power costs) for investment amounts as a proxy variable, as detailed investment breakdowns are often not disclosed in fishery enterprises’ annual reports. The first-order lag of capital stock and the current value of intermediate inputs are employed as instrumental variables to satisfy the moment conditions for GMM estimation.
All input and output variables undergo the following adjustments:
Output : Operating revenue is used and deflated to constant 2012 prices using the annual Producer Price Index (PPI) for industrial goods;
Capital : Measured by net fixed assets, calibrated using the perpetual inventory method;
Labor : Measured by the number of employees and deflated using the average wage index for urban unit employees;
Intermediate Inputs : Includes operating costs such as raw materials, purchased fuels, and power.
Finally, this paper adopts the estimated via the OP method as the core dependent variable, denoted as TFP_OP. For robustness testing, the Levinsohn-Petrin (LP) method is also employed for cross-validation to ensure the reliability of conclusions.
(2) Explanatory Variable: Corporate Supply Chain Risk Perception (Risk)
Following Chen and Fan,4 the measurement steps for the corporate supply chain risk perception indicator are as follows: Step 1: Annual Report Text Information Organization. A Python program was developed to download annual reports from 2007 to 2021 for Shanghai and Shenzhen A-share listed companies from the China Securities Information Network. PDF documents were converted into TXT files suitable for text analysis. Non-Chinese characters such as images, spaces, numbers, and garbled text were removed from the annual reports.
The Jieba Chinese word segmentation module was used to split sentences into separated words. Step 2: Constructing risk and supply chain dictionaries. First, reference Chinese and English literature20,26,27 to identify seed words related to risk and supply chain, such as risk, uncertainty, unknown, supplier, customer, and purchaser. Next, Word2Vec word embedding technology was used to compute the cosine similarity of each seed word based on the annual report context,28 thereby identifying synonyms for seed words. Third, the synonym pool for seed words was expanded using the Wingo platform’s corpus of government work reports from all administrative levels nationwide. Finally, the risk lexicon and supply chain lexicon were established by calculating the frequency of lexicon terms in annual report texts and manually reviewing their applicability. Step 3: Calculate the enterprise supply chain risk perception index. Drawing on Hassan et al.29 and Benguri et al.,27 this study measures supply chain risk information through the frequency of supply chain terms and risk terms appearing in close proximity within the text. It is posited that the simultaneous occurrence of supply chain terms and risk terms in a short text segment likely indicates the expression of supply chain risks faced by the enterprise. The calculation is performed using the following expression:
Riskit=1Tit∑Titw=1{1[wϵR]×1[|w−r|≤15]}
Where denotes the total word count in the annual report of company i for year t, w=1,2,……,
Denotes words included in the annual report, R represents the supply chain dictionary, and r denotes the risk term most closely associated with the supply chain term. Based on Equation (4), this paper calculates the frequency of supply chain terms and risk terms appearing within a 15-word context as the primary core explanatory variable. For robustness, testing is conducted using a 20-word context.
(3) Control Variables
Considering existing literature and data availability, this model selects factors related to scale efficiency and technical efficiency across production, operations, and management. These include cash flow level (Cashflow), board size (Board), capital structure (Lev), independent director ratio (Indep), ownership concentration (Top1), corporate growth (Growth), and company size (Size) as control variables. (Table 2)
Model Design
To examine the impact of supply chain risk perception on the total factor productivity (TFP) of fishery enterprises, this paper constructs the following fixed-effects model (5):
TFP_OPit=β0+β1Riskit+7∑n=2βn⋅Controlit+λt+μi+εit
In the model, the total factor productivity of fishery enterprises is denoted as TFP; a higher value indicates greater total factor productivity. Risk represents management’s risk perception, while Control serves as the firm-level control variable. This study controls for firm-level fixed effects and year-level fixed effects, where and denote time effects independent of individual firms and individual effects independent of time, respectively. represents the error term. Additionally, this study employs standard errors clustered at the firm level.
Empirical Results
Descriptive Statistics
Table 3 presents descriptive statistics for key variables. The table indicates that during the sample period, the maximum total factor productivity (TFP) for fishery enterprises was 7.0855, the minimum was 5.3451, and the standard deviation was 0.4924, suggesting relatively small disparities in TFP levels among fishery enterprises. The maximum and minimum values for supply chain risk perception were 1.3680 and 0.0555, respectively, indicating a significant disparity in perceived supply chain risk levels among enterprises.
Additionally, the mean asset size of enterprises in the sample was 21.6064, the mean debt-to-asset ratio was 43.5%, and the average operating revenue growth rate was 13.3%. Other company characteristic variables also fell within reasonable ranges.
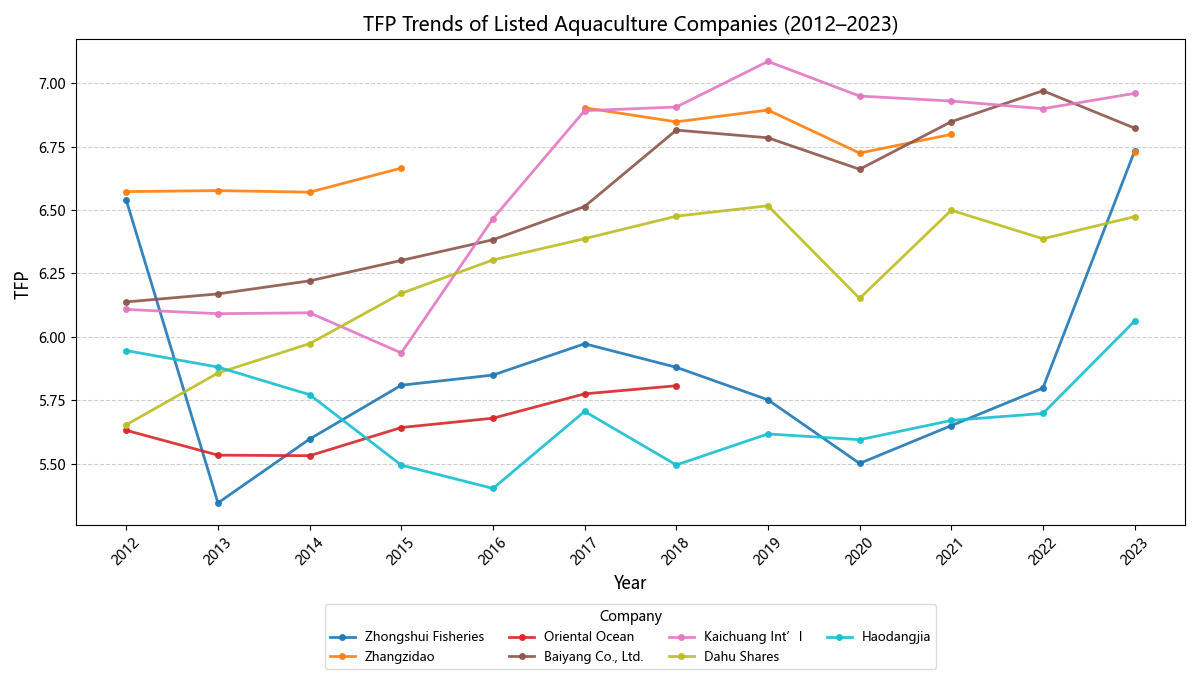
Figure 1 reports the annual trends in total factor productivity (TFP) for seven listed aquatic companies in the sample from 2012 to 2023. Overall, corporate TFP followed a pattern of initial decline followed by recovery: efficiency remained low or even deteriorated for most firms between 2012 and 2015. After 2016, it steadily recovered, and several businesses saw notable increases in 2022–2023 as a result of supply chain optimization and strategic changes made in the wake of the 2020 pandemic shock. Significant differences exist between the companies: Oriental Ocean and Haodangjia consistently maintained low TFP levels, reflecting differences in risk management, technological investment, and resource allocation capabilities, while KaiChuang International and BaiYang Co., Ltd. maintained consistently high and steadily growing TFP levels. The TFP distribution has notably converged in recent years, suggesting increased impetus for improving industrial efficiency as a whole. This pattern gives this study’s investigation of supply chain risk perception’s influence on total factor productivity an intuitive empirical foundation and purpose.
Benchmark Regression
The benchmark regression findings for the association between management’s perception of supply chain risk and fishing firms’ total factor productivity (TFP) are shown in Table 4. The TFP level of Chinese listed fishing companies has a matching z-statistic of 2.77 and a p-value of 0.033. This suggests that there is a substantial positive correlation between management’s assessment of supply chain risk and the TFP of fishing firms at the 5% significance level. This finding strongly confirms Hypothesis H1, which states that the TFP of listed fishing companies rises in proportion to management’s expression of increasing levels of supply chain risk perception in formal texts like annual reports. This discovery has important theoretical and practical implications. More importantly, the risk perception indicator created by text mining directly captures management’s subjective cognition and information processing regarding supply chain environmental uncertainty. This validates the positive value of supply chain risk information for corporate efficiency. This answers the age-old topic of “how organizations employ supply chain information to optimize internal decision-making” at the micro level. This study also shows that management’s proactive identification and forward-looking assessment of risks itself constitutes a key mechanism driving resource allocation optimization and productivity enhancement, whereas previous research frequently looks at corporate behavioral adjustments from the perspectives of supply chain structure or external shocks. Such risk-informed cautious decision-making and flexible reactions are essential for businesses to move toward high-quality development in the fisheries industry, which is marked by high volatility, large losses, and a substantial reliance on external coordination.
Moderating Effects
This study employs technological innovation capability as a moderating variable to investigate the boundary conditions under which supply chain risk perception affects total factor productivity. This is calculated by adding one (Patent) to the natural logarithm of the total number of patent applications (including invention, utility model, and design patents). This indicator serves as a vital basis for absorbing, converting, and reacting to external risk information as it fully captures a company’s activities in technical accumulation, process improvement, and product innovation. Theoretically, businesses with high technical innovation skills have more organizational flexibility and the ability to restructure resources,30 which enables them to better translate supply chain risk signals into internal improvement drives. In particular, businesses with strong patent accumulation show benefits in the following areas:
(1) Improved information decoding capabilities: Technology-intensive businesses usually have dedicated R&D and market analysis teams, which makes it easier to identify real risks and opportunities in supply chain disruptions;
(2) Diversified response mechanisms: They can reduce external shocks through product innovation, process optimization, or technological substitution;
(3) Improved resource allocation efficiency: Patent assets themselves can act as collateral to ease financing constraints, offering financial protections for sustaining R&D investment and operational stability during risk scenarios .
Thus, this research suggests that a greater positive effect of supply chain risk perception on total factor productivity is achieved through higher technical innovation capabilities.
In order to investigate the border impacts of technological innovation capacity on the link between supply chain risk perception and TFP, this paper’s empirical research uses a moderation effect test approach based on grouping by yearly averages. In particular, we first determine each firm’s industry-year average h of yearly patent applications (Patent1). After that, the sample is split into two groups: high-patent (Patent1 > h) and low-patent (Patent1 < h). Higher values indicate more capacity for technological innovation. Table 5’s columns 1-2 show the effects of varying technological innovation capacities. The findings show that supply chain risk perception has a stronger beneficial impact on the TFP of fishing businesses in the high-patent category (Column 1). This result implies that TFP development cannot be fueled only by risk awareness. Businesses may only successfully use risk information to optimize decision-making, modify operations, and create responsive technical solutions provided they have strong technological accumulation and innovation capabilities.
Robustness Test
(1) Replacing the measurement method for explanatory variables
In the preceding regression, this study defined the measurement range for “proximity” between supply chain terminology and risk terminology within a 15-word context in annual reports. To test the robustness of this measurement method, this study adjusted the measurement range and redefined supply chain risk perception using a 20-word context. The regression results are reported in Table 6. The obtained results are consistent with the benchmark regression results, indicating the reliability of the benchmark regression findings.
(2) Replace the measurement method for the dependent variable
Switch the TFP estimation method from the OP approach to the LP approach. The regression results are reported in Table 7, showing that the supply chain risk perception coefficient is highly consistent with previous research findings, further validating the robustness of the core conclusions in the text.
(3) Adding market conditions and institutional ownership variables to the control set
Following Tang et al.,31 the Fan Gang Marketization Index was adopted as a proxy for marketization level and included in the control set. Referencing Luo et al.,32 the proportion of shares held by institutional investors was used as the institutional ownership variable and incorporated into the control set.
The regression analysis results are presented in Table 8. The data indicate that after incorporating market conditions and institutional ownership variables, the conclusion regarding the impact of corporate supply chain risk perception on total factor productivity in the fisheries sector remains unchanged. The coefficient for supply chain risk perception continues to be significantly positive, confirming the robustness of the original conclusion.
(4) Adjusting Cluster Standard Errors
Within a particular year, certain macroeconomic, policy, or market variables may have an impact on supply chain risk and TFP. This work strengthens the robustness of regression results by further improving standard error estimate accuracy through firm-year clustering. The regression results are still consistent with earlier findings, as Table 9 illustrates.
Further Analysis
1. Reducing Demand Uncertainty: The Market Anticipation Path Driven by Risk Perception
The capacity of a business to recognize and anticipate possible external disruptions and internal supply chain vulnerabilities is known as supply chain risk perception. This skill helps businesses to more accurately detect market signals, which significantly reduces demand uncertainty in the fisheries sector, which is heavily reliant on end-consumer demand and characterized by perishable goods. In order to investigate its underlying processes, this study presents demand uncertainty as a mediating variable and methodically investigates how supply chain risk perception affects total factor productivity (TFP) in fishing businesses.
In particular, businesses proactively improve market monitoring and forecasting skills when they identify supply chain disruptions through annual report contents, supplier feedback, or industry opinion. Integrating retail inventory data, examining consumption trends, and using big data to monitor changes in regional demand are a few examples.18 The accuracy of demand forecasting is much improved by this set of responsive activities, which also dramatically lessens the unpredictability of demand variations that arise in real operations. Businesses may create production plans more scientifically, minimize inventory backlogs, prevent capacity mismatches, and respond to market changes more quickly because to the decrease in demand uncertainty. As a result, it maximizes the efficiency of capital, labor, and natural resource allocation, establishes a stable environment for technological innovation and process development, and eventually propels the long-term improvement of total factor productivity.
This work uses the Huang et al.33 technique to validate these mediating processes. A time-series regression model is used to identify the residual term in sales variations that cannot be explained by trend or seasonality using quarterly sales revenue data. This residual’s yearly standard deviation can be used as a stand-in for demand uncertainty. Simultaneously, the “Risk Factors” portion of listed businesses’ annual reports is text analyzed to create the supply chain risk perception indicator. Empirical findings show that business demand uncertainty is significantly impacted negatively by supply chain risk perception (see Table 10, Column 1). This suggests that businesses with greater risk perception skills are better able to minimize operational interruptions brought on by changes in market demand, setting the stage for efficiency improvements.
2. Curbing Irrational Strategic Expansion: A Risk-Guided Path to Strategic Prudence
The impression of supply chain risk drives fishing businesses to concentrate more on continuously improving development models and operational quality, which is essential to raising their total factor productivity (TFP). This study examines the function of strategic aggressiveness as a mediating variable in the transmission process of supply chain risk perception impacting fishing firms’ TFP in order to dive deeper into the underlying mechanism. The degree to which businesses embrace high-risk, high-return projects that depart from industry standards in strategic decision-making—such as aggressive capacity growth, significant cross-industry mergers and acquisitions, or high-leverage operations—is a measure of their strategic aggressiveness. Fisheries companies typically become less strategically proactive when they perceive increased supply chain risks (such as geopolitical crises, supplier instability, or rising logistical costs). In order to manage systemic risks and guarantee supply chain resilience, they move toward more cautious operating techniques. This strategy improves operational quality, maximizes resource allocation, and eventually increases TFP.
Using the methodology of Wang et al.,34 this study builds a strategic intensity (ST) index across six dimensions—innovation propensity, market expansion, capital intensity, etc.—and quantifies it using annual reports and operational data from fishing enterprises in order to validate this mediating pathway. According to the regression results in Column 2 of Table 10, supply chain risk perception significantly reduces strategic intensity, and the connection between supply chain risk perception and TFP is largely mediated by strategic intensity. This implies that supply chain risk perception, which inhibits excessively aggressive strategic actions and directs businesses toward steady development and quality improvement, consistently increases TFP growth in fishing operations.
3. Enhancing Inventory Turnover: The Risk-Perception-Driven Lean Operations Pathway
In fishing businesses, supply chain risk perception greatly improves inventory turnover efficiency, which supports TFP growth. Fisheries production includes very perishable goods and is mostly dependent on outside resources (such as fry, feed, and energy). Supply chain interruptions all readily cause inventory accumulation, product deterioration, and capital immobility. In light of this, companies typically implement lean inventory management techniques, such as reducing procurement cycles, improving production-sales alignment, and optimizing warehouse scheduling, as a result of management’s proactive identification of supply chain risks. These steps are intended to minimize uncertainty-related losses and mismatch costs. To accurately capture this process, this article uses the inventory turnover rate as the primary proxy variable for operational efficiency. Businesses go toward a “small batches, high frequency, quick turnover” operating style as a result of decreased safety stock redundancy due to increased risk perception. This successfully reduces the value devaluation of aquatic items brought on by sluggish sales or logistical delays. This strategy improves capital use efficiency across the production-to-sales cycle in addition to releasing working cash locked up in unproductive inventory. By lowering per-unit losses and managerial expenses, it systematically increases total factor productivity and directly increases the marginal production of capital factors. Empirical evidence is provided by the regression findings in Table 10’s Column (3), where the supply chain risk perception (Risk) coefficient is significantly positive at the 5% level, suggesting that businesses with greater risk awareness have more efficient inventory turnover. This result demonstrates that risk perception drives sophisticated and flexible inventory management, which converts external pressures into internal efficiency gains rather than just conservative contraction. Improved inventory turnover rate is the primary operational channel via which risk perception affects TFP in the fishing business, which is a high-waste, quick-turnover sector.
Conclusions and Recommendations
This study examines Chinese fishing companies that are listed between 2012 and 2023. We create a supply chain risk perception indicator for management using co-occurrence frequency analysis based on annual reports. We methodically look at its effects on underlying systems and total factor productivity (TFP). According to empirical findings, supply chain risk perception has a considerable and favorable impact on TFP growth in fishing businesses. Three routes are identified via mechanism testing as the methods in which this impact functions: Lean inventory management reduces aquatic product losses and capital occupation, improving capital utilization efficiency; strategically, businesses proactively curb aggressive expansion tendencies, focusing on core businesses to optimize long-term resource allocation; and cognitively, risk perception lowers demand uncertainty, improving market forecasting and supply-demand matching capabilities.
Theoretical Contributions
Three theoretical contributions are made by this work. First, it overcomes the conventional restriction of considering risk perception as a passive “defense mechanism,” redefining it as an active strategic cognitive capability—that is, the fundamental capacity of businesses to integrate data, evaluate circumstances, and make proactive decisions based on external cues. By connecting with Ni et al.'s5 “strategic proactivity” paradigm and operationalizing it into a quantifiable cognition-behavior link, this viewpoint broadens the theoretical parameters of supply chain risk management. Second, by addressing the literature’s excessive reliance on manufacturing or distribution models that ignore the high natural dependence and supply chain vulnerability of re-source-based industries, this study pioneers the integration of risk perception into fishery TFP research. By disclosing the transmission channel “risk perception → decreased demand uncertainty → increased TFP,” it enhances micro-level data that shows efficiency gain is driven by factors other than technology. Lastly, this work develops a trinity-based mediation mechanism model of “cognition-strategy-operation,” methodically explaining how risk perception simultaneously achieves efficiency gains through improved operations and restrains strategic overreach through judicious control. This offers a fresh perspective on the underlying logic of excellent company development in unpredictable settings.
Management Implications
Direct empirical evidence on “how organizations exploit supply chain information to assist internal decision-making” from a “risk perception” viewpoint is first presented in this study. It reveals the multifaceted trade-off mechanism of risk perception in efficiency enhancement—that is, achieving efficiency leaps through operational refinement and market foresight while prudently controlling strategic overreach—in addition to expanding the upstream drivers of total factor productivity and enriching the literature on the economic consequences of supply chain risks. In light of the current global supply chain reorganization, this study has significant implications for the high-quality growth of fishing firms.
From a management standpoint, on the one hand: (1) Management should set up an organized system for monitoring supply chain risk at the level of supply chain risk management. Using a “supply chain risk radar system” to dynamically integrate multi-source data, such as international shipping price indices, port congestion data, extreme weather alerts, and quarantine policy changes in major trading nations, is one example. This information can then be incorporated into monthly operational analysis meetings. Simultaneously, to improve sensitivity to risks such as feed price volatility, logistical disruptions, and geopolitical shocks, routinely take part in supply chain resilience training conducted by industry groups. (2) When creating plans for significant investments or capacity expansion, management should incorporate risk assessment procedures into decision-making, take supply chain risks into account, communicate with suppliers and customers as soon as possible, and demand that production, procurement, finance, and other departments provide pertinent risk management analysis and data support. This guarantees that choices take into consideration the possible effects of outside uncertainty on the viability of the project.
From a corporate standpoint: (1) By hiring and introducing talent with extensive supply chain management experience, especially professionals with backgrounds in aquaculture, cold chain logistics, or international trade, companies can enhance decision-makers’ sensitivity and response capabilities to supply chain risks. Management can better grasp possible changes in production, inventories, and external markets thanks to executives’ supply chain experience. (2) Businesses need to scientifically balance the “risk buffer” function of inventory with “efficiency loss” expenses. They may dynamically optimize inventory levels to avoid excessive stockpiles affecting profitability and asset turnover by improving supply chain transparency and using intelligent warehousing and demand forecasting technologies. More significantly, businesses should incorporate supply chain management into systems for investment management and strategic planning. This achieves high synergy between risk awareness, operational execution, and long-term development goals, thereby continuously improving total factor productivity in an increasingly uncertain environment.
Additionally, larger institutional backing is needed for particular company initiatives. In order to achieve this, government agencies and industry associations should work together to: (1) Create a national-level platform for sharing data on the fisheries supply chain that integrates customs import/export data, AIS tracking of distant-water fishing vessels, aquatic wholesale market transaction information, and international certification standards. Give member businesses access to the API, which would drastically lower the prices and obstacles SMEs face when trying to get risk intelligence. (2) Create the “Guidelines for Building Resilience in the Fisheries Supply Chain,” which encourage businesses to include risk perception capabilities in their frameworks for ESG disclosure. Provide tax breaks or green credits to businesses who implement supply chain stress assessments and sophisticated early warning systems.(3) Encourage the establishment of emergency reservation centers and regional cold chain logistics hubs. To increase the industrial chain’s overall resilience against disruptions and avoid isolated disturbances from producing full-chain paralysis, deploy distributed cold storage networks in regions vulnerable to typhoons, red tides, and other catastrophes.
Future Research Directions
This study, based on empirical data from Chinese listed fisheries companies, provides preliminary evidence on the impact of supply chain risk perception on corporate total factor productivity (TFP) and its underlying mechanisms. However, constrained by sample scope, measurement methods, and research design, several important questions warrant further exploration in future research.
First, this study focuses on Chinese listed fisheries companies. Future research could include enterprises of various scales and governance structures, such as non-listed firms, and even fisheries operators from different countries and regions, to test the external validity and boundary conditions of the findings. Research specifically targeting small-scale fisheries and cooperatives in developing countries would be particularly valuable for gaining a more comprehensive understanding of the role of supply chain risk perception under varying resource allocation capabilities and market environments, thereby refining the contextual applicability of the relevant theories.
Second, the current study employs text-based indicators relying on word frequency and window co-occurrence. Future research could introduce more advanced natural language processing techniques, such as deep learning-based semantic models, to more accurately capture the emotional tone, complexity, and forward-looking nature of risk narratives in texts like annual reports and Management Discussion & Analysis (MD&A). Furthermore, incorporating multi-source data—such as surveys, experiments, or case interviews—to cross-validate managerial risk cognition could significantly enhance the accuracy and richness of core construct measurement.
Although this study mitigates some endogeneity concerns through panel data and fixed-effects models, future work could leverage exogenous policy shocks or unexpected events to construct quasi-natural experiments. Employing identification strategies like difference-in-differences or regression discontinuity designs would help establish a more rigorous causal relationship between risk perception and productivity. Additionally, dynamic panel models or vector autoregression methods could be used to examine potential feedback effects and intertemporal interaction mechanisms between the two.
Pursuing these directions will not only help verify and deepen the conclusions of this study but also promote the methodological and theoretical development of supply chain cognition theory and research on corporate efficiency. This will provide more dynamic and context-sensitive theoretical guidance for management practices in fisheries and other high-risk, resource-dependent industries facing uncertain environments.
Data accessibility
The datasets generated and/or analyzed during the current study are available from the corresponding authors on reasonable request.
Author Contributions
Conceptualization: Shubing Meng (Equal), Shaolei Qu (Equal). Methodology: Shubing Meng (Equal), Shaolei Qu (Equal). Software: Shubing Meng (Lead). Validation: Shubing Meng (Lead), Shaolei Qu (Supporting). Formal Analysis: Shubing Meng (Lead). Investigation: Shubing Meng (Lead). Resources: Shubing Meng (Lead), Shaolei Qu (Supporting). Data curation: Shubing Meng (Lead). Writing – original draft: Shubing Meng (Lead). Writing – review & editing: Shubing Meng (Equal), Shaolei Qu (Equal). Visualization: Shubing Meng (Lead). Supervision: Shaolei Qu (Lead). Project administration: Shaolei Qu (Lead). Funding acquisition: Shaolei Qu (Equal).
Ethical conduct approval
This work does not involve animals.
Conflict of Interest Statement
The authors declare that this article was conducted in the absence of any commercial or financial relationships that could be construed as a potential conflict of interest.