_the_distributi.tiff)
_chao1_index_(otus)__(b)_shannon_index__(c)_simpson_index__(d.tiff)
_the_two-dimensional_sorting_of_the_samples_analyzed_by_pcoa__.tiff)
_the_horizontal_composition_analysis_of_the_phylum__(b).tiff)
_the_flower_plot__(b)_the_heat_map_of_species_composition.tiff)
_the_absolute_ex.tiff)
Introduction
The Procambarus clarkii, native to the Gulf of Mexico and southeastern United States,1 is a eurythermal freshwater crustacean introduced to China in the 1930s from Japan. It has since become a major aquaculture species in the middle and lower Yangtze River regions.2,3 Valued for its firm texture, high protein and low-fat content, and high edible yield (tail meat accounts for 40-50% of body weight), it is highly adaptable, fast-growing, and reproductively prolific.4,5 The tail meat, easy to process and transport, is the core raw material for both domestic and export markets. The industry has developed a four-dimensional pattern: concentrated production (over 80% in the Yangtze River basin), full cold-chain coverage, domestic consumption (>90%), and export to Japan, Korea, Europe, and the US. Among these, -10 °C frozen cold-chain transportation has been widely adopted for long-distance and cross-regional distribution of crayfish tail meat, as it effectively inhibits most microbial growth and maintains product quality during long-haul logistics. However, the dynamic succession of microbial communities and the specific spoilage mechanism in crayfish tail meat under this typical -10 °C transportation condition remain poorly understood, which limits the precise optimization of cold-chain preservation technology.
Cold-chain transportation is critical for maintaining the sensory, nutritional, and safety quality of crayfish tail meat.6,7 Studies show that spoilage bacteria growth, community structure, and metabolite production vary significantly under different low-temperature conditions, directly affecting shelf life and safety.8,9 While low temperatures slow microbial growth and extend freshness, temperature fluctuations or increases can accelerate spoilage.10–12 Over time, even under cold conditions, spoilage becomes inevitable, manifested by discoloration, off-odors (ammonia, sour, or putrid smells), surface slime, and loss of elasticity.13,14 Microbiologically, spoilage bacteria secrete proteases and lipases, degrading proteins and fats, producing biogenic amines and other harmful compounds, posing food safety risks.15–18
This study used 16S rRNA sequencing to investigate the spoilage bacterial community succession in crayfish tail meat during -10 °C cold-chain transportation, aiming to provide scientific guidance for optimizing cold-chain parameters and extending shelf life.
Materials and Methods
Experimental design and sampling
Fifty live Procambarus clarkii (with a body weight of 25.68 ± 4.23 g) were purchased from a certain aquatic product market in Hubei Province and stored at -10°C to simulate cold chain transportation. On the day of purchase, the tail meat of the shrimps (with the intestines retained) was homogenized and randomly divided into tubes of the same specification. One tube was randomly selected and marked as the 0-day group. Then, one tube was randomly selected for sampling each day for 20 days (a total of 21 samples).
Microbial DNA extraction and 16S rRNA sequencing
16S rRNA sequencing
Total genomic DNA was extracted from the samples using the E.Z.N.A.® Stool DNA Kit (D4015, Omega Bio-tek, USA) according to the manufacturer’s instructions. Nuclease-free water was used as a negative control during extraction. Extracted DNA was eluted in 50 μL of elution buffer and stored at -80°C for subsequent PCR analysis. PCR amplification was performed using Pfu High-Fidelity DNA Polymerase (TransGen Biotech, China), with strict control over the number of amplification cycles. The cycle number was minimized while ensuring consistent amplification conditions across all samples within the same batch. Negative controls were included to detect potential environmental or reagent contamination. Any sample group showing amplification bands in the negative control was excluded from further experiments. Primers were tagged at the 5’ end with sample-specific barcodes and universal sequencing primers. The PCR reaction mixture (25 μL) contained 25 ng of template DNA, 12.5 μL of PCR Master Mix, 2.5 μL of each primer, and PCR-grade water to volume. Amplification conditions were: initial denaturation at 98°C for 30 seconds; 32 cycles of denaturation at 98°C for 10 seconds, annealing at 54°C for 30 seconds, and extension at 72°C for 45 seconds; followed by a final extension at 72°C for 10 minutes.
PCR products were confirmed by electrophoresis on a 2% agarose gel. Approximately 0.8 volumes of magnetic beads (Vazyme VAHTSTM DNA Clean Beads) were used to purify 25 μL of the PCR products. Purified products were quantified using a Microplate reader (BioTek, FLx800) with the Quant-iT PicoGreen dsDNA Assay Kit. Sequencing libraries were prepared using the Illumina TruSeq Nano DNA LT Library Prep Kit. Paired-end sequencing (2 × 250 bp) was subsequently performed on the Illumina NovaSeq platform.
16S rRNA data analysis
Paired-end 250 bp (PE250) sequencing was performed on the Illumina NovaSeq platform. A total of approximately 6.2 Gb of clean data were generated, with an average of more than 300,000 high-quality reads per sample after quality filtering. Low-quality sequences and adapter contamination were first removed. Sequences were then assigned to corresponding samples based on sample-specific barcodes and indices, after which the barcode sequences were trimmed off.
Quality-filtered sequences were processed using one of two methods: The dada2 pipeline within QIIME2 was used for denoising, generating high-resolution amplicon sequence variants (ASVs). Alternatively, sequences were clustered into operational taxonomic units (OTUs) at a 97% similarity threshold using the Vsearch software. The resulting ASVs or OTUs were taxonomically classified using the SILVA database (or the Greengenes database).
Based on the annotation results, the following analyses were performed: Alpha Diversity Analysis: The Chao1 richness index and Shannon diversity index were calculated for each sample. Rarefaction curves were plotted to assess sequencing depth sufficiency. Beta Diversity Analysis: A Bray-Curtis distance matrix was calculated to determine dissimilarities between samples. Principal Coordinates Analysis (PCoA) and Unweighted Pair Group Method with Arithmetic Mean (UPGMA) clustering analysis were performed. Permutational multivariate analysis of variance (PERMANOVA) was used to test the significance of differences between groups defined by storage time. Taxonomic Composition and Differential Analysis: The relative abundance of taxa at different taxonomic levels (phylum to genus) was calculated. Linear discriminant analysis Effect Size (LEfSe) was employed to identify differentially abundant taxa (biomarkers) among the different storage time groups. Microbial Co-occurrence Network Analysis: Spearman correlation coefficients between genera were calculated at the genus level. Co-occurrence networks were constructed, and key nodes (e.g., hub taxa) were identified. Functional Potential Prediction: The functional potential of the microbial communities was predicted based on the Kyoto Encyclopedia of Genes and Genomes (KEGG) metabolic pathways using the PICRUSt2 tool.
All statistical analyses and visualizations were performed within the R programming environment.
Results
OTU analysis of microorganisms in the tail meat of P. clarkii during frozen storage
The length distribution of the high-quality sequences contained in all samples was statistically analyzed, and the results are shown in Figure 1. As shown in Figure 1A, most sequences are concentrated between 400 and 450 bp, indicating good data integrity and supporting the reliability of the experiment. In Figure 1B, the horizontal axis represents the sample names, and the vertical axis shows the number of ASVs/OTUs classified to the phylum, class, order, family, genus, and species levels in each sample. Among them, the bars at the genus and species levels account for a relatively high proportion of the column length, indicating that the annotation resolution is very high and supporting the high reliability of subsequent diversity and functional analyses.
_the_distributi.tiff)
Alpha diversity is often used to assess the species richness and uniformity within a single sample or community. The measurement indicators of Alpha diversity differ in their focus on community diversity. In this paper, Shannon, Simpson, Chao1 and Coverage indices are used to evaluate the diversity and richness of the microbial communities in the samples. The Shannon and Simpson indices primarily characterize microbial community diversity, while the Chao1 index primarily measures community richness. The Coverage index is also one of the commonly used indices for evaluating community diversity. To clearly observe the changes and patterns of the data, the obtained data were plotted respectively to obtain Figure 2. As shown in Figure 2, the Coverage index obtained from sequencing all samples is greater than 0.985, indicating a high sample coverage rate, thorough sequencing, and no missed rare species, which can be used for subsequent analysis. The variation range of the Shannon index was from 8.5910 to 9.2659, and that of the Simpson index was from 0.9834 to 0.9927. The gentle variation range indicated that the community was uniform and diverse. The Shannon index reached its lowest value at the end, suggesting that long-term low temperatures began to slightly reduce diversity. The Chao1 index decreased in the early stage (days 0-2), rebounded in the middle stage (days 2-13), and declined again in the later stage (days 13-20), indicating that the initial low temperature led to the disappearance of highly sensitive species. The rebound in the middle stage suggested that cold-adapted species reproduced rapidly, and the slow decline in the later stage indicated that long-term low temperature would slightly reduce the richness of the microbial flora in the tail meat of P. clarkii (Figure 2A-D).
_chao1_index_(otus)__(b)_shannon_index__(c)_simpson_index__(d.tiff)
The Rank-Abundance curve shown in Figure 2E visually presents species abundance and community uniformity. The length of the broken line on the horizontal axis reflects the species richness. The wider the broken line, the more diverse the species composition. The gentleness of the zigzag reflects the uniformity of the community. The gentler the zigzag, the higher the uniformity of the community composition. As can be seen from the figure, the curves of all samples extend smoothly to the end of the horizontal axis, indicating that the species richness is not inhibited by low temperature. The curve shows no steep descent and the uniformity remains at a high level. The above results indicate that the species richness and uniformity of microorganisms did not significantly decrease during frozen storage, the temporal succession was slow, and the community structure was mainly fine-tuned rather than replaced.
Beta diversity refers to the dissimilarity in species composition or the turnover rate of species along the environmental gradient among different communities that change along the environmental gradient. Therefore, it is also called interhabitat diversity. The principal coordinate analysis of the microbial community based on the Bray-Curtis distance (PCoA, Figure 3A) indicates that the groups in the first 14 days are relatively concentrated on the coordinate axes, indicating overlapping community structures. From the 15th day, the coordinates gradually spread and reached the outermost end on the 20th day, representing a slow substitution process at -10 ℃. With the extension of frozen storage time, the consumption of nutrients leads to slight changes in the microbial community.
_the_two-dimensional_sorting_of_the_samples_analyzed_by_pcoa__.tiff)
The Bray-Curtis distance matrix was subjected to cluster analysis using the UPGMA algorithm (Figure 3B). Among them, the length of the branches reflects the distance between samples, and different groups are distinguished and presented by different colors. As shown in the figure, the branches of the groups on the 1st and 20th days are relatively distinct from those of other samples. The separation of the group on the 1st day indicates the loss of cold-resistant bacterial communities due to -10°C. The branches of the groups from the 2nd to the 19th day are relatively close, indicating the stability of the community. The branch of the group on the 20th day is relatively far from other samples, indicating that the microbial community undergoes slow changes with the extension of frozen storage time. This is consistent with the previous result.
Analysis of microbial species composition in the tail meat of P. clarkii during frozen storage
As shown in Figure 4A, at the phylum level, the top three groups in terms of relative abundance are Firmicutes, Proteobacteria, and Actinobacteriota. There is no significant fluctuation in relative abundance, and the community framework is relatively stable. Among them, with the continuous extension of storage time, the Proteobacteria phylum shows a gradually decreasing trend, while the Actinobacteriota phylum shows a slowly increasing trend.
_the_horizontal_composition_analysis_of_the_phylum__(b).tiff)
To conduct a detailed study on the differential characteristics of microbial communities at different frozen storage stages and further analyze the composition and dynamic change patterns of bacterial communities in chilled shrimp tail meat at the genus level. As shown in Figure 4B, at the genus level, the top three genera in terms of relative abundance are Psychrobacter, Rothia, and Exiguobacterium_A. The most obvious change is in Psychrobacter, which is relatively stable in the first four days and begins to decrease from the fourth day. It rose on the 10th and 15th days, but dropped to the lowest point on the 18th day. The changes of other bacterial genera were relatively stable.
Analysis of microbial species differences in the tail meat of P. clarkii during frozen storage
To visually present the number and changing trend of common and specific features of ASV/OTU in the sample, petal diagrams were drawn according to the ASV/OTU corresponding to different frozen storage days. As shown in Figure 5A, the total number of ASV/ OTUs in the samples from group F10-X0 to group F10-X20 was 1770, 1364, 1289, 1478, 1430, 1378, 1521, 1585, 1649, 1453, 1569, 1623, 1202, 1382, 1409, 1311, 1580, and 1690, respectively There were 1,507, 1,359 and 1,439 types. Twenty-one groups of samples contained 172 common ASVs/OTUs. Based on the petal graph data calculation, the values of the F10-X0 group are close to those of the F10-X17 group, F10-X13 group, F10-X8 group and F10-X11 group, with differences of 80, 90, 121 and 147 respectively. The values of the F10-X0 group differed significantly from those of the F10-X19 group, F10-X15 group, F10-X2 group and F10-X12 group, which were 411, 459, 481 and 568 respectively. Moreover, the diversity of microbial species in the tail of P. clarkii showed significant changes on the 1st, 6th, 9th, 12th, 14th, 16th and 19th days. The significant difference in ASV numbers between F10-X0 and F10-X12 indicated that the -10 °C cold-chain storage caused a remarkable shift in the composition of the microbial community. This fluctuation in ASV quantity was consistent with the overall wave-like changes in microbial diversity observed during the storage period. The above results indicate that after frozen storage treatment, the numbers of common and independent microbial species of P. clarkii changed significantly. The total number of OTUs under different frozen storage days did not have a positive/negative correlation with the sample size, that is, with the extension of the frozen storage period, the diversity of microbial species changed in a wave-like manner.
_the_flower_plot__(b)_the_heat_map_of_species_composition.tiff)
To further understand the intergroup differences in microbial community diversity of P. clarkii tail meat during different frozen storage periods, the top 50 genera with the highest average abundance were selected to draw a community heat map. Among them, the red blocks represent that the abundance of this genus in this sample is higher than that in other samples, and the blue blocks represent that the abundance of this genus in this sample is lower than that in other samples. The results are shown in Figure 5B. The number of different colonies has been changing throughout the 20 days, indicating that microorganisms are engaged in fierce competition at -10°C and the community is constantly evolving. Among them, the abundance of Psychrobacter decreased on the 4th day, rebounded on the 5th day, and gradually declined from the 10th to the 20th day. The abundance of Exiguobacterium_A decreases on the second day, gradually increases from the 5th to the 12th day, and gradually decreases from the 12th to the 20th day. It may indicate that they are more adaptable to the environmental conditions in the middle and later stages of frozen storage than other genera of bacteria.
To further determine the dominant bacterial genera in the microbial community during frozen storage, the top 5 genera with the highest abundance were screened out at the genus level. They were classified from high to low abundance as Psychrobacter, Rothia, Exiguobacterium_A, Acinetobacter, Macrococcus_B. As can be seen from Figure 6, although the quantities of Psychrobacter, Rothia and Exiguobacterium_A have been fluctuating, their abundances have remained relatively high compared to other genera, indicating that they are more competitive and are the dominant genera. It implies that it is directly related to the quality decline of shrimp tail meat during frozen storage (such as spoilage and off-flavor)
_the_absolute_ex.tiff)
Analysis of the horizontal differential flora association network and functional potential prediction of P. clarkii tail meat
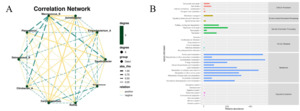
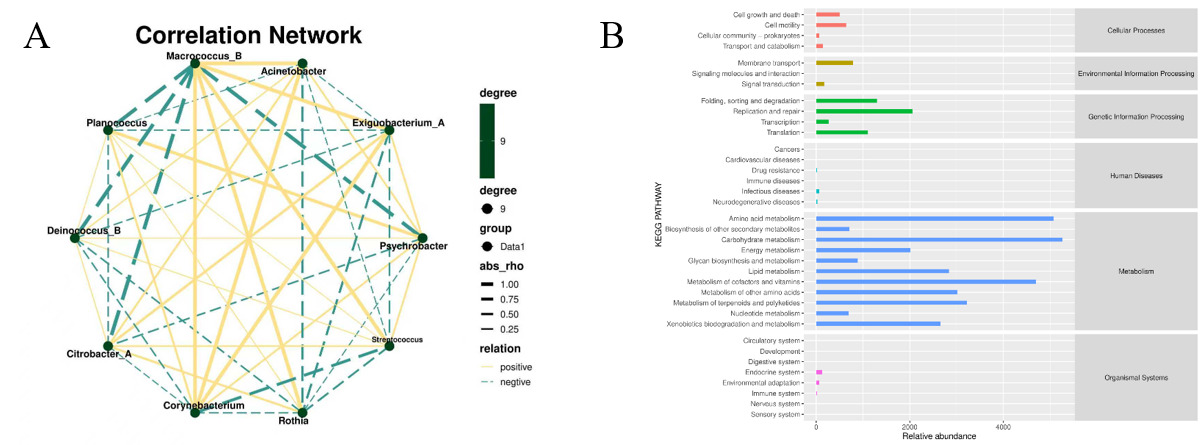
By constructing the correlation network of different bacterial genera, the influence relationships among bacterial genera in microbial communities can be revealed. The correlation analysis of the selected bacterial genera in the previous text was conducted to obtain Figure 7A, where the yellow lines indicate positive correlation and the green lines indicate negative correlation. It can be seen from the figure that the Macrococcus_B has a strong positive correlation with the Acinetobacter, Exiguobacterium_A, Streptococcus, Rothia and Corynebacterium. It shows a strong negative correlation with Psychrobacter, Citrobacter_A, Deinococcus_B and Planococcus. Figure 7B shows the analysis diagram of the KEGG metabolic pathway. The figure shows that the relative abundance of Metabolism is significantly higher than that of other categories. Especially Carbohydrate metabolism, Amino acid metabolism and Metabolism of cofactors and vitamins. In addition, Genetic Information Processing, Environmental Information Processing and Cellular Processes also show a relatively high abundance. This means that microorganisms are breaking down the sugars and proteins in the shrimp meat. This process produces acids, amines, sulfides, etc., which cause the shrimp meat to spoil.
Discussion
In this study, the tail meat of P. clarkii was taken as the object. The cold chain transportation conditions (-10°C) were simulated. Over 21 days of continuous sampling, the dynamic succession of the microbial community and its relationship with the spoilage mechanism were systematically analyzed using 16S rRNA sequencing. The Alpha and Beta diversity results of this study show that community richness dropped sharply from 0 to 2 days, then declined in a fluctuating manner. However, the Shannon index decreased only from 9.26 to 8.59, and the samples overlapped strongly in the first 14 days of the PCoA. At -10°C, the tail bacteria of prawns show slow succession rather than vigorous substitution. Analysis at the phylum level revealed that the dominant bacterial phylum gradually shifted from the Firmicutes in the fresh stage to the Actinobacteriota in the spoilage stage. At the genus level, the main genera include Psychrobacter, Rothia, Exiguobacterium_A and Acinetobacter, etc. The combination of differential genus analysis and KEGG pathway enrichment analysis shows that the abundance of Psychrobacter and Exiguobacterium_A gradually increases over time. In the correlation analysis of differential genera, they also show a positive correlation, indicating a synergistic effect between the two. In the KEGG analysis, the microbial functions were mainly concentrated on putrefaction-related pathways such as amino acid metabolism, carbohydrate metabolism, and biogenic amine synthesis, indicating that Psychrobacter and Exiguobacterium_A were the core putrefactive bacteria.
Psychrobacter is a common low-temperature spoilage bacterium. Psychrobacter can secrete heat-resistant proteases, lipases and phospholipases, which continuously hydrolyze casein and triglycerides in milk, leading to the disintegration of protein micelles and the aggregation of fat globules, and eventually resulting in quality deterioration such as bitterness, astringency, stratification or rancidity.19 In high-protein foods, when glucose is exhausted, Psychrobacter turns to utilize free amino acids to generate trimethylamine (TMA), sulfides, ammonia, biogenic amines (putretic amine, putretic amine), and aldehydes and ketones, giving the products a “dirty cloth” smell, fishy odor, or pungent ammonia smell. On the surface of aquatic products, Psychrobacter can also form tiny, moist colonies, which then merge into a continuous mucus layer, protecting the bacteria while promoting interactions among putrefactive bacterial communities. Accelerate sensory deterioration (grayish, yellowish, and sticky sensation).20–22
The Exiguobacterium_A is also a dominant spoilage bacteria that is often overlooked in refrigerated and “extreme storage conditions” foods. It has the characteristics of strong survival ability and strong proteolytic ability. The Exiguobacterium_A shows active lipase activity, which can hydrolyze triglycerides in muscle or liver and release free fatty acids. Subsequently, these fatty acids are further β -oxidized, causing the disappearance of characteristic flavor substances such as arachidonic acid, resulting in a “greasy - rancid” off-flavor in the product and leading to its deterioration.23–26 Exiguobacterium_A can also work synergistically with other putrefactive bacteria to accelerate the putrefactive process.
In addition, during the spoilage process, Psychrobacter and Exiguobacterium_A may have formed a synergistic relationship to accelerate the spoilage process.27,28 Exiguobacterium_A grows slowly but secretes lipase in the early stage of -10 °C cold-chain storage, which first decomposes fat in muscle and subcutaneous tissues into free fatty acids. These free fatty acids then serve as directly available substrates for Psychrobacter. After glucose is depleted, Psychrobacter quickly switches to amino acid and fatty acid metabolism, producing large amounts of biogenic amines, keto acids, and sulfides, thereby accelerating the onset of off-odors. Furthermore, Exiguobacterium_A can adhere to myofibril surfaces via extracellular polysaccharides (EPS) to form primary biofilms, and Psychrobacter subsequently embeds into these biofilms to form a composite structure. This structure locally maintains high concentrations of proteolytic and lipolytic enzymes, further accelerating spoilage.
In summary, during cold-chain transportation at -10°C, the microbial community at the tail of P. clarkii exhibits slow succession. The dominant phylum transitions from Firmicutes to Actinobacteriota, and the overall diversity and richness fluctuate and decline, but no drastic substitution occurs. Co-occurrence networks and functional predictions jointly demonstrate that the synergistic effect of Psychrobacter and Exiguobacterium_A leads to product spoilage, with Psychrobacter as the key strain. This experiment systematically revealed the succession pattern and functional potential of the microbial community in the tail meat of P. clarkii during cold chain transportation, providing a basis for understanding the spoilage mechanism of aquatic products during this process.
Acknowledgments
This work was supported by The President’s Fund of Tarim University (TDZKBS202534), The President’s Fund of Tarim University (TDZKBS202543), “Tianchiyingcai” Introduction Project (525307003) and “Tianchiyingcai” Introduction Project (525307006).
Author Contributions
Validation: Han Li (Equal), Xinyuan Ye (Equal), Weicheng Wang (Equal). Writing – original draft: Han Li (Lead). Writing – review & editing: Han Li (Equal), Wentao Zhu (Equal). Formal Analysis: Mengbo Wang (Equal), Tingyu Xie (Equal), Yu Chen (Equal). Supervision: Huijie Chen (Equal), Wentao Zhu (Equal). Funding acquisition: Huijie Chen (Equal), Wentao Zhu (Equal).
Ethics approval
All experiments were performed in accordance with the guidelines of the Laboratory Animal Center of Tarim University. The protocols were approved by the animal research ethics committee of Tarim University (PA20250326088).
Conflicts of Interest
The authors declared that they have no conflicts of interest to this work.