Introduction
Mud crab Scylla paramamosain is widely distributed across the Indo-West Pacific region.1 Endowed with desirable traits including large body size, rapid growth rate, palatable flesh, rich nutritional value, and strong environmental adaptability, S. paramamosain is extensively cultured along the coastal areas of China and many Southeast Asian countries.2,3 In 2024, the aquaculture output of mud crabs in China reached 162 thousand tons, making it the highest-yielding mariculture crab species and underscoring its significant economic value.4
Simple sequence repeats (SSRs), also referred to as microsatellites, are tandemly repeated DNA sequences consisting of 1–6 base pairs (bp).5 SSRs originate from strand misalignment induced by DNA polymerase slippage during replication, with mutation rates ranging from 10-2 to 10-6 nucleotides per generation in eukaryotic genomes.6 SSRs are characterized by high genomic abundance, codominant inheritance, high polymorphism, and random distribution across the genome.5 Due to these inherent advantages, SSRs have been widely utilized in population genetic analysis, species discrimination, and marker-assisted selection breeding.7–11 To date, only a limited number of SSR loci and markers have been developed for S. paramamosain,12 which has hindered research on the genetic structure and germplasm resource conservation of mud crab.
With the advancement of next- and third-generation sequencing technologies, the whole-genome sequences of numerous aquatic organisms have been successfully sequenced and assembled, laying a robust foundation for the large-scale mining of genomic SSRs. For instance, 412,381 SSR loci were identified in Acanthopagrus schlegelii13; 417,724 SSRs were detected in Pelteobagrus vachelli14; and 354,613 SSR loci were characterized in Oncorhynchus mykiss.15 Notably, Zhao et al.2 first reported the genome sequence of S. paramamosain, providing abundant genomic resources for the exploration and utilization of its genetic resources and thereby addressing the aforementioned limitation of insufficient SSR markers for this species.
In the present study, a large number of SSRs and SSR markers were identified and characterized from the S. paramamosain genome. The location of SSR markers in the genome was precisely mapped. Additionally, more than 40 polymorphic and stable SSR markers were developed, and a wild population of S. paramamosain was initially evaluated using eight polymorphic SSR markers. Collectively, the findings of this study provide valuable support for the conservation and genetic breeding of S. paramamosain.
Materials and Methods
2.1. Genome Acquisition, SSR Identification, and Correlation Analysis
The whole-genome of S. paramamosain was retrieved from the National Genomics Data Center (NGDC; https://ngdc.cncb.ac.cn/search/?dbId=gwh&q=GWHALOH00000000&page=1) under the Accession number GWHALOH00000000. As previously reported, the genome of *S. paramamosain *spans 1.55 Gb, encompassing 49 chromosomal sequences and additional unanchored contigs that cannot be mapped to specific chromosomes.2
SSR loci within the genome were systematically identified and characterized using the MIcroSAtellite (MISA) software. The search parameters were established as follows: mononucleotide repeats with a minimum of 10 tandem copies; dinucleotide repeats with no fewer than 6 copies; tri-, tetra-, penta-, and hexanucleotide repeats with a minimum of 5 copies; and compound SSRs with an inter-motif interval of < 100 nucleotides. Motifs differing solely due to base complementarity or nucleotide arrangement were categorized as the same type of SSR locus for unified statistical analysis.
SPSS 19 software was employed to perform correlation analyses between chromosome length and four SSR-related metrics: locus number, total length, density, and frequency.
2.2. SSR Primer Design and Synthesis
Primers targeting the identified SSR loci were designed using Primer3 software (http://primer3.org/) with the following optimized parameters: primer length ranging from 18 to 30 bp; annealing temperature between 50 and 60°C; GC content of 40%–60%; and expected PCR product size of 80–350 bp. The genomic positions of SSR loci were annotated based on the GFF format annotation file of the S. paramamosain genome.2
2.3. Genomic DNA Extraction
Thirty-two wild S. paramamosain individuals were collected from Dapeng Bay, Shenzhen (22°26′N, 114°15′E). Muscle tissue were dissected from each individual, immediately placed into 2 mL cryovials, and stored at −80°C until DNA extraction.
Genomic DNA was isolated from the muscle using the Marine Animal Tissue Genomic DNA Extraction Kit (Tiangen Biochemical Technology Co., Ltd., Beijing, China) following the manufacturer’s standard protocol. The integrity of the extracted DNA was assessed by 1% agarose gel electrophoresis, and its concentration was quantified using a NanoDrop 2000 spectrophotometer (Thermo Scientific, USA).
2.4. SSR Marker Validation
A total of 125 pairs of SSR primers were selected and synthesized (Table S1). The strategy for SSR marker was listed as follows: only 2–6 bp SSR motifs were selected. Amplicon lengths were set to 100–350 bp. For dinucleotide repeats, the repeat number was 8 - 50; for tri- to hexanucleotide repeats, the repeat number was 5-25. Initial validation of primer amplification efficiency was conducted using genomic DNA from 3 S. paramamosain individuals. The PCR reaction was performed in a 20 μL volume containing 0.2 μL ExTaq enzyme (Takara, Japan), 2 μL 10×ExTaq Buffer (with Mg²⁺), 1.6 μL dNTP Mix (2.5 mM), 0.8 μL of each forward and reverse primer (10 μmol/L), 0.5 μL genomic DNA (50 ng/μL), and 14.1 μL deionized water. The PCR cycling program was set as follows: pre-denaturation at 95°C for 5 min; 35 cycles of denaturation at 95°C for 30 s, annealing at 53°C for 30 s, and extension at 72°C for 30 s; followed by a final extension at 72°C for 5 min. PCR products were separated by 1% agarose gel electrophoresis to verify the generation of single target bands. Primers that successfully amplified distinct, single bands were selected for subsequent experiments, and the 5′ end of each forward primer was labeled with Fluorescein Amidite (FAM) (Table S1). Primer synthesis and fluorescence labeling were commissioned to Sangon Biotech (Shanghai) Co., Ltd (China).
2.5. Population Genetic Analysis
Eight SSR markers were randomly chosen to evaluate the genetic diversity of the wild S. paramamosain population from Dapeng Bay, Shenzhen. The PCR reaction system and cycling conditions were identical to those described in section 2.4. Fluorescently labeled PCR products were analyzed by capillary electrophoresis using an ABI 3730XL automatic sequencer (Thermo Fisher Scientific, USA) to determine the genotype of each individual. Popgene 1.32 software (Yeh and Boyle, 2000) was utilized to calculate genetic diversity parameters, including the number of alleles (Na), number of effective alleles (Ne), observed heterozygosity (Ho), expected heterozygosity (He), Shannon’s Information index (I), Hardy–Weinberg equilibrium (HWE), and fixation index (Fis). The polymorphism information content (PIC) of each SSR locus was computed using Cervus software (Marshall et al. 1998). Linkage disequilibrium (LD) was analysed using Arlequin 3 (Excoffier et al., 2007).
Results
3.1. Genome-Wide Distribution Profiles of SSR in S. paramamosain
A total of 3,184,249 SSR loci, including 1,185,523 compound SSRs and 1,998,726 perfect SSRs, were comprehensively identified across the S. paramamosain genome (Table S2). The average distance between microsatellite loci was 486 bp. The total length of all SSRs was 241,424,069 bp, accounting for 15.62% of the genome. The frequency and density of SSRs were 2,059.64 loci/Mb and 156,158.13 bp/Mb, respectively (Table S2).
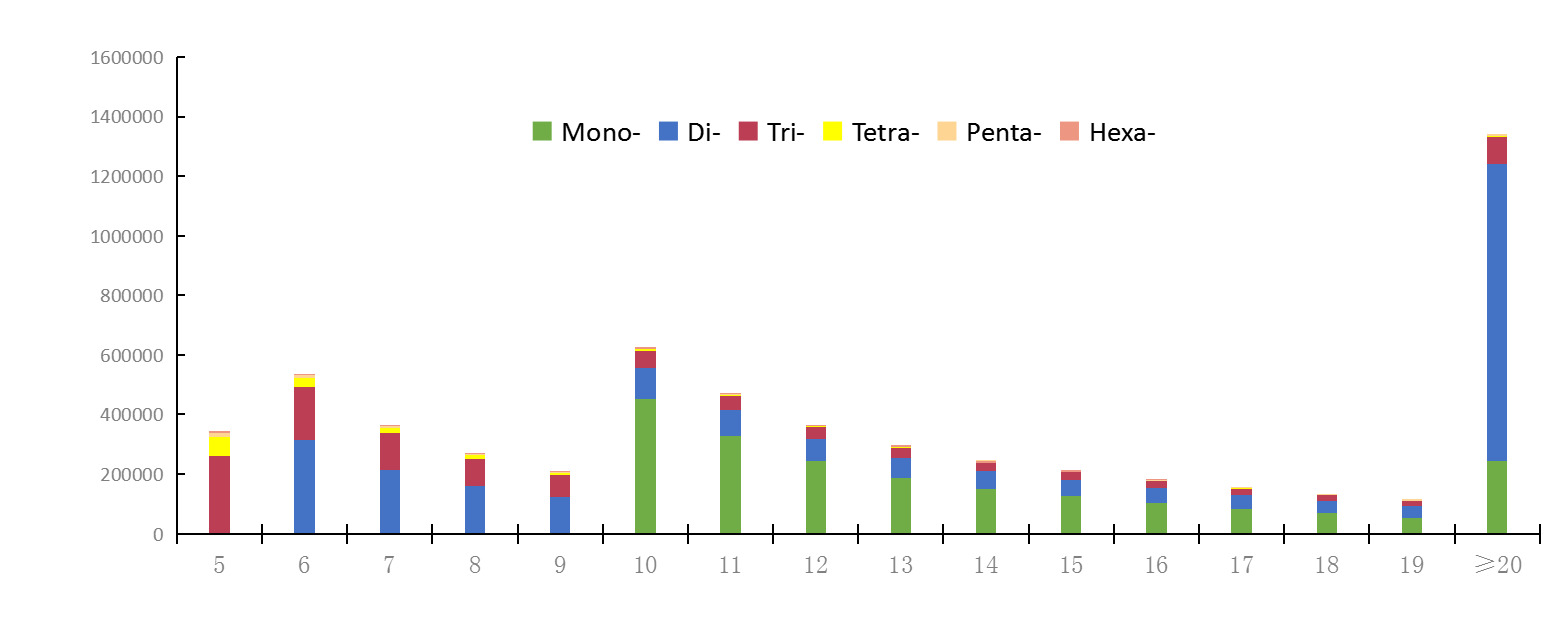
A total of 259 repeat motifs were detected, with repeat numbers ranging from 5 to 1,551 (Table S3). The abundance of SSRs was significantly negatively correlated with repeat number.
The number of SSRs with repeated 10 was the domain, followed by those with repeated 6 (Figure 1). Furthermore, a negative correlation was detected between motif length and SSR count, with longer repeat motifs corresponding to fewer total loci (Figure 1).
Among perfect SSRs, a total of 1,037,673 mononucleotide repeats were identified, accounting for 51.92% of all perfect SSRs, followed by dinucleotide repeats (643,927 loci, 32.22%) and trinucleotide repeats (257,651 loci, 12.89%) (Table 1). Only 457 hexanucleotide repeats were detected (Table 1). Mononucleotide repeats showed the highest density (4,298.13 loci/Mb), followed by dinucleotide (2,667.20 loci/Mb) and trinucleotide repeats (1,067.21 loci/Mb) (Table 1).
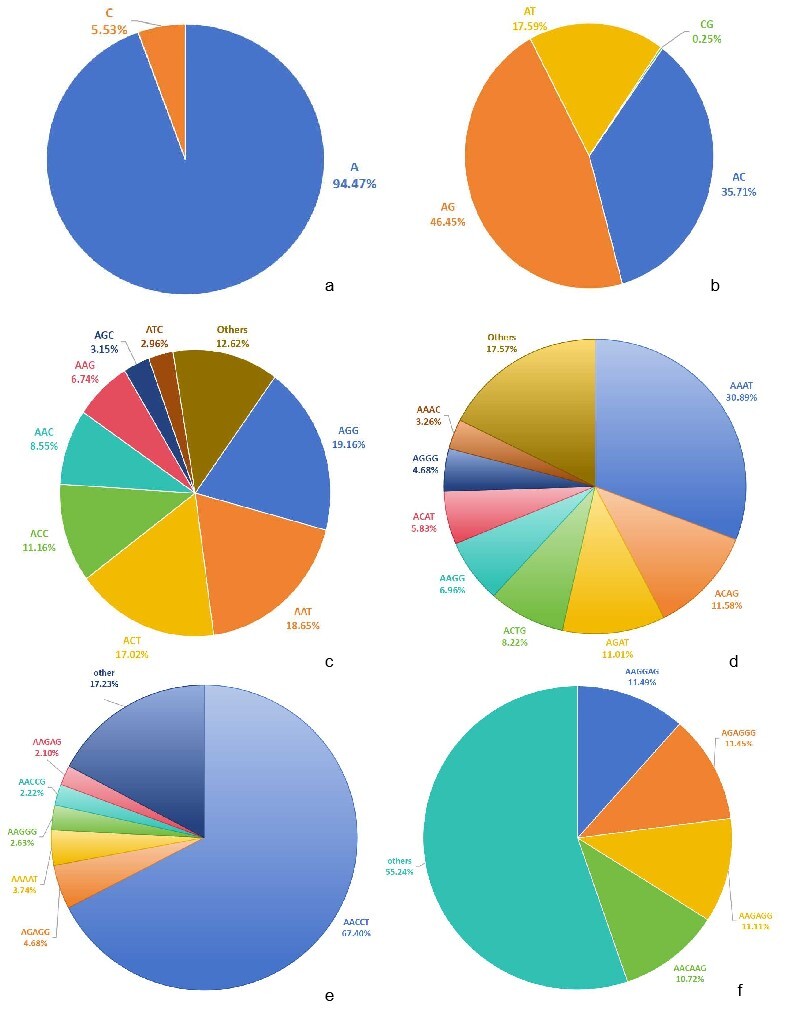
The top 10 most abundant SSR motifs were as followed: A, AG, AC, AT, AGG, AAT, ACT, ACC, C, AAC, and AAAT (Table 2). A total of 1,928,296 A was detected, accounting for 94.47% of mononucleotide repeats, whereas C accounted for only 5.53% (Table 2, Figure 2a). The frequency of A was also highest (1,247.26 loci/Mb).
Among all motifs, the dinucleotide motif AG had the longest length (52,100,292 bp) and highest density (33,699.62 bp/Mb), followed by AC motif (34,301,090 bp, 22,186.71 bp/Mb) (Table 2). AG and AC were accounted for 46.45% and 35.71% in dinucleotide, respectively (Figure 2b).
The most abundant and frequent trinucleotide was AGG (246,396, 19.16%), followed by AAT (239,814, 18.65%) (Table 2, Figure 2c). The AAT motif displayed the longest total length (7,940,709 bp) and highest density (5,136.23 bp/Mb), followed by ACT (7,916,031 bp, 5,120.26 bp/Mb) (Table 2).
AAAT was the dominant motif in tetranucleotides, accounting for 30.89%, followed by ACAG (11.58%) (Figure 2d). AACCT was the primary motif in pentanucleotide, accounting for 67.40% (Figure 2e). AAGGAGA was the most prevalent in hexanucleotide, accounting for 11.49%, followed by AGAGGG (11.45%) and AAGAGG (11.11%) (Figure 2f).


3.2. Chromosomal Distribution Characteristics of SSRs
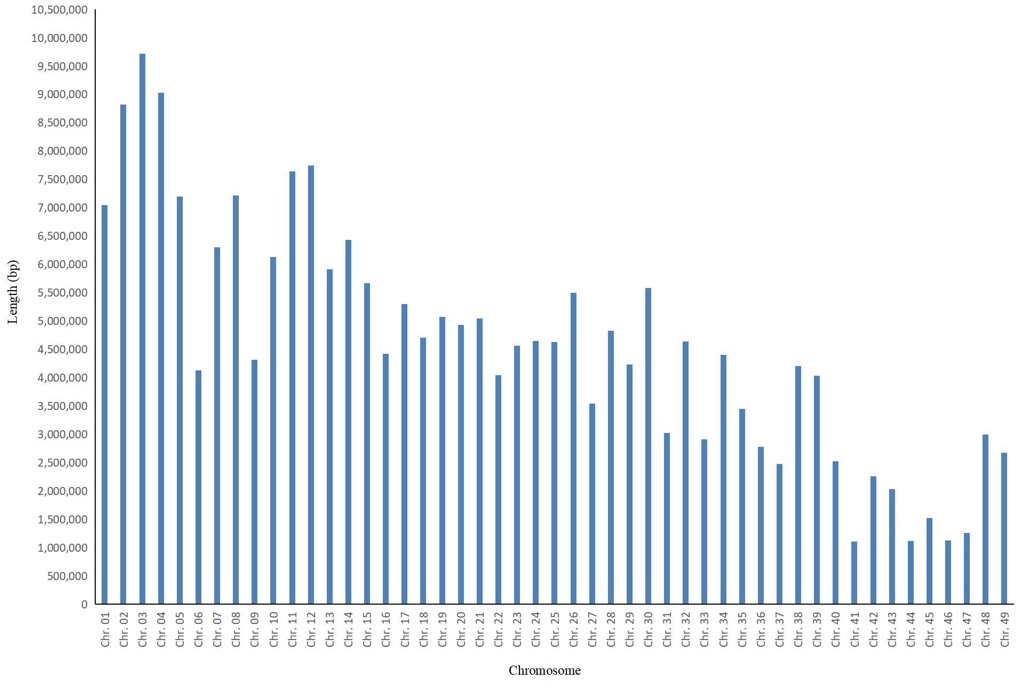
Among the 49 chromosomes of S. paramamosain, chromosome 41 exhibited the shortest total SSR length (1,099,300 bp), followed by chromosome 44 (1,117,260 bp) (Table S2, Figure 3a). Chromosome 3 harbored the largest number of SSR loci (124,426) and the longest total SSR length (9,715,090 bp), whereas chromosome 44 contained the fewest SSR loci (only 14,458) (Table S2, Figure 3b). With regard to SSR frequency, the highest value was observed on chromosome 44 (2,496.67 loci/Mb), while the lowest was found on chromosome 1 (1,565.01 loci/Mb) (Table S2, Figure 3c). For SSR density, chromosome 44 also showed the highest level (192,933.04 bp/Mb), and chromosome 1 exhibited the lowest density (119,971.87 bp/Mb) (Table S2, Figure 3d).
Correlation analysis revealed that chromosome length was significantly positively correlated with SSR locus number, total SSR length, and SSR frequency (P < 0.01), with Pearson’s correlation coefficients (r) of 0.974, 0.976, and 0.968, respectively. In contrast, no significant correlation was observed between chromosome length and SSR density. Among the four SSR-related indices (locus number, total length, frequency, and density) within individual chromosomes, only SSR locus number was extremely significantly positively correlated with total SSR length (P < 0.01), with a Pearson’s correlation coefficient (r) of 0.942.
_total_ssr_length.jpeg)
3.3. Analysis of SSR Markers in S. paramamosain
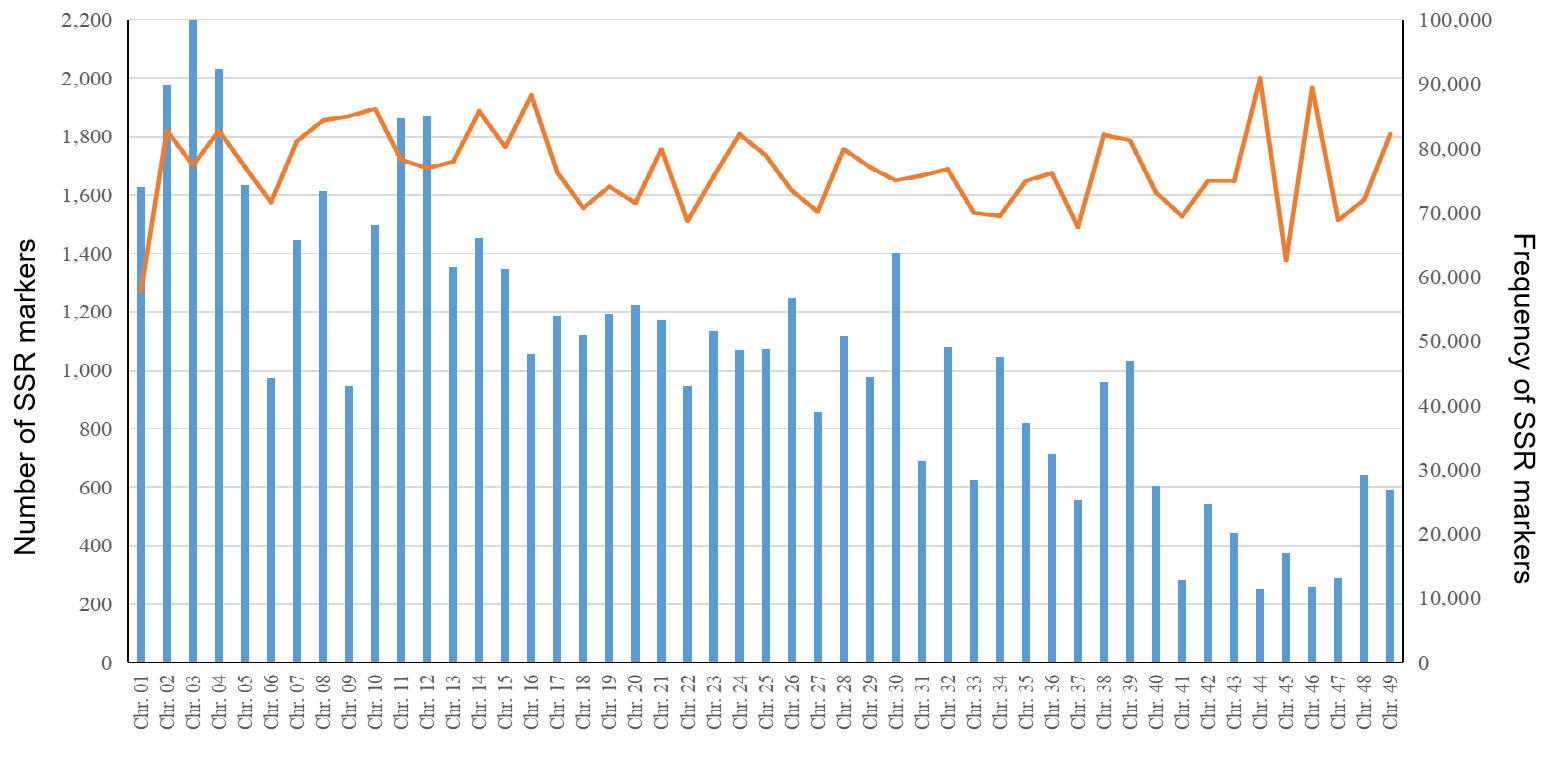
A total of 2,575,599 SSR markers were developed, including 2,382,227 markers mapped to the the 49 chromosomes and 193,372 unanchored markers that could not be assigned to specific chromosomes. On average, each chromosome contained 48,617 SSR markers, with a mean frequency of 1,687.72 loci/Mb (Table S4). Chromosome 3 harbored the largest number of SSR markers (99,894) (Figure 4, Table S4), whereas chromosome 44 contained the fewest (11,487) but exhibited the highest frequency (1,998.74 loci/Mb). Chromosome 1 displayed the lowest SSR marker frequency (1,270.07 loci/Mb) (Figure 4, Table S4). Among all developed SSR markers, 1,638,028 (63.60%) were classified as perfect SSR markers. For perfect SSR markers across the 49 chromosomes, mononucleotide were the most abundant, accounting for 30.25%–46.93%, followed by dinucleotide (12.71%–21.49%). The proportion of compound SSR markers varied from 33.65% to 37.90% across all chromosomes (Table S4).
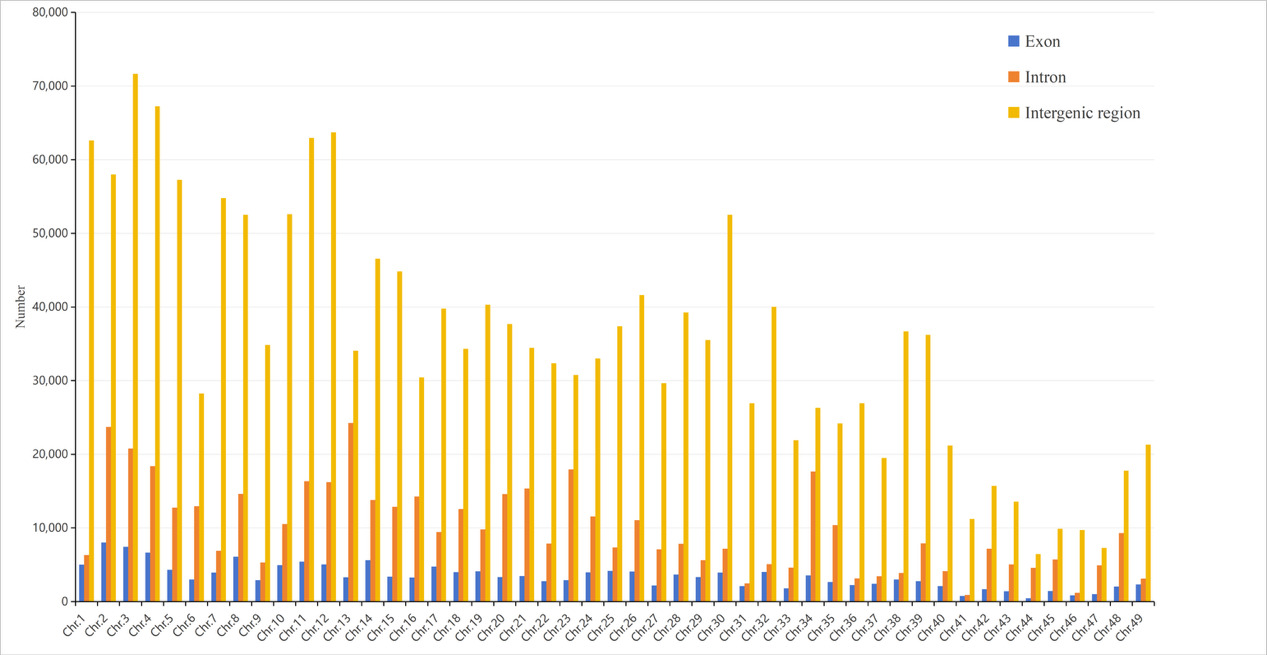
A total of 167,441, 479,767, and 1,733,881 SSR markers were localized to exons, introns, and intergenic regions, accounting for 7.03%, 20.15%, and 72.82% of the total markers, respectively (Table S5). Across the 49 chromosomes, the proportion of SSR markers in exons ranged from 3.93% to 9.45%, while the proportions of intronic and intergenic SSR markers were 7.05%–39.99% and 55.26%–87.12%, respectively (Figure 5, Table S5). Chromosome 2 contained the largest number of exon-localized SSR markers (8,004), whereas chromosome 44 had the fewest (451) (Figure 5, Table S5).
_and_frequency_(line_chart)_of_ssr_markers_on_eac.png)

3.4. Polymorphism Initially Evaluation of SSR Markers
A total of 125 pairs of SSR primers were selected and synthesized. More than 40 pairs yielded clear and reproducible target bands, and 85 pairs produced non-specific band or failed to amplify (Table S1). The genetic variation of 32 wild S. paramamosain individuals was analyzed by 8 polymorphic SSR markers. A total of 78 alleles were detected. The Na ranged from 4 to 16 (mean = 9.75). The Ne varied from 1.8788 to 9.0660, with an average of 4.7069. The Ho ranged from 0.2903 to 0.9355 (mean = 0.6532), while the He varied from 0.3421 to 0.9043 (mean = 0.70). The I ranged from 0.6999 to 2.2917 (mean = 1.658), and the PIC ranged from 0.3195 to 0.88 (mean = 0.6638) (Table 3). Of the eight SSR loci analyzed, five loci were in HWE (P > 0.05), while three loci (LG1-1, LG1-5, and LG16-2) deviated significantly from HWE (P < 0.05). Only six pairs of locus showed significant LD: LG1-1 & qxLG3-50, LG1-3 & LG1-5, qxLG16-4 & qxLG16-2, LG1-3 & LG1-1, qxLG3-50 & qxLG3-67, and LG1-5 & LG1-1. The inbreeding coefficient (FIS) ranged from −0.2384 (LG3-50) to 0.3793 (LG1-5) (Table 3).
Discussion
With the advancement of sequencing technologies and the reduction in their costs, genome sequencing and assembly have been successfully completed for numerous aquatic animal species.16,17 Leveraging genomic data, researchers can efficiently screen and develop a large number of SSR loci and molecular markers for genetic research.13,18–20 However, SSR research on S. paramamosain remains relatively scarce, with only a limited number of SSR markers identified to date.21–23 Zhao et al.2 integrated PacBio long-read sequencing and Illumina paired-end sequencing data to generate the first high-quality, chromosome-level genome assembly of S. paramamosain. In the present study, comprehensive analysis of this chromosome-level genome assembly yielded extensive SSR data, which significantly expands the genomic resources available for this species. SSR markers have been widely used in marker-assisted selection and breeding. Specifically, their applications include: 1) precise mapping and screening of functional gene loci associated with economic traits; 2) improving the accuracy of selective breeding and reducing errors in phenotypic identification; 3) accurately constructing parentage determination systems and pedigree records to avoid inbreeding depression; and 4) analyzing the genetic structure of breeding populations and optimizing breeding strategies.24
SSR markers are widely recognized as reliable molecular genetic tools, which have been extensively applied in studies of genetic diversity, population structure, and genetic breeding.5 Genome-wide SSR identification has been carried out across a wide range of plant and animal species.11,25 In this study, a total of 3,184,249 SSR loci were detected in the S. paramamosain genome, which was more than that in Eriocheir sinensis (886,782 perfect SSR)19 and less than that in Litopenaeus vannamei (9,123,781).26 The total length of SSRs in S. paramamosain was 241.42 Mb, accounting for 15.62% of the entire genome. For context, SSRs constitute 23.93% of the Penaeus vannamei genome and over 10% of the genomes of P. monodon and Marsupenaeus japonicus,27 indicating that crustaceans generally harbor a high proportion of SSRs in their genomes. The SSR frequency and density in S. paramamosain were 2,059.64 loci/Mb and 156,158.13 bp/Mb, respectively, with an average inter-locus distance of 486 bp (Table S2). Collectively, these findings demonstrate that SSR loci are highly abundant in the S. paramamosain genome, highlighting the great potential of this species for the development of robust genetic markers.
Among the SSR repeat types identified in S. paramamosain, mononucleotide repeats were the most prevalent, followed by di-, tri-, tetra-, penta-, and hexanucleotide repeats. This distribution pattern is consistent with previous observations in E. sinensis,19 mosquitoes,28 and several marine fish species.29,30 In contrast, dinucleotide repeats were more abundant than mononucleotide repeats in Pelteobagrus vachelli,14 Scatophagus argus,31 palmae,32 and peanuts,20 suggesting taxon-specific differences in SSR repeat type preferences. A motif was overwhelmingly dominant (94.47%), which may be attributed to the abundance of poly(A) tails.33 The AG motif was the most common (46.45%), followed by AC (35.71%) in dinucleotide repeats. In E. sinensis, AC was the dominant dinucleotide, followed by AG.19 Among trinucleotide, AGG was the most prevalent in S. paramamosain and E. sinensis19; however, AAT was the dominant trinucleotide motif in some fish species and mammals.18,29,34 These interspecific differences are likely driven by genomic sequence variations, evolution, and selective pressures.35
In this research, chromosome length was significantly positively correlated with the number, frequency, and length of SSR within each chromosome (P < 0.01). This result is consistent with previous fingdings in Lateolabrax maculatus,18 birds,36 and mammals.34,37,38 This correlation may be attributed to the “genome-scale dosage effect” of SSR distribution.39 First, SSR loci are not randomly distributed across chromosomes but instead exhibit a “proportional distribution” relative to chromosome length; second, longer chromosomes provide a larger physical space and are associated with higher frequencies of mutational events (e.g., DNA replication errors, unequal crossing-over), which facilitate the accumulation of SSR loci and the extension of their repeat lengths.34,37 Notably, no significant correlation was observed between chromosome length and SSR density, suggesting that SSR distribution is not only independent of chromosome size but is also influenced by regional genomic stability and repeat tolerance.
In this study, most of SSR markers (90.97%) were located in non-coding regions (introns and intergenic regions), with only 7.03% in exons. This result is also found in mosquitoes,28 birds,36 and mammals.34,40 SSRs within exons are subject to intense evolutionary selective pressure. Expansion or contraction of SSR repeats may induce frameshift mutations or amino acid substitutions, which can subsequently impair gene function or result in complete loss of function.35 By contrast, non-coding regions are subject to relatively weak functional constraints, as alterations in SSR copy number do not directly affect protein translation.6 Moreover, the fidelity of DNA repair processes is comparatively lower in non-coding regions, thereby increasing the likelihood that replication slippage events arise and become fixed within the genome.6 Certain non-coding SSRs may also confer adaptive advantages by modulating transcriptional activity, facilitating their evolutionary maintenance through positive or neutral selection.33 For instance, a (CT)n SSR located in the 5′ UTR of the IRF gene has been shown to regulate the expression level of IRF in L. vannamei.41 Similarly, a CCTTT microsatellite near exon 3 of the glyA locus may affect the transcriptional activity of glyA in Fenneropenaeus chinensis.42
The polymorphism of these SSR markers was preliminarily verified in the present study. Of the 125 SSR markers assessed, 40 (32%) produced clear and reproducible target amplicons. This proportion is consistent with that reported in Xiphopenaeus kroyeri (31.11%)43 and higher than that observed in Gammarus pulex (15.71%).44 The relatively low amplification rate observed in this study may be attributed to suboptimal primer design and quality. Due to length constraints imposed on target PCR products, the SSR-flanking sequences available for primer design were considerably restricted. Moreover, sequences containing poly runs, stable hairpin structures, or extreme AT/GC compositional bias tend to reduce the efficiency and success rate of PCR amplification. In addition, primers that produced nonspecific amplification products were excluded from further analysis.
Polymorphism rates of SSR markers in S. paramamosain were reported to be 38% and 22.91% based on polyacrylamide gel electrophoresis.22,23 In this study, capillary fluorescence electrophoresis was employed for genotyping, which provides high accuracy and sensitivity in discriminating allele size differences, thereby guaranteeing the reliability of the identified polymorphic markers.45
Our PIC results indicated that five of the SSR markers displayed high polymorphism, while the remaining three exhibited moderate polymorphism. In addition, three SSRs showed significant deviations from HWE, which may be attributed to unusually high frequencies of particular alleles or an excess of homozygotes. LD analysis further suggested that these loci may be located within the same linkage group in S. paramamosain, or influenced by evolutionary forces including natural selection, population admixture, and inbreeding.
Most SSRs of FIS > 0, indicating a slight heterozygote deficit within the population. By contrast, FIS of two loci (LG3-50 and LG16-2) < 0, implying heterozygote excess. All of results showed that no significant genetic subdivision was identified. Overall, the population exhibited a relatively homogeneous genetic structure, with only a small number of loci displaying minor genetic deviations, which may be attributed to inbreeding or selection effects.
In conclusion, this study identified and characterized a large number of genome-wide SSRs in S. paramamosain, which enriches the available genomic resources for this species. These findings will facilitate the resource management and genetic breeding of S. paramamosain.
Acknowledgments
This research was supported by the Shrimp and Crab Industry Innovation Team Project of Guangdong Province (2024CXTD25), Basic and Applied Basic Research fund of Guangdong Province (2024A1515240032), Central Public-interest Scientific Institution Basal Research Fund, South China Sea Fisheries Research Institute, CAFS (NO.2024RC10), Southern Marine Science and Engineering Guangdong Laboratory (Zhuhai) (SML2024SP003), the earmarked fund for CARS-48-21, Science and Technology Plan Project of Guangzhou (2024E04J0004 and 2025D04J0030), Science and Technology Planning Project of Guangdong Province, China (2023B1212060047), research on breeding technology of candidate species for Guangdong modern marine ranching (2024-MRB-00-001), and the Central PublicInterest Scientific Institution Basal Research Fund, CAFS (nos. 2023TD44 and 2021SD05).
Authors’ Contribution
Conceptualization: Sigang Fan (Lead). Methodology: Sigang Fan (Equal), Changhong Cheng (Equal), Minze Liao (Equal). Formal Analysis: Sigang Fan (Equal), Hongling Ma (Equal), Guangxin Liu (Equal). Writing – original draft: Sigang Fan (Lead). Writing – review & editing: Zhixun Guo (Lead). Funding acquisition: Zhixun Guo (Lead).
Supplementary Materials
Table S1 Microsatellite markers of S. paramamosain used in this study; Table S2 The character of SSRs in different chromosomes and unmapped chromosome sequences; Table S3 Summary of SSR motifs and repeats; Table S4 SSR markers counts and proportion of five motifs in each chromosome of S. paramamosain; Table S5 The distribution of SSR markers in the different regions of the S. paramamosain genome.
Competing of Interest – COPE
The authors declare that they have no known competing financial interests or personal relationships that could have influenced the work reported in this paper.
Ethical Conduct Approval – IACUC
The material of this paper does not involve ethical conflicts. We got permission to take this sample. All experimental protocols and methods in this study were approved by the Animal Care and Use Ethics Committee in the South China Sea Fisheries Research Institute (202100321m).
Informed Consent Statement
All authors and institutions have confirmed this manuscript for publication.
Data Availability Statement
Data will be made available on request.