.tif)
Introduction
Sustainable intensification offers a new approach to resolve the tensions between food security and resource-environmental constraints.1 In the aquaculture sector, this concept has been operationalized through sustainable intensive practices, as evidenced by the FAO documentation of successful cases across Asia-Pacific.2 Particularly, Recirculating Aquaculture Systems (RAS) exemplify such sustainable intensification by enabling transformative upgrades through enhanced resource efficiency, controlled environments, and advanced technologies—collectively boosting productivity while reducing ecological impacts.3
In China’s marine fish farming sector, industrialized aquaculture is predominantly practiced in regions such as Shandong, Tianjin, and Liaoning, with key species including Scophthalmus maximus, Cynoglossus semilaevis Günther (C. semilaevis), and Epinephelus spp.4 Among these, C. semilaevis has emerged as an economically vital species for coastal farmers due to its delicate flavor, high farming efficiency, and strong economic returns.5 Currently, the prevailing cultivation system for this species in China is the industrial flow-through aquaculture mode.6 However, this system is characterized by high resource consumption, low recycling efficiency, and significant environmental pressure, failing to align with sustainable intensification goals. Industrial RAS mode, conversely, not only achieve water resource recycling and reuse but also effectively mitigate wastewater discharge and pollution.7 The technological advantages of Industrial RAS mode directly decrease farmers’ reliance on water resources while enhancing operational stability, aligning better with blue transformation objectives.8 Yet, most C. semilaevis farmers persist with industrial flow-through aquaculture mode. As economically rational actors, farmers prioritize economic returns above all else. This raises a critical question: Is industrial RAS mode inherently less profitable than industrial flow-through aquaculture mode?
The economic performance of aquaculture production is influenced by multiple factors, including the quality/quantity of inputs and operational scale. According to economies of scale theory, production scale can significantly affect economic outcomes.9 Effective management is a critical prerequisite for maximizing aquaculture profitability, with its efficacy being determined by both the manager’s span of control and the production scale. However, most existing studies on the economic performance of aquaculture predominantly focus on cost-benefit analyses.10,11 Few have attempted to optimize C. semilaevis management modes or identify key factors affecting profitability through the dual perspectives of aquaculture mode and aquaculture scale, making it difficult to provide robust decision-making support for the industry’s sustainable intensification.
This study employs field survey data from C. semilaevis aquaculture operations, utilizing multivariate statistical analysis to examine the interactive effects of aquaculture mode and aquaculture scale on cost-benefit dynamics from a bioeconomic perspective. By identifying key economic performance determinants and exploring optimization pathways for industrialized aquaculture management modes under sustainable intensification requirements, the research aims to guide farmers in adopting blue transformation practices and ultimately drive high-quality development in the aquaculture sector.
Materials and Methods
Data source
The data for this study were collected between 2021 and 2024 by the Industrial Economics Research Team of the National Technology System for the Marine Fish Industry. Field interviews and questionnaires were administered to C. semilaevis farmers and enterprises in major production regions across China, including Shandong, Hebei, and Liaoning provinces. These regions were selected due to their early adoption of C. semilaevis farming, accumulated expertise, and high homogeneity in cultivation techniques and management practices. These factors ensure strong sample representativeness and comprehensively reflect current industry conditions.
An initial set of 49 survey responses was obtained. To ensure data reliability, key indicators such as costs, yields, and sales prices were cross-verified against regional market prices and typical revenue structures from industry reports during the same period.12 Through this verification process, three invalid samples that significantly deviated from actual market conditions were identified and excluded, resulting in 46 valid datasets for analysis. Literature review indicates that sample sizes in fisheries bioeconomic studies typically range from 30 to 60.13,14 However, it should be noted that although the sample size meets disciplinary norms, its spatial coverage is limited. This may hinder comprehensive representation of differences across various aquaculture regions at the national level, as well as the ability to capture dynamic changes in aquaculture economic parameters over the long term.
Variable selection
As a high-density intensive aquaculture species, the costs and profitability of C. semilaevis farming are closely tied to its biological growth characteristics. Consequently, variables in this study were categorized into three groups: biological variables, cost variables, and profitability variables. Based on relevant literature10,12 and an analysis of input variables across C. semilaevis production stages, the biological variables included stocking density and grow-out rate, while cost variables encompassed seedling cost, feed cost, labor cost, utilities cost, depreciation of fixed assets, equipment repair cost, and other costs. Profitability variables comprised total revenue, net revenue, benefit-cost ratio, and return on sales ratio. The detailed definitions of these variables are presented in Table 1.
Based on actual production conditions, this study categorized the collected samples into small-scale and large-scale farming groups using an annual production threshold of 30 tons. The aquaculture modes observed in the survey comprise industrial flow-through aquaculture mode and industrial RAS mode. Detailed classification criteria for these management modes are provided in Table 2.
Research Methods
This study employed multivariate statistical analyses—including two-way analysis of variance (ANOVA), two-way multivariate analysis of variance (MANOVA), Cobb-Douglas production function, Mahalanobis distance and Fisher’s linear discriminant analysis (LDA)—to analyze the biological, cost, and profitability variables defined in Table 1.
Two-way ANOVA was employed to examine the independent effects of aquaculture scale and aquaculture mode on C. semilaevis management and economic performance, while also investigating potential interaction effects that might influence producer profitability between two factors. In contrast, two-way MANOVA extended this approach by focusing on the combined effects of multiple independent variables.15
The Cobb-Douglas production function was applied to analyze the relationship between cost variables and total revenue in C. semilaevis aquaculture, aiming to identify specific factors influencing profitability.14 By comparing the sum of cost variable exponents to 1, we assessed whether the industry exhibited increasing returns to scale under current technological conditions and explored whether expanding cost inputs can enhance total revenue. Assuming that five cost variables significantly affect total revenue, the Cobb-Douglas production function is defined as:
TR=AC1β1C2β2C3β3C4β4C5β5
In equation (1), TR denoted the total revenue, (i=1,2,3,4,5) represented the five cost variables significantly influencing TR, and (i=1,2,3,4,5) indicated the percentage change in TR resulting from a 1% variation in cost variable where was a constant. To mitigate heteroscedasticity and increase the stability of the data, logarithmic transformation was applied to both sides of the equation, yielding the linearized form in Equation (2):
lnTR=β1lnC1+β2lnC2+β3lnC3+β4lnC4+β5lnC5+lnA
To explore the characteristics and key driving factors of different management modes for C. semilaevis, Mahalanobis distance was used to assess intergroup differences and identify the pair of groups with the greatest disparity. Fisher’s LDA was employed for dimensionality reduction and classification, as well as to identify the primary discriminant variables. Detailed methodological descriptions are provided in the Appendix.
Results
The basic data from the survey of 46 aquaculture farmers were statistically analyzed and classified according to aquaculture scale and aquaculture modes, with results summarized in Table 3.
Building on it, further statistical analysis was conducted on the data related to aquaculture management modes, yielding the characteristics of biological, cost, and profitability variables across different management modes, as shown in Table 4.
Analysis of Variance
A two-way ANOVA and a two-way MANOVA were conducted for the three categories of variables, with results presented in Tables 5 and 6.
For biological variables, the two-way ANOVA results indicated that stocking density was significantly influenced by aquaculture scale (P < 0.01) and aquaculture mode (P < 0.0001), but not by their interaction, meaning no new effect arose when both factors interacted.
Regarding aquaculture scale, small-scale aquaculture exhibited higher stocking densities than large-scale aquaculture. In terms of aquaculture mode, industrial RAS mode showed higher stocking densities compared to industrial flow-through aquaculture mode (Table 3). Among the management modes, SR demonstrated the highest stocking density at 11.07 kg/m², approximately 1.54 times that of LF. However, grow-out rate was not significantly affected by aquaculture scale, aquaculture mode, or their interaction (Table 5). The mean grow-out rates across the four management modes were comparable, with a maximum difference of 8.62% (Table 4).
From the perspective of cost variables, total costs was significantly influenced by aquaculture scale (P < 0.0001) and aquaculture mode (P < 0.05). Specifically, small-scale aquaculture exhibited higher unit total costs compared to large-scale aquaculture, and the industrial flow-through aquaculture mode had higher unit total costs than the industrial RAS mode (Table 3). Within small-scale aquaculture, the industrial RAS mode showed slightly lower unit total costs than the industrial flow-through aquaculture mode (Table 4). Regarding cost composition, the costs for seedling, feed, depreciation of fixed assets, and equipment repair were all significantly influenced by aquaculture scale, aquaculture mode, and their interaction (P < 0.05, Table 5). However, seedling cost, labor cost, and utilities cost were not significant for the interaction term, and other costs was significant only for aquaculture scale (P < 0.05,Table 5).
For profitability variables, total revenue, net revenue, and return on sales ratio were significantly influenced by aquaculture scale, aquaculture mode, and their interaction (P < 0.05). However, the benefit-cost ratio was not significant for the interaction term.In terms of aquaculture scale, large-scale aquaculture outperformed small-scale aquaculture in profitability. Regarding aquaculture mode, industrial RAS mode demonstrated superior profitability relative to industrial flow-through aquaculture mode (Table 3). Among the four management modes, LR achieved the highest profitability indicators (Table 4).
The two-way MANOVA results indicated that both sets of cost and profitability variables were significantly influenced by aquaculture scale, aquaculture mode, and their interaction across all test criteria (P < 0.01), whereas no significant interaction effects were observed for biological variables (Table 6).
Cobb-Douglas Production Function Analysis
Using the Cobb-Douglas production function, we conducted a multiple regression analysis (Table 7) with various cost variables as independent variables and total revenue as the dependent variable after logarithmic transformation. This established the production function for C. semilaevis farming industry in the main production areas, formalized in Equation (3).
lnTR=0.0680lnSC+0.1210lnFC+0.1553lnLC+0.1726lnUC+0.1408lnDFA+0.0317lnERC+3.1185
Among the cost variables examined in this study, seedling cost, feed cost, labor cost, utilities cost, depreciation of fixed assets, and equipment repair cost all demonstrated statistically significant positive effects on total revenue (P < 0.01), with elasticities of 0.0680, 0.1210, 0.1553, 0.1726, 0.1408, and 0.0317, respectively (Table 7). Specifically, labor and utilities cost had the highest elasticity coefficients, indicating that they are the primary factors influencing the total revenue of C. semilaevis farming. Other costs also had a positive effect on total revenue, though its impact was not statistically significant.
Analysis by Other Methods
Mahalanobis Distance: Specific results are shown in Table 8 (see Appendix). Based on Mahalanobis distances derived from biological variables, the lowest similarity (greatest distance: 1.8100; P < 0.05) was observed between LF and SR. Combining with Table 4, it can be seen that the grow-out rates difference between these two modes is small, while the stocking density difference is large; hence, the difference in biological performance is not highly correlated with the grow-out rate. For cost and profitability variables, the lowest similarity was found between LR and SF, with the largest distances of 2.4656 (P < 0.01) and 2.7692 (P < 0.01), respectively.
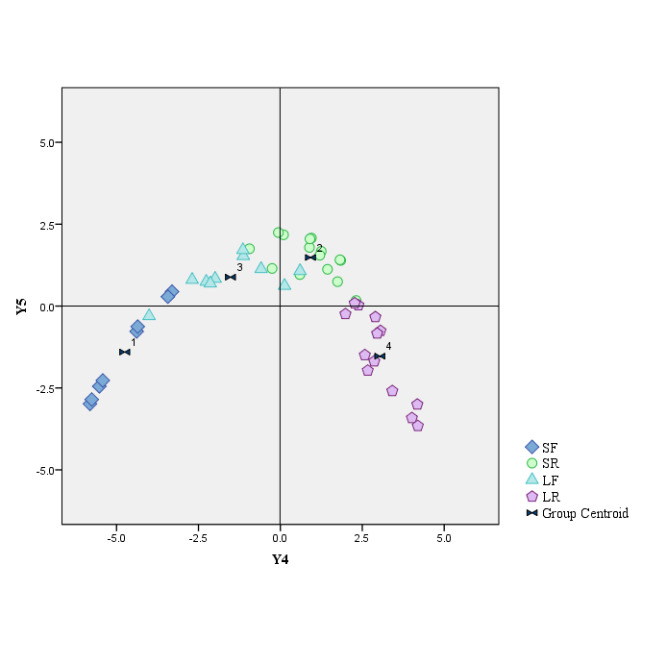
Fisher’s LDA: Using either cost variables or profitability variables, all 46 samples were successfully classified into four groups via Fisher’s LDA, with almost no overlap among the samples from different farms, indicating a clear clustering relationship. For cost variables, combined with the Mahalanobis distance results, the analysis showed that the LR is mainly located in the second quadrant, while the SF is primarily in the fourth quadrant (Figure 1, see Appendix). The main factors driving the differentiation between these two management modes were equipment repair cost and seedling cost (Table 9, see Appendix). Similarly, for profitability variables, combined with the Mahalanobis distance results, both the LR and SF are located on the negative axis of Y5 (Figure 2, see Appendix). Their differentiation is primarily determined by the Y4 axis, with the key factors being the benefit-cost ratio and the return on sales ratio (Table 10, see Appendix).
Discussion
Biological variable
In high-density intensive aquaculture, the grow-out rate determines the final harvestable quantity of marketable fish and serves as a core factor for enhancing economic returns and achieving sustainable intensification. Selecting an appropriate stocking density is often considered a key strategy to improve the grow-out rate. Taking Dicentrarchus labrax, Salmo salar, and Oncorhynchus mykiss in industrial aquaculture modes as examples, once the stocking density exceeds a specific threshold and continues to increase, the feed conversion efficiency and nutritional quality of the farmed fish often decrease significantly, ultimately affecting the final survival rate.16 However, the two-way ANOVA confirmed that stocking density, while varying significantly across modes and scales, did not exert a statistically significant influence on the grow-out rate(Table 5), which remained consistently around 29% across all groups(Tables 3 and 4). This suggests that under current production conditions, stocking density is not the primary constraint on grow-out rates.
Based on interviews with farmers and existing research, it is inferred that the key factor affecting the grow-out rate of C. semilaevis may lie in the feminization rate of its seedlings. Similar to tilapia, C. semilaevis also exhibits significant sexual growth dimorphism. In natural populations, existing research demonstrates that conventional seedlings typically yield only about 10%-30% female fish, with significant growth sexual dimorphism - females grow 2-4 times faster than males.17 Furthermore, unidirectional natural sex reversal during nursery phases converts some females into pseudomales, further reducing female proportions in production systems.18 The dual challenges of slow male growth and male-biased populations severely constrain farm productivity and profitability, representing a critical bottleneck for sustainable intensification. Farmer interviews revealed that most operations cull portions of male seedling during nursery phases to concentrate female cultivation, ensuring economic viability. This practice explains why all four management modes achieved comparable final grow-out rates, independent of aquaculture scale, aquaculture mode, or their interactions. To improve C. semilaevis grow-out rate and advance sustainable intensification goals, we recommend farmers adopt high-quality seedlings like the “Tayou No.1” variety. Studies show that this variety not only demonstrates faster growth rates and stronger disease resistance, but can also increase the proportion of physiological female fish to approximately 40%.19 Concurrently, researchers are advised to focus on breakthroughs in feminization rates of C. semilaevis seedling, aiming to further increase the proportion of physiological female fish while maintaining or enhancing the growth speed and disease resistance advantages of “Tayou No.1”. These advancements will accelerate China’s development as a global leader in industrial C. semilaevis aquaculture.
Cost variable
Effective cost management constitutes a foundational pillar for enhancing competitiveness and advancing sustainable intensification in modern production systems. Research demonstrated that LR exhibited significantly lower unit production costs than the other three management modes (Table 4). A cost composition analysis across all C. semilaevis farms exhibited that feed cost represented the largest share of total production expenditures. This phenomenon aligns with the general rule observed in the intensive aquaculture of species such as Lateolabrax maculatus and rainbow trout, where feed constitutes the largest cost item.10,11 From the perspective of aquaculture modes, industrial RAS mode incurred substantially lower expenditures on seedling and feed compared to the industrial flow-through aquaculture mode. This is likely because the RAS maintains a stable water recirculation rate of 10-17 times per day, ensuring optimal water flow dynamics. This characteristic helps slow down the accumulation of solid feed residues in fish tanks and lowers the FCR, thereby significantly improving feed utilization efficiency and growth performance.20 As a result, the production of C. semilaevis in the industrial RAS mode has increased substantially, with lower unit seedling cost and unit feed cost. Of course, this advantage may also be partly attributed to the more sophisticated management equipment typically associated with this mode.
However, industrial RAS mode demonstrated slightly higher costs in depreciation of fixed assets, labor cost, equipment repair cost, and utilities cost compared to industrial flow-through aquaculture mode. The reasons for this can be attributed to several factors. First, the industrial RAS mode is equipped with a more complex set of facilities, such as microfilters, protein skimmers, and biological filters, which are expensive and require a higher level of expertise from the staff of the farm. Consequently, the industrial RAS mode incurred higher depreciation of fixed assets, equipment repair cost, and labor cost compared to industrial flow-through aquaculture mode. This is similar to the report by Badiola et al., where high initial investment and the demand for specialized manpower are common challenges faced by the RAS mode.21 However, while some studies suggest that industrial RAS mode offer advantages in electricity, water, and coal savings compared to industrial flow-through aquaculture mode,6,20 its actual performance often falls short of theoretical potential due to operational challenges. The technical sophistication of RAS requires specialized knowledge, which often exceeds the skill set of available farmers, creating a fundamental mismatch. This discrepancy compels a reversion to traditional, often manual, management practices. Such a downgrade in management ultimately creates a performance bottleneck that caps the system’s potential efficiency. It is recommended that future aquaculture farmers hire employees with higher educational attainment and provide regular training to enhance their professional skills. This will help fully leverage the green, efficient, and economical performance of industrial RAS mode and advance sustainable intensification in the fisheries. To this end, it is suggested that the government establish a specialized subsidy for talent in RAS technology, offering direct financial support or tax reductions to farms that conduct skill certification training. This will alleviate the financial burden on aquaculture farmers, accelerate the cultivation of professional talent, and provide a strong human resource foundation for the efficient operation of industrial RAS mode. Secondly, a seven-month tracking experiment demonstrated that the optimal stocking density for industrial RAS mode is 8.96 kg/m² to achieve the best aquaculture performance.22 However, field survey data revealed that many farmers who chose industrial RAS mode maintain stocking densities exceeding this recommended threshold. Higher stocking densities lead to increased concentrations of metabolic waste such as ammonia nitrogen, phosphorus, and nitrite in the water, resulting in more severe pollution.23 To mitigate the biological impacts of this pollution, farmers must increase water circulation frequency and the number of pumps to improve water quality, which consequently significantly raises electricity cost. Therefore, it is recommended that farmers adjust stocking densities to the advised level of 8.96 kg/m2 according to their actual conditions. This measure not only effectively reduces metabolic waste concentrations, alleviates water pollution, and improves the aquaculture environment, but also decreases electricity expenses and optimizes production costs, thereby achieving dual enhancement of both economic and ecological benefits while promoting sustainable intensification.
The theory of economies of scale suggests that the aquaculture scale of farms significantly influences input-output efficiency in the production process,9 which aligns with the findings of this study: under large-scale farming conditions, all unit cost inputs (except depreciation of fixed assets) were lower than those in small-scale farms (Tables 3 and 4), demonstrating superior performance. This phenomenon can be explained by the cost-sharing benefits and improved production efficiency derived from economies of scale.
Profitability variables
Profitability provides the economic foundation for sustainable intensification and serves as a key driver for building a fisheries powerhouse. The two-way ANOVA results indicated that both aquaculture scale and aquaculture mode significantly influenced all profitability indicators (Table 5). Among the four management modes, LR mode achieved the highest profitability, a success attributable to the dual advantage of economies of scale and the precision offered by RAS technology. From the perspective of aquaculture scale, profitability analysis indicated that small-scale farms had higher stocking densities and similar grow-out rates, thereby yielding higher unit revenues compared to large-scale farms. However, the theory of economies of scale suggests that large-scale farms inherently possess advantages in achieving lower unit costs. Furthermore, their ability to market larger batches of mature fish in a single cycle provides farmers with stronger negotiating leverage. Consequently, after deducting all production costs, large-scale farms ultimately showed superior performance in net revenue, benefit-cost ratio, and return on sales ratio compared to small-scale farms. From the perspective of aquaculture modes, Tables 3 and 4 demonstrated that industrial RAS mode outperform industrial flow-through aquaculture mode across all profitability variables. This difference may be related to the capacity for precise control over the culture cycle and time to market. Existing studies experimentally demonstrated that under identical environmental conditions, C. semilaevis cultured in RAS exhibit approximately 20% faster growth rates. When combined with large-scale farms, this approach can reduce the production cycle by at least two months.24Therefore, farmers adopting RAS are able to more precisely plan the growth stages and market timing of fish. Utilizing RAS technology to achieve off-season production or precisely timed market entry in order to obtain price premiums is a common strategy in international high-end aquaculture. The early market entry of fish products creates temporary scarcity in market supply, capitalizing on the prevalent consumer preference for freshness and the inelastic seasonal demand in seafood consumption. This timing disparity in supply weakens buyer bargaining power, resulting in a short-term seller’s market structure. Within this structure, where supply is lower than demand, producers gain price-setting power, enabling them to secure market premiums above the equilibrium price. However, the high initial investments and technical complexity of industrial RAS mode create significant adoption barriers. Capital-constrained farmers often persist with traditional industrial flow-through aquaculture mode, triggering an adverse selection problem akin to a “lemons market”. To counteract this, we recommend that relevant authorities should substantially increase RAS subsidies to reduce transition costs, incentivize green technology adoption, and ensure the sustainability of industrial upgrading.
Cobb-Douglas Production Function
In the fisheries sector, particularly in aquaculture, advancing sustainable intensification efforts primarily depends on enhancing economic efficiency, with accurate identification of key influencing factors being critically important. Within this context, the proper application of the Cobb-Douglas production function provides aquaculture operators with a robust analytical tool to achieve this goal. The analysis identified labor and utilities costs as the most influential drivers of total revenue, with the highest output elasticities. This finding highlights that under current practices, revenue generation depends more on managerial effectiveness achieved through skilled labor for biological oversight, and on system efficiency gained via optimized energy and water use, than on marginal increases in feed inputs that are already near-optimal.
Furthermore, the study found that the overall production elasticity coefficient of seven cost factors was 0.6894 (<1), indicating that the C. semilaevis industry is currently in a stage of decreasing returns to scale—where the proportional increase in output is lower than the increase in factor inputs—a trend counterproductive to sustainable intensification. However, from the perspective of unit costs, the industry still exhibits certain economies of scale, but this potential is constrained by multiple factors. This coexistence of diminishing returns to scale and economies of scale in unit costs may reflect that the industry is in a transition period from traditional to modernized modes, where improvements in management and technological capabilities have not yet fully kept pace with the expansion in scale. Field research revealed that farmers faced a dual challenge of insufficient working capital and a shortage of young and middle-aged labor under the current unpredictable market conditions. At present, the workforce in C. semilaevis aquaculture is predominantly composed of employees aged 55 and above. As this aging labor force experiences declining innovation capacity, reduced efficiency in information acquisition and dissemination, and a narrowing span of effective management, operational costs are likely to rise and operational efficiency may decrease to some extent. Consequently, it is recommended that farmers drive industrial transformation and upgrading through technological innovation, management optimization, and labor structure improvements to break through the constraints of diminishing returns and propel the aquaculture sector toward resilient and sustainable development.
To sum up, the main conclusions of this research are as follows: First point, among the four management modes, LR aligns most closely with strategic goals for sustainable intensification, demonstrating significant advantages. For C. semilaevis, this mode not only achieves optimal economic returns and profitability but also optimizes resource utilization and reduces environmental impacts, making it the best choice for farmers. In contrast, SF underperform across all metrics, with equipment repair cost, seedling cost, benefit-cost ratio, and return on sales ratio identified as the primary differentiating factors. Second point, grow-out rate is a critical determinant of economic efficiency in C. semilaevis farming, and the feminization rate of seedlings is the key factor influencing grow-out rate. Enhancing feminization rates should be a priority for scientific research and technology promotion. Third point, labor cost affects the biological management quality of C. semilaevis aquaculture, while utilities cost influences the facility operational efficiency of the farm. These two factors collectively determine final production yields and are the dominant drivers of total revenue. Finally, during the study period, the C. semilaevis industry exhibited diminishing returns to scale from the perspective of overall input-output elasticity, yet benefited from lower unit costs at larger scales, indicating persistent economies of scale in cost efficiency.
Acknowledgments
This study was supported by the National Modern Agricultural Industry Technology System (CARS-47-G29), National Natural Science Foundation of China General Program (72573107). The authors would also like to thank the farmers for participating in the interviews and for providing valuable information on C. semilaevis farming. The authors wish to express their sincere gratitude to the anonymous reviewers whose valuable suggestions greatly improved this paper.
Authors’ Contribution
Conceptualization: Zhengyong Yang (Equal), Yongai Guo (Equal). Writing – review & editing: Zhengyong Yang (Equal), Yongai Guo (Equal), Zhipeng Hao (Equal). Funding acquisition: Zhengyong Yang (Lead). Resources: Zhengyong Yang (Lead). Supervision: Zhengyong Yang (Lead). Methodology: Yongai Guo (Lead). Formal Analysis: Yongai Guo (Equal), Zhipeng Hao (Equal). Investigation: Yongai Guo (Equal), Zhipeng Hao (Equal). Writing – original draft: Yongai Guo (Lead).
Competing of Interest – COPE
The authors declare that they have no known competing financial interests or personal relationships that could have appeared to influence the work reported in this paper.
Informed Consent Statement
All authors and institutions have confirmed this manuscript for publication.
Data Availability Statement
The data are available from the authors on reasonable request.
.tif)