1. Introduction
Copper was confirmed as an essential nutrient in the animal body in 1928.1 Copper plays a pivotal role in iron absorption and metabolism, and is indispensable for the synthesis of hemoglobin and erythrocyte maturation.2 Functioning as a structural component of metalloenzymes, copper directly participates in critical metabolic pathways such as the respiratory complex IV, cytochrome C oxidase, and the antioxidant enzyme superoxide dismutase 1.3 Furthermore, copper is integral to osteogenesis, as well as the biosynthesis of collagen and elastin, which are fundamental to connective tissue integrity.4
Poor copper nutrition in fish can lead to adverse symptoms. For example, Yellow catfish (Pelteobagrus fulvidraco) have shown that the growth rate is slow when copper is deficient in the diet.5 Zinc superoxide dismutase and cytochrome C oxidase activities were significantly reduced in catfish (Ictalurus punctatus) fed diets containing 0 or 2 mg/kg supplemental copper, compared to those fed diets with ≥4 mg/kg supplemental copper.6 Dietary copper deficiency may be associated with symptoms of reduced immunity. Alkaline phosphatase (ALP) and acid phosphatase (ACP) activities were also found to be reduced in blunt snout bream (Megalobrama amblycephala) when dietary copper was low.7 Simultaneously, as a heavy metal, copper also has some toxicity. When animals consume and absorb excess copper beyond their physiological capacity, it accumulates in tissues such as the liver, from which the overloaded copper ions are subsequently released into the blood and interact with other biological macromolecules in the body, including enzymes and nucleic acids, interfering with the body’s normal physiological functions and causing copper poisoning. For example, when Nile tilapia (Oreochromis niloticus) were fed a diet containing 1095 mg/kg of copper, the growth of the fish was significantly lowered and the number of red blood cells, hemoglobin, and hematocrit of the fish were also significantly reduced,8 while 2000 mg/kg induced chromosomal aberrations in head kidney cells.9
However, to date, no studies have reported the optimal dietary copper requirement for bighead carp. Although substantial research has been conducted on copper requirements of aquatic species with different feeding habits—for example, carnivorous large yellow croaker (Larimichthys crocea) juveniles are reported to require 5–7 mg/kg dietary copper,10 while omnivorous common carp (Cyprinus carpio) require only 2.19–2.91 mg/kg11—the filter-feeding bighead carp exhibits distinctive copper utilization patterns. Its specialized feeding mechanism—filtering plankton through gill rakers—may result in significantly different copper bioavailability in the digestive tract compared to species with other feeding habits.1 Thus, it is challenging to apply copper recommendations for other fish species to precisely design feed formulations for bighead carp.
In the present work, different levels of CuSO₄·5H₂O were added to the diet to investigate the effects of dietary copper on growth performance, nutrient composition, tissue copper content, serum indices, and digestive enzyme activity. This study aimed to determine the optimal dietary copper requirements for bighead carp.
2. Materials and Methods
2.1. Preparation of Experimental Diets
In this study, casein, soybean meal, starch, soybean oil, and corn oil were used as the main raw materials to prepare the basal diet. The experimental diets were formulated by supplementing the basal diet with copper sulfate pentahydrate (CuSO4·5H2O) to achieve six graded copper levels: 0 (control, L1), 3 (L2), 6 (L3), 12 (L4), 24 (L5), and 48 (L6) mg/kg. The copper content in the six kinds of diets was determined by a graphite furnace atomic absorption spectrometer (Z2000, Hitachi, Tokyo, Japan) to be 2.49, 5.15, 7.99, 14.11, 25.75, and 49.21 mg/kg. The ingredients used in this investigation and the proximate composition of the basal diet are presented in Table 1. The raw materials were crushed through a 60-mesh sieve, then mixed with approximately 20% water and homogenized in a stepwise manner. The mixture was granulated into 2 mm diameter pellets, air dried, and then sealed in a refrigerator at -20°C until use.
2.2. Management of Experimental animals
Experimental juvenile bighead carp were obtained from the farm in Huanggang City, Hubei Province, China, and were transported to the Hubei Key Laboratory for Animal Nutrition and Feed Science. After disinfection, they were temporarily cultured and acclimated for 16 days. After acclimatization, 900 juvenile bighead carp (initial mean weight: 1.40±0.04 g) with healthy bodies, complete fins, and similar specifications were randomly divided into 6 groups with 3 replicates per group and 50 fish per replicate, using a computer-generated random number table. The fish were placed in 18 cylindrical buckets, and the culture experiment was conducted using the recirculating aquaculture system. The fish were fed regularly twice a day (8:30 and 18:00), and the food residues were removed when the fish were satiated. The water temperature was maintained at 30±3.2°C, the dissolved oxygen was 7-8.5 mg/L, the pH was 7.0-7.7, ammonia nitrogen and nitrite were below 0.2 mg/L, and the copper content in the recirculating water was 2.43-3.72 μg/L. The feeding trial lasted for 67 days.
2.3. Sample Collection
At the end of the rearing experiment, the fish were starved for 24 hours. The number and total mass of experimental fish in each aquarium were recorded for the calculation of weight gain rate (WGR) and specific growth rate (SGR). Five fish were randomly selected from each bucket, weighed, and stored in a -20°C refrigerator for basic compositional analysis of the whole fish. After randomly weighing five fish per bucket, the head length, body length, and body height were measured. The visceral mass and liver were then separated and weighed. Finally, the dorsal muscle above the lateral line scale was removed and placed in a 2 mL centrifuge tube for the analysis of the basic muscle components. Five fish per aquarium were randomly dried and used for the copper content in bighead carp. Blood was collected from the tail vein of the remaining experimental fish for the determination of blood physiological and biochemical indices. Whole blood was collected using sodium heparin anticoagulant tubes, mixed immediately, and stored at 4°C for hematological analysis. For serum preparation, blood samples were collected in non-anticoagulant tubes, allowed to stand at room temperature for 30 minutes, and then centrifuged at 3000×g for 15 minutes. The supernatant was aliquoted and stored at -80°C for subsequent biochemical parameters. After blood collection, gills, livers, intestines, and muscles were removed, and the remaining parts were placed in boiling deionised water to isolate the vertebrae.
2.4. Measurement of Indicators
2.4.1. Determination of Essential Nutrients
The contents of moisture, crude protein, crude fat, and crude ash were determined by the constant temperature drying weight loss method at 105±2°C, the Kjeldahl nitrogen determination method, the Soxhlet extraction method and the combustion method at 550°C (AOAC 1984), respectively.
2.4.2. Determination of Copper Content
The determination of copper content in whole fish, muscle, vertebral column, liver, intestine, and gills was carried out according to ISO 6869:2000. Homogenized dried samples (1g) were ashed in a muffle furnace for 6h. The ash was digested in 5 mL of concentrated HNO₃ at 70°C for 3h, then acidified with 3mL of 2N HCl for 40 min. The solution was diluted to 50mL with distilled water. Copper concentration was measured using an atomic absorption spectrophotometer-graphite furnace (Z2000, Hitachi, Tokyo, Japan).
2.4.3. Serum Biochemical Indices
After thawing of serum samples frozen at -80°C at 4°C, CHEMIX-800 is used to measure the content of calcium (Ca), phosphorus (P), total protein (TP), albumin (ALB), triglycerides (TG), total cholesterol (T-CHO) and blood glucose (Glu) and the activities of aspartate aminotransferase (AST), alanine aminotransferase (ALT) and alkaline phosphatase (ALP). The reagents used were purchased from Sysmex. White blood cell (WBC), red blood cell (RBC), haemoglobin (HGB) and erythrocyte specific volume (HCT) contents were measured using an automated blood cell analyser.
2.4.4. Determination of Intestinal Digestive Enzyme Activity
The frozen samples were thawed at 4°C, then homogenised with 0.9% normal saline in a 1:9 ratio, and the supernatant was collected for measurement after centrifugation. Intestinal amylase and lipase activities were analyzed using commercial assay kits (Nanjing Jiancheng Bioengineering Institute, China) following the manufacturer’s protocols.
2.5. Statistical Analysis
The experimental design employed three biological replicates, with all measured indicators subjected to three technical replicate determinations within each biological replicate. All data are presented as mean ± S.E. (standard error of the mean). All data were first subjected to Shapiro-Wilk test for normality and Levene’s test for homogeneity of variance, followed by analysis using one-way analysis of variance (ANOVA) and Tukey’s multiple comparison test with SPSS (SPSS Company, New York, USA). The significant difference was set at P < 0.05.
3. Results
3.1. Growth Performance
WGR and SGR exhibited significant dose-dependent responses to dietary copper supplementation (Table 2). Compared to the control, all experimental groups showed markedly elevated WGR and SGR (P<0.05). Notably, the L4 achieved peak WGR and SGR, surpassing other groups (P<0.05). While WGR did not differ significantly among L2, L3, L5, and L6 (P>0.05), SGR in L4 was significantly higher than L1-L3 and L5 (P<0.05). HSI and VSI exhibited a bell-shaped curve, peaking at L3 and L4. Both HSI and VSI in copper-supplemented groups (L2-L6) were significantly elevated compared to the control (P<0.05). The highest HSI and VSI were observed in L3 and L4, respectively, though no significant intergroup differences occurred among L2-L6 (P>0.05). Body height/body length ratios in L2 and L6 were significantly reduced relative to L1 (P<0.05). No significant variations were detected in condition factor (CF) or head length/body length across all groups (P > 0.05). Notably, a small number of individuals with body surface deformities were observed in groups L5 and L6 during the middle to late stages of aquaculture.
Using the data in Table 2, with WGR and SGR as dependent variables and dietary copper levels as independent variables, a broken line regression analysis was conducted and the regression equation obtained was as follows: yWGR1=51.213x+627.11 (R2=0.845), yWGR2= -5.468x+1320.2 (R2=0.2971) and ySGR1=0.0678x+3.0431 (R2=0.8078), y SGR2=-0.006x+3.9382 (R2=0.2774). According to the above regression equations, the optimum dietary copper requirement of bighead carp (initial mass: 1.40±0.04 g) was 12.23 mg/kg and 12.13 mg/kg, respectively, when the maximum WGR and SGR were obtained.


3.2. Whole Fish and Muscle Composition
The effects of different dietary copper levels on the nutritional components of whole fish and muscle are shown in Table 3 and Table 4, respectively. There were no significant differences in the crude protein, crude fat, crude ash, and moisture content of whole fish and muscle among all groups (P>0.05).
3.3. Copper Content in Tissue
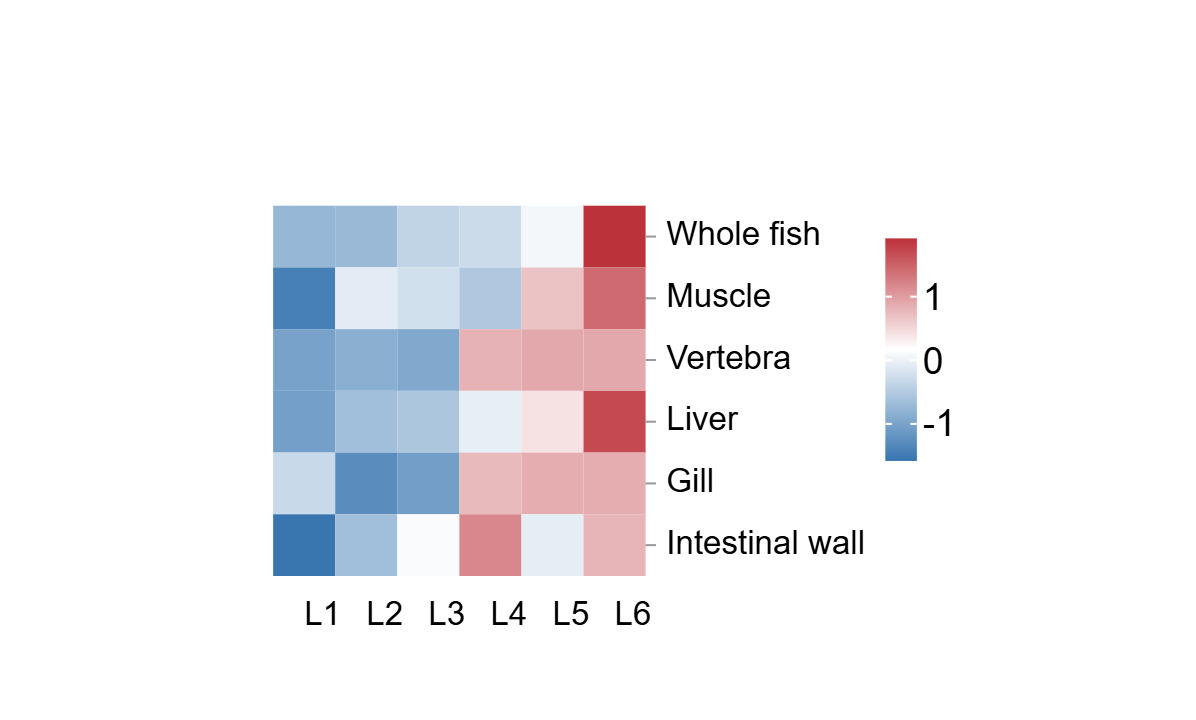
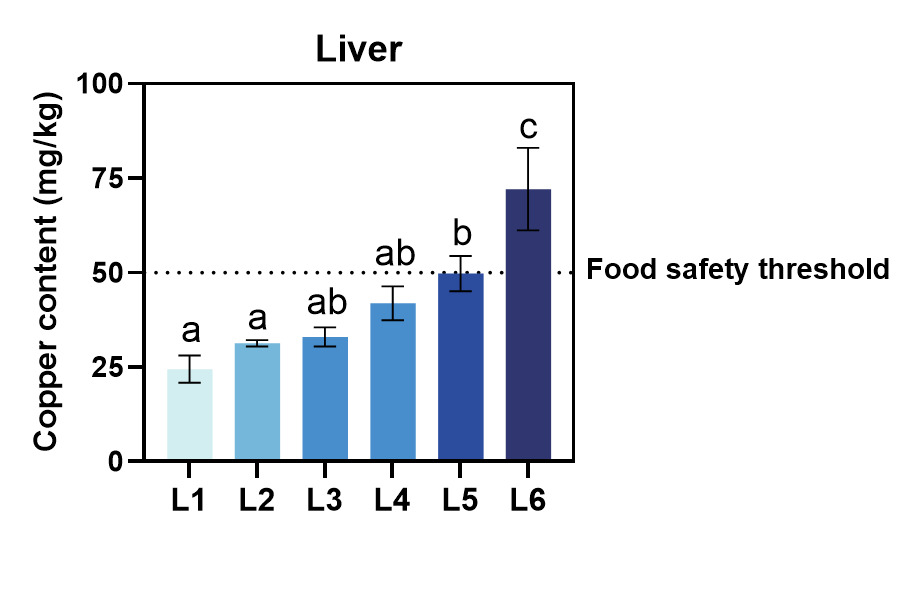
As shown in Table 5 and Figure 1 copper accumulation exhibited tissue-specific dynamics: liver > intestinal wall > vertebrae > gill > muscle, while the whole fish average was positioned between the liver and intestinal wall in this gradient. Liver copper retention surged at L5 and L6, surpassing the food safety threshold of 50 mg/kg for aquatic products according to the Safety requirements for agricultural product-Safety requirement for non-environmental pollution aquatic products and Limit of toxic and harmful substances in pollution-free food and aquatic products (Figure 2), while the control group maintained a baseline level of 24.43 mg/kg. Whole fish copper content increased progressively with dietary copper levels, reaching the highest concentration in the L6, which was significantly elevated compared to all other groups (P<0.05). A transient peak in intestinal wall copper content was observed at the L4, suggesting a saturation of intestinal absorption capacity at intermediate dietary copper levels. Despite these variations, no significant differences in intestinal copper content were detected among L2-L6 (P>0.05). Vertebral copper accumulation was markedly higher in L4-L6 than in L1-L3 (P<0.05), reflecting dose-dependent mineral deposition. Gill copper content displayed a biphasic trend, initially decreasing and subsequently increasing with higher copper supplementation. Compared to the control, gill copper levels in L4-L6 were significantly elevated (P<0.05), whereas L1-L3 showed no notable differences (P>0.05). Muscle tissue demonstrated minimal copper deposition even at the maximum dose, adhering to food safety standards.
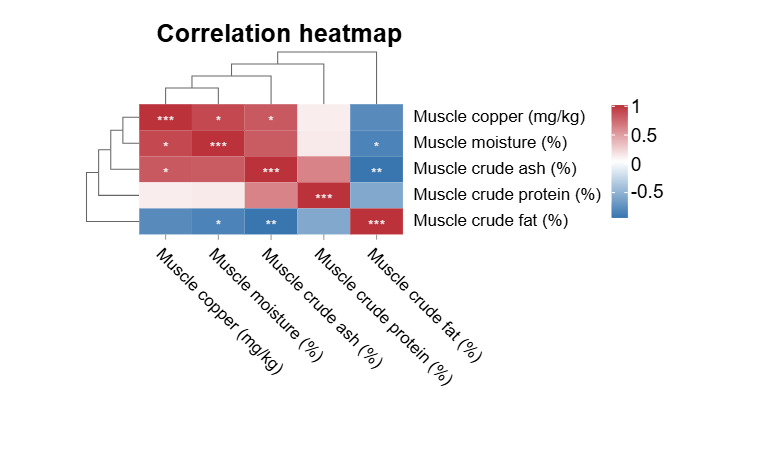
The correlation, as indicated by the Pearson correlation coefficient among muscle copper, muscle crude protein, muscle crude fat, muscle crude ash, and muscle moisture is illustrated in Figure 3. Muscle copper content exhibits a significant positive correlation with muscle moisture and muscle crude ash (P<0.05). Muscle crude fat exhibits a significant negative correlation with muscle crude ash and muscle moisture (P<0.05).

3.4. Serum Biochemical Indices
Dietary copper levels exhibited selective effects on serum biomarkers in bighead carp (Table 6). Serum TP and ALB remained unaffected across all groups (P>0.05). Hepatic function improved with copper supplementation, as evidenced by reduced AST activity in L2, L4-L6 compared to the control (L1) (P<0.05). ALT activity followed a biphasic trend, declining to the lowest level in L5 and rising in L6, with L5 significantly lower than L1-L3 and L6 (P<0.05). ALP activity was suppressed in control, but enhanced in copper-supplemented groups, peaking at L6 (P<0.05). Lipid metabolism intensified at moderate copper doses, with TC and TG in L3-L4 surpassing the control (P<0.05). Serum GLU decreased significantly in L4 compared to L1 (P<0.05). Ca and P levels peaked in L4, with L2-L4 showing marked elevation over the control (P<0.05). Copper supplementation enhanced hematopoiesis. WBC counts rose dose-dependently, reaching the highest level in L6, while the control was significantly lower (P<0.05). RBC counts and HGB in L2-L3 and L6 exceeded the control (P<0.05), though no differences were observed between L4 and L5 (P>0.05). HCT mirrored this trend, with L2 and L6 outperforming the control (12.20%) (P< 0.05).
3.5. Digestive Enzyme
Dietary copper levels significantly modulated digestive enzyme profiles in bighead carp (Table 7). Intestinal amylase activity was highest in the control group, surpassing all copper-supplemented groups (P<0.05). L4 exhibited the lowest amylase and lipase activities, which were significantly reduced compared to other groups (P<0.05). Lipase activity in experimental groups remained suppressed relative to the control group. The amylase and lipase activities in the copper-supplemented group generally exhibited a pattern of initial decline followed by an increase.
4. Discussion
4.1. Effects of Different Dietary Copper Levels on Growth Performance of Bighead Carp Larvae
Previous studies have demonstrated that dietary copper supplementation enhances growth in marine and freshwater fish, including juvenile grouper (Epinephelus malabaricus)13 and yellow catfish (Pelteobagrus fulvidraco).5 Aligning with these findings, our study revealed significantly higher WGR and SGR in copper supplemented groups compared to the control group. Broken-line regression identified an optimal dietary copper level of 12.13–12.23 mg/kg for juvenile bighead carp (initial mass: 1.40 g), which is comparable to the requirements of Atlantic salmon (Salmo salar, 5–10 mg/kg)14 and beluga sturgeon (Huso huso, 10.3 mg/kg).15 When a peak was observed at L4, the SGR at L5 declined, likely due to oxidative stress and mitochondrial function impairment induced by excessive copper in the feed. Copper significantly inhibited the activities of amylase and lipase, leading to reduced energy metabolism and ultimately suppressing growth performance.16 Notably, interspecies comparisons require considering the unique filter-feeding physiology of bighead carp. As a filter-feeding fish, it ingests plankton via gills, leading to distinct copper bioavailability compared to carnivores and omnivores.17 Unlike grouper or sturgeon, which primarily rely on intestinal absorption, bighead carp acquires copper via both branchial uptake and intestinal absorption, contributing to higher requirements. This adaptation enhances trace element uptake, explaining why its optimal copper level (12.13-12.23 mg/kg) exceeds that of common carp (2.19-2.91 mg/kg) despite similar habitats. The increase in HSI may reflect enhanced functional metabolism or pathological alterations. In this study, the HSI values in the copper supplementation groups were significantly higher than those in the control group, with peaks observed in L3 and L4. The elevated HSI in the low-to-medium copper dose groups primarily manifested as a functional adaptation, whereas the highest dose may be accompanied by subclinical pathological changes. Further histological analyses, such as H&E staining and transmission electron microscopy, are needed to clarify the nature of hepatomegaly. VSI in the control group was significantly lower than in the copper supplemented groups. This contrasts with studies on common carp (Cyprinus carpio), where copper nanoparticles did not alter VSI.11 The observed discrepancies may stem from differences in fish size, experimental duration, or environmental conditions. Excessively high copper content in the feed, such as 25.75 mg/kg in group L5 and 49.21 mg/kg in group L6, may lead to deformities through toxic effects and disruption of other mineral metabolism. As a heavy metal, high-concentration copper may stimulate the nervous and muscular systems of fish, causing abnormal muscle contraction or developmental disorders, resulting in deformities such as body surface curvature and lateral line abnormalities.18 Excessively high copper content in the feed may disrupt the metabolic balance of minerals such as calcium and phosphorus, affecting normal skeletal development and leading to body shape deformities.19
4.2. Effects of Different Dietary Copper Levels on Whole Fish, Muscle Components and the Content of Copper in Tissues
In this experiment, there were no significant differences in whole fish and muscle composition between all the experimental groups. These results are consistent with the effects of copper on juvenile large yellow croaker.10 However, other studies have shown that the effects of dietary copper content on Nile tilapia (Oreochromis niloticus),20 juvenile yellow catfish,5 and juvenile beluga15 had significant effects on body composition. This may be due to differences in fish species, size, and rearing environment.
The content of trace elements in animal bodies and tissues is an important index for assessing the dietary requirements of these trace elements.21 The liver has a high storage capacity for heavy metals in animals and can act as a detoxification organ in the body when heavy metal levels in the body are high.22 The high storage capacity of copper in the liver is the physiological protection mechanism of fish. When the amount of copper consumed by fish exceeds the requirement for body growth but does not cause body poisoning, the copper content of the liver will double, thus reducing the toxicity of the fish and playing the function of detoxification. When the amount of copper consumed by the fish is insufficient, the copper stored in the liver is released to supply the body’s growth and metabolism.23 In our study, the copper content in the liver of fish increased significantly with higher dietary copper levels, demonstrating this protective function. Specifically, the liver copper content nearly doubled from 24.43 mg/kg in L1 to 49.75 mg/kg in L5 and further increased to 72.11 mg/kg in L6. This substantial increase aligns with the notion that the liver can store excess copper to prevent systemic toxicity, thereby acting as a detoxification organ. These findings underscore the liver’s role in safeguarding fish health by managing copper overload. In this study, hepatic copper overload in high copper groups may affect growth by inducing oxidative stress, and subsequent studies could measure oxidative stress indicators such as MDA and SOD.
The copper content of fish bodies can also be used as a reference index to assess the copper requirements of fish.10,24 Studies on juvenile grouper13 and Atlantic salmon14 showed that the copper levels in juvenile grouper increased with increasing dietary copper levels. When dietary copper levels exceed 500 mg/kg, whole fish copper levels in Atlantic salmon continue to increase. Lee & Shiau25 found that copper levels in juvenile grass shrimp (Penaeus monodon) also increased with increasing dietary copper levels. The copper content in whole fish showed a significant increasing trend with the experimental groups, ranging from 3.91 to 12.48 (mg/kg). This gradual rise in copper accumulation indicates that the fish body’s copper content is closely related to the dietary copper level. Specifically, the notable differences among groups suggest that the whole fish copper content can serve as a sensitive reference index to assess the copper requirements of fish. In this experiment, the content of copper in the intestinal wall first increased and then decreased with an increase in dietary copper content, and the intestine had the best digestion of dietary copper when the dietary copper content was 14.11 mg/kg. In this experiment, with increasing dietary copper content, the copper content in vertebral bone increased continuously, and the copper content in muscle first increased, then stabilized, and then continued to increase. This may be related to the level of copper in the diet, the different types of fish and the size of the fish. Some studies have shown that gill copper content increases with increasing copper levels in the aquatic environment, and there is a linear correlation.26 The results of this study are consistent with this. The intestinal tract plays an important role in the regulation of metal uptake in fish . The significant positive correlation between muscle copper content and moisture, crude ash (P<0.05), may be related to copper’s involvement in mineral metabolism. As a coenzyme for metalloenzymes, copper can affect the deposition of minerals such as calcium and phosphorus, thereby regulating cellular hydration balance.27 The negative correlation between crude muscle fat and moisture, crude ash content conforms to the general rule of fish muscle composition; lipid accumulation may occupy the space of water and minerals, and this pattern has also been observed in mirror carp (Cyprinus carpio) (unpublished data).
4.3. Effects of different dietary copper levels on blood physiological and biochemical indexes
Hematological parameters in fish serve as critical biomarkers for evaluating systemic metabolism, nutritional homeostasis, and disease susceptibility. Variations in these parameters provide insights into physiological adaptations, pathological states, and xenobiotic toxicity.28 AST and ALT are the main enzymes indicators of liver function. When liver function is normal, the activities of serum AST and ALT in the blood remain very low; however, when liver cells are damaged, AST and ALT from the liver enter the blood, resulting in increased activities of AST and ALT in the blood. The higher the activity of AST and ALT, the greater the effect on liver damage.29 When the liver is damaged, the TP levels in the blood fall sharply.30 ALP is a pivotal enzyme in metabolic processes and plays an important role in nutrient absorption and utilisation.19 In this study, dietary copper significantly increased ALP activity in bighead carp. This may reflect copper’s roles in enzyme function and liver health. However, excessive copper could cause oxidative stress and liver damage.31 Future work should explore these mechanisms further. Serum TC and TG levels are important indicators that reflect lipid metabolism and are closely related to energy metabolism.32 Blood glucose levels are an indicator of the body’s glucose metabolism33 and are also used as an indicator of fish response to environmental stressors.34 Copper serves as a cofactor for cytochrome c oxidase and superoxide dismutase, both of which are crucial for mitochondrial ATP production.35 It may influence glucose metabolism by modulating the activity of key enzymes involved in gluconeogenesis and glycolysis.36 In this study, the AST/ALT activity in the L4 group was significantly lower than the control group, accompanied by enhanced hemoglobin synthesis, without displaying typical liver damage characteristics. The decline in GLU in the copper-supplemented group likely reflects an optimized adjustment of metabolic pathways. Copper maintains iron metabolism homeostasis, which is beneficial for haemoglobin synthesis and red blood cell maturation.37 When copper is deficient, the synthesis of haemoglobin is impaired, which can lead to a shortened lifespan of the red blood cells.38
Dietary copper (CuSO₄·5H₂O) supplementation significantly elevated ALP activity (P<0.05), indicating enhanced nutrient absorption and utilization efficiency. Contrasting with previous findings in common carp (Cyprinus carpio)11 and grass carp (Ctenopharyngodon idella),23 where copper showed no impact on serum AST, ALT, TC, or Glu. Slightly different from the above results, serum AST activity exhibited a significant decrease, while ALT activity in groups L1, L2, and L6 was markedly higher compared to L3-L5. Concurrently, GLU levels in L4 declined significantly, whereas TC and TG showed a notable increase. Kim & Kang23 in their studies on juvenile rockfish (Sebastes schlegeli) found that dietary copper levels had no significant effect on red blood cells volume and haemoglobin concentration in juvenile rockfish. Similar results were found in the Nile tilapia study.20 In contrast to the above results, it was concluded in this experiment that the addition of copper (CuSO4·5H2O) to the diet could increase the content and volume of red blood cells in the blood and promote the synthesis of haemoglobin. This may be related to the species, age, dissolved oxygen in the environment, copper content, method of determination, fish body feeding, exercise, stress, and other aspects. Further experimental verification is therefore required. Previous studies have shown that copper interacts synergistically and antagonistically with other micronutrients such as iron and zinc. Changes in serum biochemical indices in this study may be related to copper’s effects on the absorption and metabolism of other trace elements.36
4.4. Effects of Different Dietary Copper Levels on Intestinal Digestive Enzyme Activities
The activity of digestive enzymes may, to some extent, reflect the digestive capacity of the body. For juvenile grass carp (Ctenopharyngodon idella), copper enhanced lipase activities while suppressing amylase.39 The results of this experiment were consistent with those above, but there were also differences. When the amount of copper added to feed was 7.99-25.75 mg/kg, the activity of amylase and lipase in the intestine of bighead carp was inhibited. The inhibitory effect of copper on digestive enzymes may be associated with copper accumulation in the intestinal wall, suggesting the need for further examination of changes in intestinal tissue structure. The suppression of amylase and lipase activities could lead to reduced digestion and absorption of carbohydrates and fats, respectively, potentially impacting the growth performance and overall health of the fish. It is worth noting that the effects of copper on digestive enzymes may vary among different fish species and at different life stages, which necessitates further research to establish species-specific and stage-specific dietary copper requirements for optimal digestive health and growth performance. Additionally, the mechanisms underlying the copper-induced changes in digestive enzyme activities warrant further investigation to understand better the biological processes involved.
Acknowledgments
The authors are grateful to provide funds by COFCO Feed Co. Ltd and Hubei Key Laboratory of Animal Nutrition and Feed Science.
Authors’ Contributions
Writing – original draft: Huizi Ji (Equal), Xinyuan Li (Equal). Writing – review & editing: Huizi Ji (Lead). Methodology: Hong Li (Lead). Funding acquisition: Liming Zhang (Equal), Li Ma (Equal). Conceptualization: Feng Huang (Lead).
Ethical Approval
The study was approved by Animal welfare ethics committee of Wuhan Polytechnic University (WPU201806002).
Informed Consent Statement
Not applicable.
Conflicts of Interest
The authors declare that they have no conflicts of interest.
Data Availability
The data used to support the findings of this study are available from the corresponding author upon request.