

1. Introduction
The Japanese eel (Anguilla japonica) is an economically important aquaculture species in East Asia, and is highly valued for its unique flavor and nutritional quality.1,2 With the continued depletion of wild glass eel resources, eel production has become increasingly dependent on intensive aquaculture systems.3 However, one of the major bottlenecks in current eel farming is the pronounced growth heterogeneity among individuals within the same cohort.4–7 This substantial size divergence complicates farm management, reduces production efficiency, and lowers economic profitability.
In A. japonica culture, this heterogeneity is often manifested by the presence of extremely slow-growing individuals, commonly referred to as growth-retarded or stunted eels, which may account for 10–20% of the cultured population.4 These fish typically exhibit reduced growth performance, poor feed intake, and limited body mass gain, leading to considerable economic losses. Previous physiological studies have associated this stunting phenotype with impaired digestive capacity. In particular, activities of key digestive enzymes in the intestine are reduced in slow-growing individuals, suggesting compromised nutrient digestion and assimilation.8 In addition, these individuals show altered endocrine and metabolic characteristics, including reduced gh expression, disturbed protein and lipid metabolism, elevated glucose levels, abnormal transaminase activities, and dysregulated appetite-related gene expression.4,8 Although these findings provide important evidence for systemic physiological disturbance, the downstream molecular mechanisms by which these alterations are translated into reduced somatic growth remain insufficiently understood.
Skeletal muscle is the largest tissue compartment in fish and the principal site for protein accretion, making it a major determinant of growth performance.9,10 As the terminal effector tissue of the growth hormone/insulin-like growth factor (GH/IGF) axis, skeletal muscle integrates nutritional, endocrine, and metabolic signals to regulate protein synthesis, tissue accretion, and structural development.11 In addition to reflecting anabolic status, muscle transcriptomic responses may also reveal stress-induced metabolic reprogramming or structural remodeling associated with poor growth.12 Therefore, investigating gene expression changes in skeletal muscle can provide direct insight into the molecular basis of growth divergence in A. japonica.
RNA sequencing (RNA-seq) has become a powerful tool for dissecting the molecular basis of complex traits. In aquaculture species, comparative transcriptomic studies have been widely used to characterize regulatory networks associated with growth variation.13–16 In many aquaculture species, fast-growing phenotypes are commonly associated with elevated expression of genes involved in cell proliferation, muscle development, and nutrient metabolism, whereas slow-growing phenotypes tend to exhibit transcriptional signatures related to stress responses, catabolic regulation, and reduced anabolic activity.17–21 These observations suggest that growth retardation is not simply a consequence of insufficient nutrient supply, but may also involve the reallocation of cellular resources toward maintenance, stress adaptation, and other non-growth processes.
Because commercial A. japonica aquaculture still relies largely on wild-caught glass eels, reducing growth heterogeneity through selective breeding remains difficult at present. Consequently, mitigation of growth retardation in A. japonica will depend largely on improved husbandry practices and targeted nutritional interventions. However, developing such strategies requires a clearer understanding of the molecular bottlenecks that constrain growth in slow-growing individuals. To address this gap, the present study used RNA-seq to compare the dorsal muscle transcriptomes of fast- and slow-growing A. japonica. By profiling global gene expression differences in muscle, this study aimed to determine whether growth retardation is associated with altered regulatory pathways and biological processes in A. japonica. These findings provide a molecular framework for understanding growth heterogeneity in A. japonica. They may support the future development of precision feeding and management strategies to reduce size disparity in aquaculture production.
2. Materials and Methods
2.1. Experimental Animals and Rearing Conditions
Juvenile A. japonica was sourced from the Weishan Hu Modern Fishery Industrial Park. A total of 100 healthy, uniformly sized individuals were selected and acclimatized for one week in a recirculating aquaculture system (RAS) at the Binhai Aquaculture Cooperative of Shanghai Ocean University. The RAS was equipped with circular tanks (3.0 m diameter, 1.0 m water depth). Throughout the acclimation and subsequent experimental periods, water quality was strictly monitored and maintained under the following conditions: temperature at 28.0 ± 0.5 °C, dissolved oxygen levels consistently above 7.0 mg/L, pH between 6.8 and 7.2, total ammonia nitrogen below 0.3 mg/L, and nitrite nitrogen below 0.1 mg/L, subjected to a natural photoperiod.
Following the acclimatization phase, the 100 eels were randomly distributed into four uniform cylindrical net cages (80 cm in diameter, 60 cm in height) suspended within the RAS tanks, with 25 fish per cage. Prior to allocation, each fish was individually weighed, yielding an initial average body weight of 22.88 ± 1.11 g and a coefficient of variation of 4.99% ± 0.32%. The feeding trial was conducted over an 8-week period, adhering to the dietary regimen previously established by Zeng et al.8 Fish were fed a commercial formulated diet (Fuzhou Haima Feed Co., Ltd., Fujian, China) twice a day (at 08:00 and 18:00) to apparent satiation, with the daily ration exceeding 5% of their total body mass.
2.2. Sampling Strategy
At the end of the 8-week trial, all experimental fish were subjected to a 24 h fasting period to ensure complete emptying of the gastrointestinal tract. Subsequently, the eels were anesthetized using a 100 mg/L MS-222 solution (Sigma, Ronkonkoma, NY, USA) and their final body weights were individually recorded. To investigate the molecular mechanisms driving growth divergence while minimizing potential tank effects, an extreme-phenotypic-sampling approach was applied. Individuals with the highest and lowest final body weight in each cage also exhibited the most divergent growth rates, validating their classification as phenotypically extreme individuals. From each of the four replicated cages, one eel representing the maximum body weight (designated as the fast-growing group, FGE) and one eel representing the minimum body weight (designated as the slow-growing group, SGE) were selected among the extremes. Dorsal white muscle tissues were swiftly dissected from these selected FGE (n = 4) and SGE (n = 4) individuals, immediately snap-frozen in liquid nitrogen, and stored at −80 °C until further RNA extraction and molecular analysis.
2.3. Transcriptomic Analysis
2.3.1. Total RNA Extraction and Quality Assessment
Total RNA was extracted from the dorsal muscle tissues using TRIzol® reagent (Qiagen, Duesseldorf, Germany) according to the manufacturer’s instructions. RNA concentration and purity were accurately assessed using a NanoDrop 2000 spectrophotometer (Thermo Fisher Scientific, USA). RNA integrity number (RIN) was evaluated via an Agilent 2100 Bioanalyzer (Agilent Technologies, CA, USA), ensuring that only high-quality RNA samples (RIN ≥ 8.3) were utilized for library construction.
2.3.2. cDNA Library Construction and Sequencing
Sequencing libraries for the FGE and SGE groups were generated using the standard Illumina TruSeq RNA Sample Preparation Kit. High-throughput sequencing was executed by Majorbio Bio-Pharm Technology Co., Ltd. (Shanghai, China) on an Illumina NovaSeq 6000 platform, generating 150 bp paired-end reads.
2.3.3. Raw Data Processing and Genome Mapping
Raw reads in fastq format were initially processed using fastp (https://github.com/OpenGene/fastp) to remove adapters, poly-N sequences, and low-quality reads, thereby yielding high-quality clean reads. The resulting clean reads were then mapped to the A. japonica reference genome (NCBI accession number GCA_025169545.1) using HISAT2.
2.3.4. Expression Quantification and Differential Expression Analysis
Before identifying differentially expressed genes (DEGs), Pearson correlation analysis and Principal Component Analysis (PCA) were conducted to assess intra-group consistency across biological replicates. One sample from each group was identified as a significant outlier displaying high spatial dispersion. To strictly ensure data reliability and group homogeneity, these two outlier samples were excluded from the dataset. Consequently, downstream differential expression and functional enrichment analyses were performed based on a robust sample size of n = 3 per group.
Gene and transcript expression levels were quantified using RSEM (http://deweylab.github.io/RSEM). Differential expression analysis between the FGE and SGE groups based on raw read counts was performed using the DESeq2 R package (http://bioconductor.org/packages/stats/bioc/DESeq2). To capture a comprehensive biological network while filtering out minor fluctuations, genes meeting the criteria of a raw P-value < 0.05 and | log2(fold change) | ≥ 1 were used as the initial screening criteria for differentially expressed genes (DEGs). This threshold balances sensitivity and stringency to retain candidate genes associated with growth divergence while limiting excessive filtering.
Subsequently, to minimize potential false discovery rate (FDR) and identify biologically coordinated networks, a strict adjusted P-value (Padj) < 0.05 (Benjamini and Hochberg’s approach) was employed as the significance threshold for the global Gene Ontology (GO) and Kyoto Encyclopedia of Genes and Genomes (KEGG) pathway enrichment analyses. DEGs with Padj < 0.05 were considered highly significant and used for downstream functional enrichment to ensure robust and reproducible biological inference.
2.3.5. Expression Pattern Clustering and Trend Analysis
To further elucidate the dynamic expression patterns of DEGs between the FGEs and SGEs, combined clustering and trend analyses were conducted. The transcript abundance (FPKM values) of DEGs was transformed using Z-score normalization. Subsequently, K-means clustering and hierarchical clustering were applied via the Majorbio Cloud Platform to partition the DEGs into 10 distinct sub-clusters based on their expression profiles. For each identified sub-cluster, independent KEGG and GO functional enrichment analyses were performed using a raw P-value < 0.05 to identify specific biological functions closely associated with distinct expression trends.
2.4. Quantitative Real-Time PCR (qRT-PCR) Validation
To technically validate the reliability and reproducibility of the RNA-seq data, five DEGs highly associated with growth and metabolic traits were selected for qRT-PCR analysis. Specific primers were designed using Primer Premier 6.0 software based on the obtained transcriptome sequences (Table 1) and synthesized by Sangon Biotech Co., Ltd. (Shanghai, China). First-strand cDNA was synthesized from 1.0 μg of total RNA (the same RNA aliquots used for RNA-seq) utilizing the SweScript All-in-One RT SuperMix for qPCR kit (Servicebio, Wuhan, China). The qRT-PCR assays were conducted in a 15.0 μL reaction volume containing 7.5 μL of 2 × Universal Blue SYBR Green qPCR Master Mix, 0.75 μL of each forward and reverse primer (2.5 μmol/L), 2.0 μL of cDNA template, and 4.0 μL of nuclease-free water. The thermocycling protocol consisted of an initial denaturation at 95 °C for 30 s, followed by 40 cycles of amplification (95 °C for 15 s, 60 °C for 30 s). To confirm the amplification specificity, a melting curve analysis was performed from 65 °C to 95 °C with a heating rate of 0.5 °C/s. The β-actin gene was selected as the endogenous internal control. All samples were run in technical triplicates, and relative mRNA expression levels were calculated using the 2-ΔΔCt method. Standard curves were constructed to determine amplification efficiency, and all genes exhibited satisfactory efficiency ranging from 95% to 105%, with R2 > 0.99, confirming their suitability for the 2−ΔΔCt method.
2.5. Statistical Analysis
All statistical analyses for physiological parameters and qRT-PCR validation were performed using SPSS Statistics version 26.0 (IBM Corp., Armonk, NY, USA), and data visualizations were generated using GraphPad 10.0 (GraphPad Software, San Diego, CA, USA). Quantitative data are presented as means ± standard error (SE). Prior to hypothesis testing, all data were assessed for normal distribution using the Shapiro-Wilk test and for homogeneity of variances using Levene’s test. Since the comparison involved two independent groups (FGE versus SGE), an independent-samples Student’s t-test was used to determine statistical significance. A probability value of P < 0.05 was considered statistically significant.
3. Results
3.1. Transcriptome Sequencing and Sample Clustering
Eight dorsal muscle tissue samples (four FGEs and four SGEs) were initially subjected to RNA sequencing. Following stringent quality filtering and preliminary PCA clustering, one outlier from each group was excluded to guarantee biological consistency. Ultimately, high-quality clean data from the remaining six samples (FGE, n = 3; SGE, n = 3) were utilized for comprehensive transcriptomic profiling, generating a total of 45.73 Gb of clean data.
As summarized in Table 2, the number of clean reads obtained from the FGE samples ranged from 45,291,342 to 55,043,644, with an average GC content of 50.80%. Correspondingly, the SGE samples produced between 51,911,940 and 52,795,506 clean reads, with an average GC content of 50.33%. The percentage of Q30 bases exceeded 96.52% across all samples, indicating excellent sequencing reliability and data integrity.
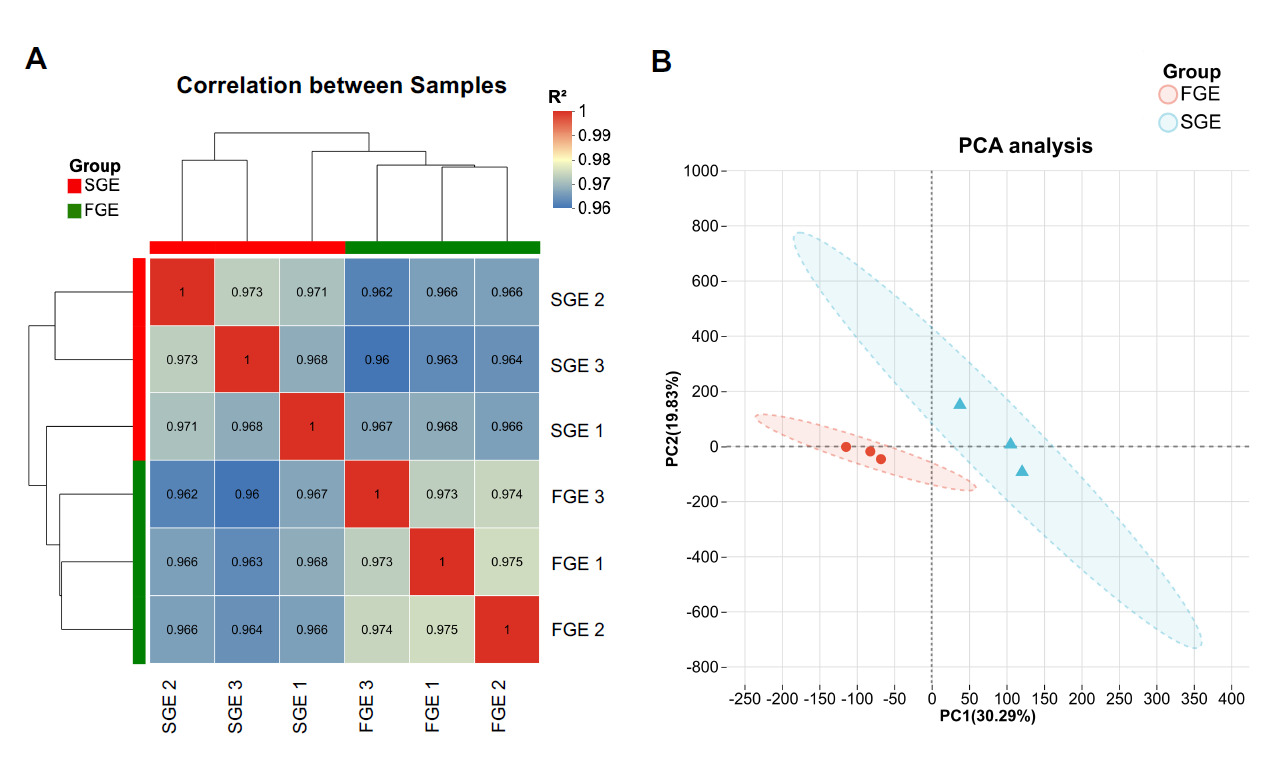
To assess the reliability of biological replicates, Pearson correlation analysis was conducted. As shown in Fig. 1A, the correlation coefficients (R²) between intra-group samples were all remarkably high (> 0.96), indicating excellent reproducibility. Furthermore, PCA analysis demonstrated a clear and distinct spatial separation between the FGE and SGE groups along the first principal component (PC1, 30.29%), confirming that the transcriptome profiles of the two groups were fundamentally divergent (Fig. 1B).
3.2. Identification of Differentially Expressed Genes (DEGs)
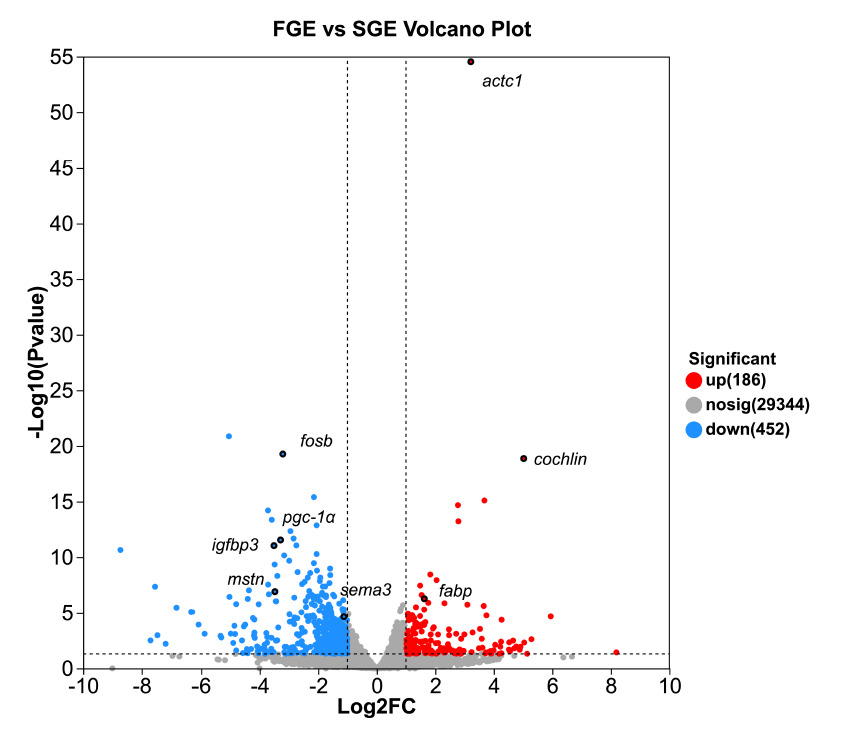
Differentially expressed genes between the FGE and SGE groups were identified using the thresholds of a raw P-value < 0.05 and |log₂ (Fold Change) | ≥ 1. Under these criteria, a total of 638 DEGs were robustly detected, comprising 186 upregulated and 452 downregulated genes in the FGE group compared to the SGE group (Full DEGs list see Supplemental Table S1). The distribution of these DEGs is visualized in the volcano plot (Fig. 2), which highlights several key regulatory genes of specific interest, including the highly significant differential expression of igfbp3, mstn, fosb, fabp and actc1.
_in_dorsal_muscle_between_the_fge_and.png)
3.3. Gene Expression Pattern Clustering and Sub-cluster Enrichment
To decipher the coordinated regulatory networks underlying growth divergence, a combined expression trend clustering and pathway enrichment analysis (P < 0.05) was performed on the 638 DEGs (Fig. 3). The clustering analysis partitioned the DEGs into 10 distinct sub-clusters based on their highly synchronized expression profiles across the FGE and SGE groups.

As visualized in the combined heatmap and trend plots, genes within specific clusters exhibited completely opposing expression trajectories between the two groups. Notably, sub-clusters characterized by high expression in the SGE group and suppressed expression in the FGE group were predominantly enriched in signaling and regulatory cascades, particularly the Circadian rhythm, PPAR signaling pathway, and p53 signaling pathway. Conversely, sub-clusters exhibiting upregulated expression specifically in the FGE group were predominantly enriched in muscle structural assembly (Cardiac muscle contraction) and comprehensive nutrient metabolic networks. These robust metabolic cascades included Valine, leucine and isoleucine biosynthesis, Glycine, serine and threonine metabolism, Cysteine and methionine metabolism, and Starch and sucrose metabolism.
3.4. Gene Ontology (GO) Functional Annotation
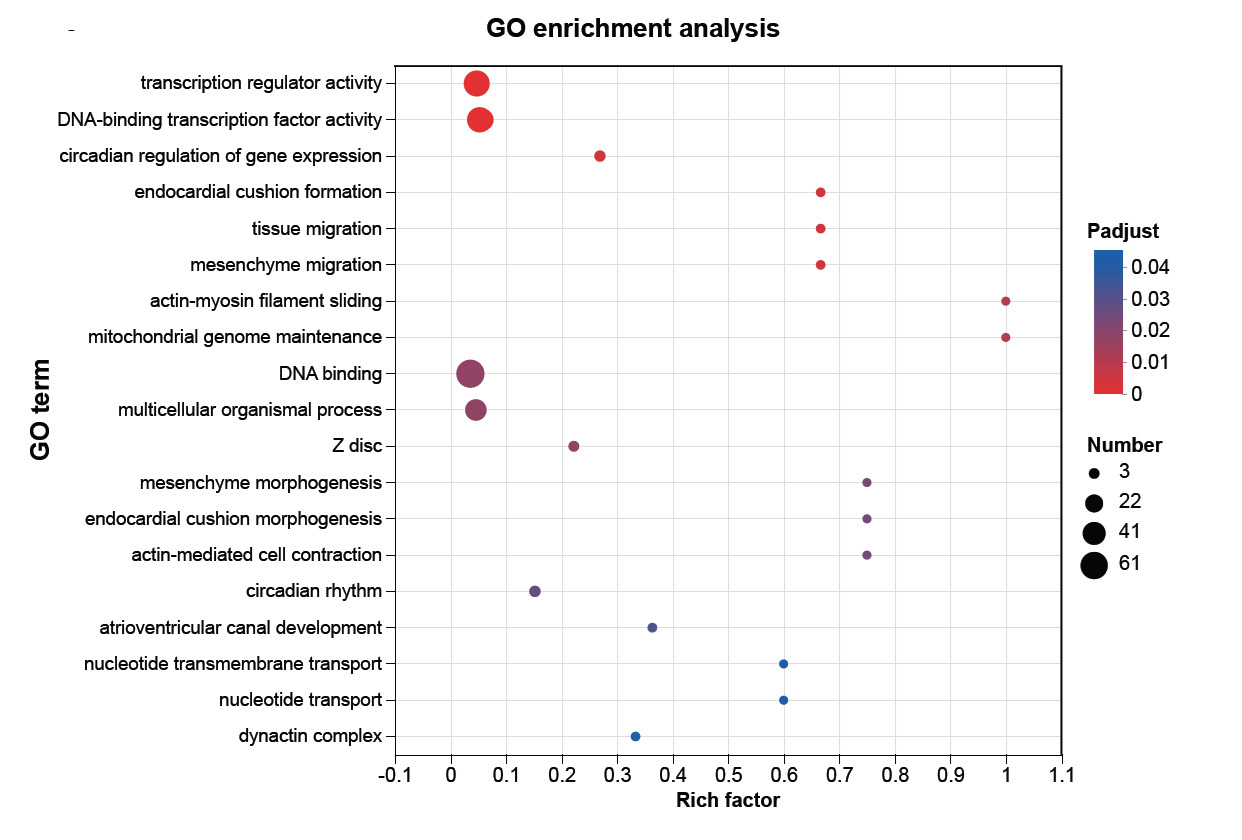
To decipher the global biological functions driving the growth divergence, GO enrichment analysis was performed on the DEG dataset utilizing Padj < 0.05 threshold. Based on the top 20 most significantly enriched GO terms (Fig. 4), the DEGs were profoundly implicated in transcriptional control, chronobiology, and muscle structural remodeling. Within the Molecular Function (MF) category, the most highly significant terms were overwhelmingly associated with upstream transcriptional regulation, notably DNA-binding transcription factor activity (Padj = 7.11 × 10⁻⁶) and Transcription regulator activity (Padj = 5.85 × 10⁻⁵), which also encompassed the largest number of DEGs (49 and 52 genes, respectively). In the Biological Process (BP) category, the enriched terms prominently highlighted two distinct regulatory branches: skeletal muscle chronobiology and muscle contractile mechanics. Specifically, Circadian regulation of gene expression and Circadian rhythm emerged as pivotal skeletal muscle-enriched processes. Simultaneously, muscle-specific mechanical processes, such as Actin-myosin filament sliding and Actin-mediated cell contraction, exhibited striking specificity with exceptionally high enrichment factors (Rich factor = 1.0 and 0.75, respectively). Consistent with these functional shifts, the Cellular Component (CC) category revealed significant targeted modifications to the sarcomere architecture, prominently enriching terms such as the Z disc and Dynactin complex.
_enrichment_analysis_of_degs_between_fge_and_sge_under_the_threshold_of_.png)
3.5. Kyoto Encyclopedia of Genes and Genomes (KEGG) Pathway Analysis
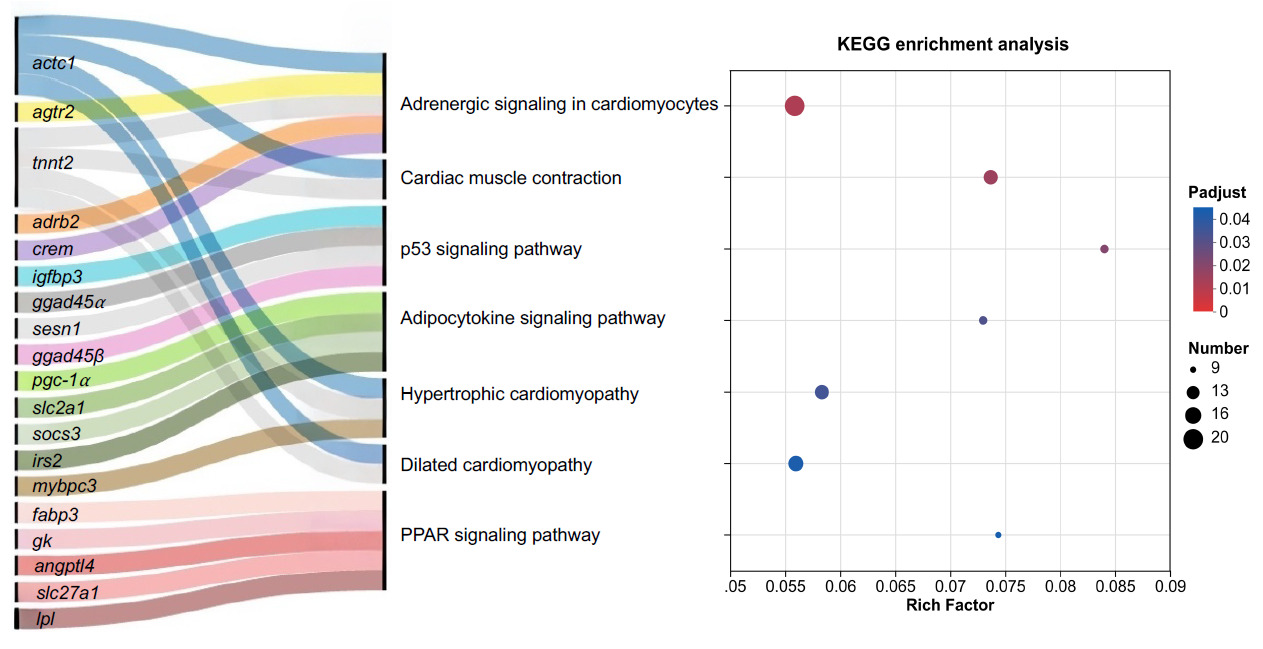
Subsequent global KEGG pathway enrichment analysis (Padj < 0.05) was conducted to map the overarching muscle-enriched metabolic cascades distinguishing fast- from slow-growing eels. A Sankey diagram was constructed to visualize the precise mapping relationships between the most significantly enriched KEGG pathways and their corresponding core DEGs, while the overall enrichment significance was summarized in a KEGG bubble plot (Fig. 5).
_pathway_enrichment_analysis_of_degs_between.png)
As depicted in the enrichment bubble plot and Sankey network, the core DEGs were predominantly clustered into three major functional modules. The first module involves cellular stress and growth arrest, prominently featured by the p53 signaling pathway (Padj = 0.020). This pathway encompasses critical DEGs interconnecting with vital stress-responsive and inhibitory genes that are highly upregulated in SGE, such as igfbp3, gadd45α, gadd45β, and sesn1. The second module is deeply tied to muscle biomechanics and structural integrity via enriched pathways including cardiac muscle contraction and cardiomyopathy-related terms. Notably, these annotations reflect shared conserved genes involved in sarcomeric organization and contractile function in skeletal muscle. Strikingly, this module highlights a profound divergence in sarcomere construction: while actc1 is predominantly upregulated in FGE to support healthy myogenesis, SGE exhibited a massive abnormal upregulation of specific cardiac/myopathy-related structural genes, notably tnnt2, mybpc3, and crem. The third module is strongly associated with energy substrate reprogramming (PPAR and Adipocytokine signaling pathway). While FGE upregulated specific lipid transport vectors (fabp7), SGE exhibited robust activation of cellular starvation and metabolic resistance sensors, driven by the intense upregulation of pgc-1α, angptl4, socs3, slc27a1, and slc2a1 (Related data can be found in Supplemental Table S1).
3.6. Quantitative Real-Time PCR (qRT-PCR) Validation
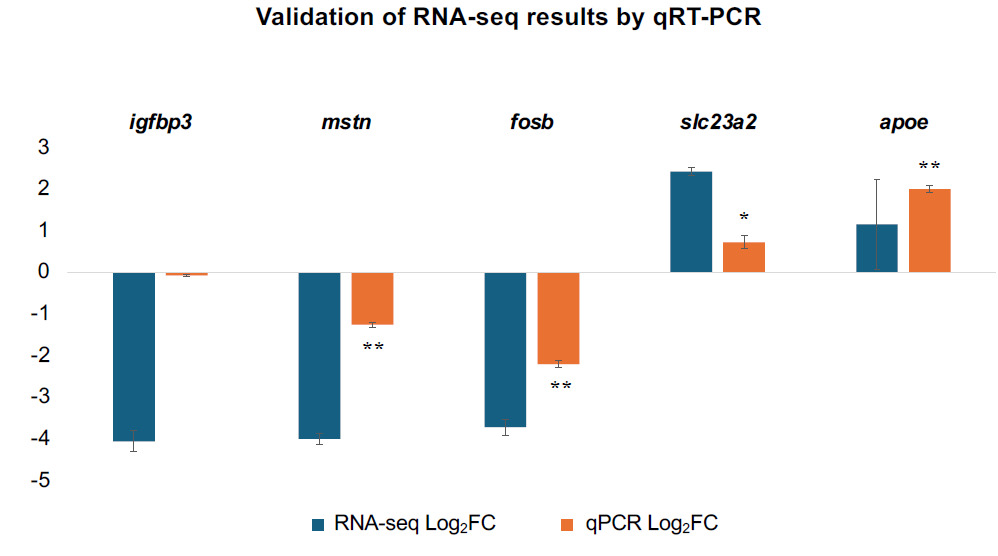
To biologically validate the precision and reliability of the RNA-seq pipeline, five key DEGs were selected based on their involvement in pivotal pathways of growth suppression, lipid metabolism, nutrient transport, and cellular stress regulation, including igfbp3, mstn, apoe, slc23a2, and fosb, for qRT-PCR analysis. As depicted in Fig. 6, the relative mRNA expression trends of all five selected genes obtained via qRT-PCR were highly consistent with the transcript abundance profiles determined by RNA-seq. This robust correlation confirms the high accuracy and reliability of the transcriptomic data utilized in this study.
_validation_of_selected_differentially_expressed_genes.png)
4. Discussion
In aquaculture, growth rate is an important economic trait. Because skeletal muscle constitutes the majority of a fish’s body mass, its accretion directly determines overall growth performance. Our previous physiological studies indicated that growth retarded A. japonica suffers from impaired digestion and altered systemic energy partitioning.4,8 Building on these macroscopic findings, the present comparative transcriptomic analysis reveals that somatic growth stagnation in SGE is not merely a consequence of passive nutrient deficiency. Rather, it is fundamentally governed by a profound metabolic trade-off within the muscle tissue, characterized by stress-induced growth arrest, circadian dysregulation, and lipid metabolic reprogramming, which collectively stall sarcomere structural assembly. Nevertheless, it should be noted that the present study employed an extreme-phenotype sampling design to compare phenotypic and transcriptomic differences between fast- and slow-growing individuals. Future studies adopting a random sampling strategy could be conducted to further validate the current findings.
4.1. Comprehensive Nutrient Assimilation and Sarcomere Assembly in Fast-Growing Eels
FGEs represent the optimal physiological state of aquaculture cohorts. Our analysis revealed that the transcriptomic signature of FGEs is dominated by a highly efficient, broad-spectrum assimilation of nutritional substrates and active structural assembly. Specifically, FGE exhibited significant upregulation of core lipid transport vectors, including fabp7 and apoe, ensuring a robust capacity to internalize lipids for energy-intensive myogenesis. This aligns with transcriptomic profiling in other fast-growing teleosts, such as Chinese longsnout catfish (Leiocassis longirostris), where superior growth phenotypes are consistently accompanied by the robust upregulation of fabp genes.22 Similarly, the expression level of apoe also reflects metabolic activity. In a study on Ancherythroculter nigrocauda, dietary protein levels of different concentrations significantly altered the characteristics of the hepatic transcriptome, among which apoe was identified as a positively regulated factor in response to a high-protein, fast-growth dietary environment.23 In addition, apoe expression is also elevated in fast-growing Lateolabrax maculatus fed a low-phosphorus diet.24 This evidence collectively supported that FGEs have superior lipid mobilization and apolipoprotein networks to fuel tissue expansion.
Beyond lipid utilization, FGE orchestrated a massively upregulated and comprehensive amino acid metabolic network. The enrichment of Valine, leucine and isoleucine biosynthesis provides branched-chain amino acids (BCAAs) that act as potent stimulators of the mTOR signaling pathway. Previous studies in teleost have widely reported the up-regulatory role of BCAAs (e.g. leucine) in activating the mTOR pathway thereby leading to growth promotion.25–27 Concurrently, the robust activation of other diverse amino acid pathways (e.g., Glycine, serine and threonine metabolism) and carbohydrate utilization (Starch and sucrose metabolism) ensures a sustained supply of structural precursors, methyl donors, and ATP for rapid protein translation. This immense, energetic, and material surplus is directly channeled into healthy muscle growth, evidenced by the pronounced upregulation of actc1 and the enrichment of the Cardiac muscle contraction pathway, which, in this context, may indicate normal, robust sarcomere assembly.
4.2. p53-Mediated Cellular Stress and Anabolic Resistance
In contrast, the muscle transcriptome of SGE suggests profiles consistent with cellular energy crisis and stress networks. Despite being reared under identical feeding conditions, SGE exhibited massive upregulation of pgc-1α, angptl4, and slc2a1. More critically, SGE highly expressed socs3, a classic marker of systemic inflammation and insulin/IGF signaling resistance.28 In teleost, the overexpression of SOCS proteins is frequently induced by chronic stress or nutritional restriction,29,30 which subsequently blocks the signal transduction of the GH/IGF-1 axis, leading to severe somatic growth retardation.31,32 This indicates that SGE muscle tissue may be trapped in a state of metabolic dysregulation and intracellular starvation.
Consequently, this chronic metabolic stress markedly upregulates the p53 signaling pathway. As a cellular sentinel, p53 responds to metabolic stressors by inducing cell cycle arrest and suppressing anabolism.33 This is supported by the significant upregulation of its downstream targets gadd45α, sesn1 and fosb in SGE. Crucially, igfbp3 was highly upregulated in the SGEs. Recent evidence in teleost, such as Seriola lalandi, demonstrates that igfbp3 expression is significantly elevated under adverse culture conditions like malnutrition or high stocking density, serving as a robust biomarker and a negative modulator of skeletal muscle development.34 Traditionally, the igfbp3 gene regulates the transport and local bioavailability of IGFs, acting as a crucial node to restrict anabolic signals.35 However, it is now established that IGFBP-3 also possesses potent IGF-independent capabilities to directly inhibit cell proliferation and induce apoptosis, frequently mediating the severe growth-inhibitory actions of the p53 tumor suppressor.36
This profound p53/IGFBP-3-mediated anabolic resistance is further repurposed by the elevated expression of mstn, a well-characterized negative regulator of myogenesis whose elevated expression consistently correlates with restricted muscle growth.37 The concurrent upregulation of p53-driven stress genes and mstn implies that the growth disparity in SGEs is not merely a passive lack of nutrients. Rather, it may be associated with a functional dynamic equilibrium. While FGEs efficiently capitalize on GH/IGF-mediated anabolic pathways, SGEs are completely overwhelmed by these dominant IGFBP-3 and MSTN-mediated inhibitory constraints.
4.3. Myopathy-Like Structural Remodeling and Circadian Dysregulation
Most intriguingly, KEGG analysis revealed that SGE showed significant enrichment of cardiomyopathy-related pathways, which in this context likely reflect changes in genes involved in sarcomeric organization, contractile function, and cytoskeletal remodeling rather than cardiac pathology per se. In contrast to FGE, which preferentially expressed actc1, SGE displayed markedly higher expression of the cardiac-associated structural genes tnnt2 and mybpc3. Although tnnt2 and mybpc3 are not established markers of growth suppression, previous studies in non-fish systems have shown that these genes can be induced in skeletal muscle under pathological or developmentally immature conditions. For example, tnnt2 expression has been detected in denervated, aging, or diseased skeletal muscle, suggesting that reactivation of a cardiac-associated contractile program may occur during muscle dysfunction or remodeling.38 Similarly, ectopic expression of mybpc3 has been documented in human skeletal myopathy and has been linked to abnormal sarcomeric organization.39 Taken together, these observations suggest that the elevated expression of tnnt2 and mybpc3 in SGE muscle may reflect altered muscle maturation or structural remodeling, rather than enhanced growth capacity. Accordingly, we propose that slow-growing individuals may exhibit transcriptional patterns reminiscent of myopathy-related remodeling, in which resources are potentially allocated to sarcomeric maintenance or repair rather than somatic growth.
Additionally, circadian regulation of gene expression was also significantly enriched in SGE, suggesting that the peripheral clock in muscle tissue may be disrupted. In teleost fish, socially subordinate individuals commonly exhibit a chronic stress phenotype characterized by elevated basal cortisol levels.40,41 In fish, glucocorticoid signaling is closely involved in circadian regulation and peripheral clock entrainment, and disruption of this pathway can alter clock gene expression and clock-controlled metabolic processes.42,43 Thus, the circadian signature observed in SGE muscle may reflect stress-associated chronobiological disruption, potentially impairing the temporal coordination of metabolism and protein turnover. This interpretation is also consistent with the dysregulation of sema3, which may indicate altered neuromuscular patterning or remodeling.
4.4. Practical implications
The pronounced activation of stress-related pathways and the p53/IGFBP-3 axis in slow-growing individuals indicates that mitigating chronic stress should be a key priority to improve production uniformity, for example by optimizing stocking density, stabilizing water quality, and enhancing environmental consistency. Moreover, the disrupted circadian regulation in slow-growing eels suggests that circadian-aligned practices, such as optimized feeding times and light–dark regimes, may help synchronize metabolism and reduce growth heterogeneity. In addition, the key DEGs identified in this study, including igfbp3, mstn, socs3, and tnnt2, may serve as early molecular indicators for identifying growth-retarded individuals, supporting precise grading and targeted management in eel aquaculture.
5. Conclusion
In summary, growth retardation in A. japonica is associated with marked transcriptomic reprogramming in skeletal muscle. Based on an extreme-phenotype sampling design, slow-growing eels showed activation of stress-related and growth-inhibitory pathways, together with circadian disturbance, metabolic remodeling, and structural dysregulation, whereas fast-growing eels exhibited enhanced nutrient metabolism and muscle assembly. These findings characterize molecular signatures associated with the two extreme growth phenotypes, indicating that growth retardation in A. japonica reflects a shift from anabolic growth toward stress adaptation and maintenance. This study implies that reducing chronic stress and optimizing circadian-aligned feeding and light regimes may improve growth uniformity in A. japonica, and also provides a molecular basis for understanding growth heterogeneity.
Acknowledgments
This work was supported by Shanghai Municipal Science and Technology Commission [24ZR1428700] and [24PJA039]; the National Key Research and Development Program of China [2022YFE0203900].
Authors’ Contribution– CRediT Taxonomy
Conceptualization: Tianwei Jiang, Liping Liu. Methodology: Tianwei Jiang, Jingwei Liu, Kanghong Jiang. Formal Analysis: Tianwei Jiang. Investigation: Xiangbiao Zeng. Writing – original draft: Tianwei Jiang. Resources: Liping Liu. Writing – review & editing: Tianwei Jiang, Xiangbiao Zeng, Jingwei Liu, Zhenzhu Wei, Liping Liu. Funding acquisition: Jingwei Liu, Liping Liu. Supervision: Jingwei Liu.
Competing of Interest – COPE
No competing interests were disclosed.
Ethical Conduct Approval – IACUC
The animal handling and culture procedures in this study adhered to the guidelines established by the Animal Ethics Committee of Shanghai Ocean University (Shanghai, China), with approval number SHOUW-DW-2020-017.
Informed Consent Statement
All authors and institutions have confirmed this manuscript for publication.
Data Availability Statement
The raw RNA-seq data generated in this study have been deposited in the NCBI Sequence Read Archive (SRA) under BioProject accession number PRJNA1466095. All other relevant data and materials are available from the corresponding author upon reasonable request.