


Introduction
Morphologic differentiation expressed in phenotypic plasticity is an adaptation of the species in the environment.1 The study on the morphological variation of migratory fish interested many workers. Many migratory species exhibited ecological adaptation in morphology by reducing energy costs during migration. Thus, their body morphologies tended to be shallower to reduce drag and maintain to swim in the flowing water stably.2 Survival and selective pressures also influence the locomotor morphology of larvae and adults.3 Water flow rate is one of the environmental factors that affect variations of body and head shape in fish, in which fish in flowing water has suitable body shapes for stable swimming. In contrast, the shape can change to unsteady swimming efficiency in non-flowing water.4,5
Terapon jarbua (Forrskäl, 1775), a species of ray-finned fish in the family Terapoidae,6 is a broad-salted species,7,8 widely distributed in the Indo-West Pacific region,9 and is one of six species of fish belonging to the Terapontidae family distributed in Vietnam.10 T. jarbua is the Lessepsian migrant,11 experiencing the period of reproduction, migrating into the estuarine system in the stage of young juveniles.12 Lavergne12 analyzed the shape, number of rings, and chemical composition of the otoliths of adult scads to build data to determine the age and migration of this fish in the island of Socotra (northwest of India). Some earlier findings concerned the study of biological characteristics such as anatomical structure, growth, nutrition, and reproduction.13–15 The composition of fish in Tam Giang - Cau Hai lagoon originates from marine, and T. jarbua is recorded here as a commercial species.16 Thus, the migrant properties of T. jarbua and their habitat in Tam Giang lagoon led us to determine whether there is polymorphism and ecological adaptation of the fish in the study area. In Vietnam, this species belongs to the group of 21 species having local commercial value.17 However, researches on T. jarbua mainly focus on morphological classification by traditional methods, routine, and fish species composition10,17 such as larvae and juveniles of T. jarbua have been described in detail on morphology and distribution in some estuaries in the Northern region of Vietnam,18–20 while the studies on morphology and genetic diversity are still limited. This study applied landmark-based geometric morphometric analysis to assess the differences in the shape of T. jarbua habiting in Tam Giang lagoon and Thua Thien Hue coastal sea. We also used the cytochrome c oxidase 1 (COI) marker in the mitochondrial genome to evaluate the genetic diversity of T. jarbua in the Tam Giang lagoon. Lavergne et al.21 assessed the genetic diversity and structure of T. jarbua through the COI and Microsatellite markers. COI and cytb markers showed high haplotype diversity of T. jarbua but low nucleotide diversity and were suggestive of population genomic changes following environmental changes and geography during the repeating glacial period of the Pleistocene.22,23 We predicted a difference in the morphology of fish in Tam Giang lagoon compared with those obtained from Thua Thien Hue coastal, as well as genetic diversity in this population. The results will be discussed in detail in the analysis. The findings will provide information on the phenotypic adaptation environmentally induced among T. jarbua populations in Central Vietnam and genetic diversity and gene flow of mtDNA COI for further research in effectively managing this species.
Materials and Methods
Sampling
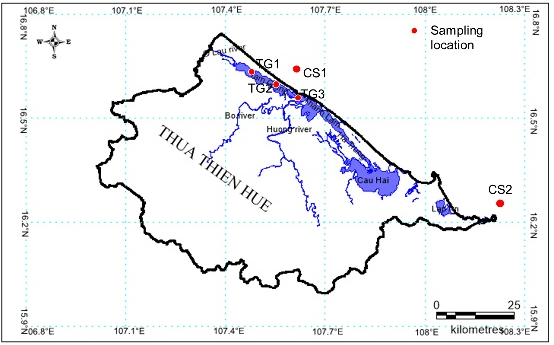
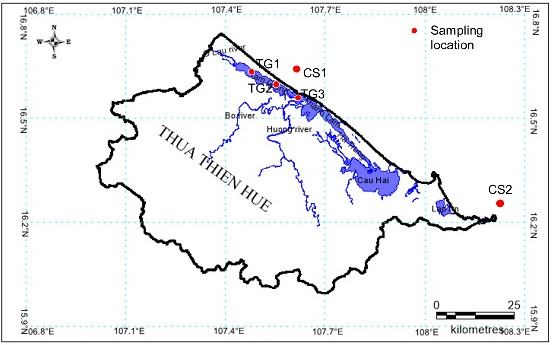
Tiger Perch T. jarbua (Forrskäl, 1775) was collected from Tam Giang lagoon (60 samples) and Thua Thien Hue coastal sea (66 samples) by directly fishing or by purchasing samples from fishermen in the study area during the period from February 2020 to December 2021 (Figure 1, Table 1).
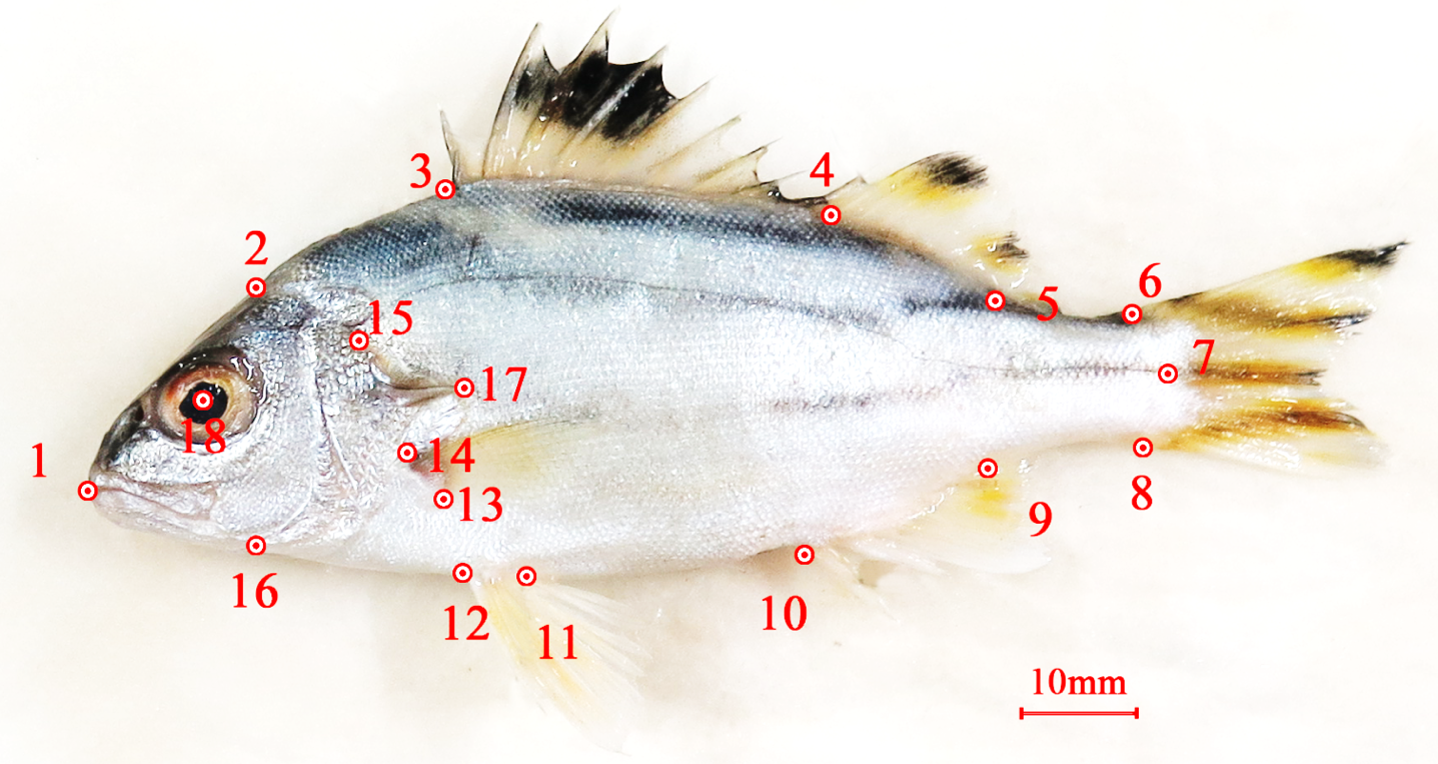
The specimens were preserved in an ice box and immediately transported to the laboratory to ensure the fish color for shaping and photographing, then cut off 1 cm and stored at -80 oC for total DNA extraction. Briefly, the collected samples were pinned to the foam sheet. Each sample was recorded through the camera with high resolution. Eighteen landmarks were selected and digitized. Identifying the similarities and dissimilarities on the fish’s left side was marked landmarks with tpsDig v.2 software to digitize landmarks and record body shapes common to the specimens (Figure 2).

Shape analysis
The digitized landmarks data generated by tpsDig software v.2.3226 will be input data for MorphoJ software version 1.7b (Klingenberg, 2011). MorphoJ software was used to perform principal component analysis (PCA) as a descriptor of conformational change, examining conformational differences between population samples.27–29 Discriminant Function Analysis (DF) was also used to test for differences between morphological variants.
Samples were washed with sterile distilled water, put in 99 degrees of alcohol, and kept the sample at -80°C until analyzing DNA extraction.
Molecular biology methods
Total DNA extraction was performed as the manufacturer GeneJET Genomic DNA Purification Kit (Thermo Fisher Scientific) described. Amplifying the COI gene fragment by PCR technique, in which the primer pair used is the forward and reverse primers designed based on the nucleotide sequence of the COI gene that has been published previously30: Fish F1: (5’-TCAACCAACCACAAAGACATTGGCAC-3’); Fish R1: (5’-TAGACTTCTGGGTGGCCAAAGAATCA-3’)
PCR reaction: Total volume amplification was 15 μl, consisting of (1) Go Taq® Green Master Mix, 2X: 7.5 μl; (2) Forward Primer (10 pmol/μl): 1 μl; (3) Reverse Primer (10 pmol/μl): 1 μl; (4) Total DNA sample (⁓50 ng): 0.5 μl; (5) Kit Distilled Water (DW): 5 μl. The PCR reaction was carried out in a thermocycler (AERIC-BG096, ESCO) according to the following cycle: DNA denaturation at 95 °C for 5 min; Amplification 35 cycles at 94 °C for 1 min, annealing at 54 °C for 30 s and extension at 72 °C for 45 s); final extension of 72 °C for 5 min, followed by storing at 4 °C or -20 °C. PCR products were examined by electrophoresis on 0.8% agarose gel with 0.5 μl/l GelRed™ stain and analyzed by direct UV reading system. Sanger DNA sequencing was performed at 1st Base (Malaysia) using the Capillary Electrophoresis method.
Sequence analysis: The sequences of COI gene segments were aligned based on Clustals 1.4 program31 and edited using BioEdit 7.2.5 software.32 Nucleotide sequences were compared with the percentage of similarity with reference sequences in the NCBI database using BLASTn, including KP455734.1 and KF999839.1, to determine similarity and species composition (Table 2). Next, the sequences are registered on the NCBI database with codes OL774359–OL774379, OQ053107-OQ053127.
Genetic diversity analysis: The indices of genetic diversity single or number of variable sites (S), number of mutation (n), the average number of nucleotide differences (k), number of haplotypes (h), nucleotide diversity (π), haplotype diversity (Hd), Tajima’s D and Fu’s Fs were calculated using the software DnaSP v6.10.01.33 Calculating Fu’s Fs34 and Tajima’s D35 were applied to evaluate population expansion patterns in T. jarbua stocks and their significance. The distribution of haplotypes was analyzed in Fu’s Fs statistic, and the allele frequency was estimated in Tajima’s D when the sequences compared pairwise differences (Ramn-ez-Soriano, 2008). Arlequin software v.3.1136 was used to determine the genetic differentiation index (Fst) and evaluate the degree of difference within and between populations through analysis of molecular variance AMOVA. A haplotype network was built according to Network software.37 This software used the input data network connection created by DnaSP v6.10.01 software and used the Median Joining algorithm (calculate network function) to calculate.
A phylogenetic tree showing genetic relationships was built in MEGA X 10.0.5 software38 by using the Maximum Likelihood (ML) method and the Hasegawa-Kishino-Yano model.39 This best-fit model is tested through the BIC index on Mega X software.
Results
Analysis of the differences in shape between male and female groups of T. jarbua
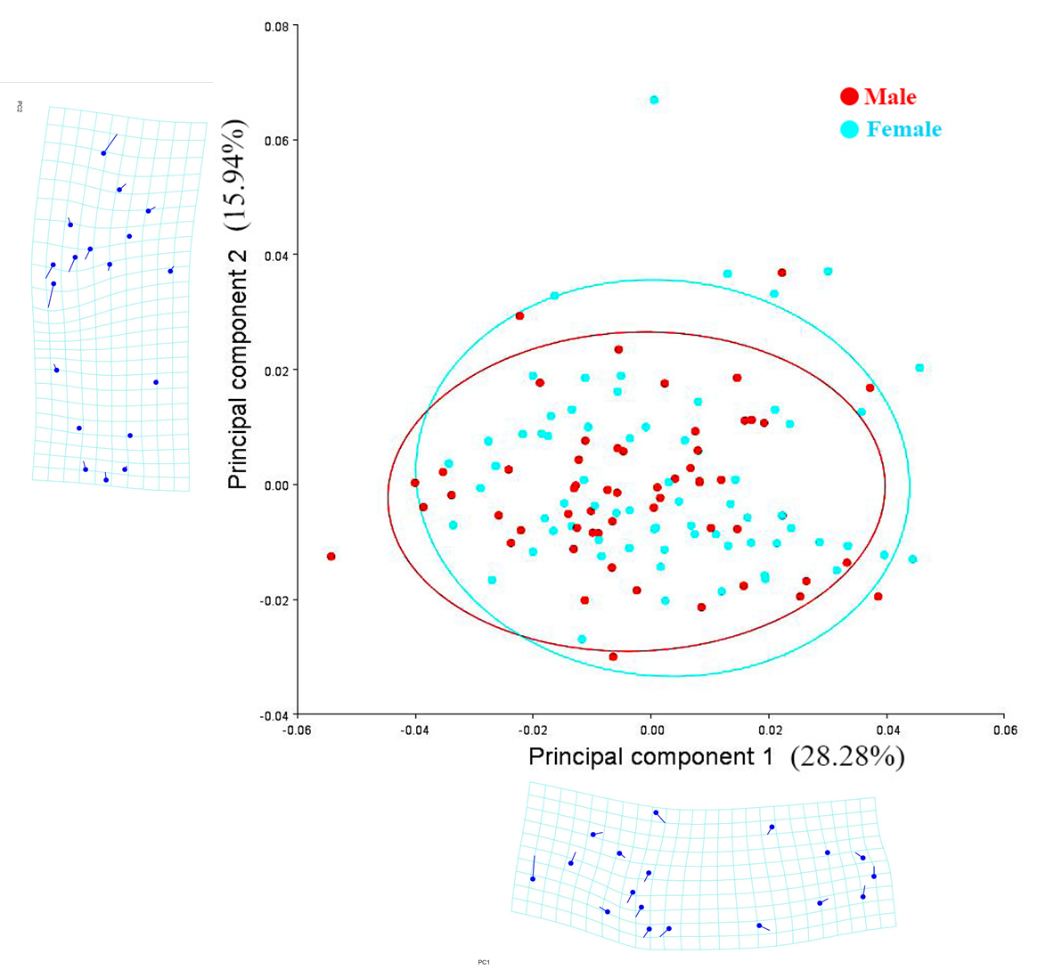
It is hypothesized that body shape may vary between the sexes of individuals. Principal components analysis was applied to the CovMatrix landmark dataset. The Procrustes coordinates generated 32 principal components. The first Principal component (PC1) accounted for 28.28%, and the second Principal component (PC2) accounted for 15.94% of the variation selected for analysis. It can be seen that there is no separation between male and female individuals. Thus, it is to be noted that the shape of male and female has no differences (Figure 3).
__male_(.png)
The Discriminant Analysis (DF) (Figure 4) showed that the p-value from 1,000 Procrustes distance measurements between the male and female groups was 0.0881 > 0.05. Thus, there was no statistically significant difference between male (57 fish) and female (69 fish) T. jarbua. The results of sexual dimorphism absented the body shape of this species.

Analysis of the difference in the shape of T. jarbua between Tam Giang Lagoon and Thua Thien Hue coastal sea
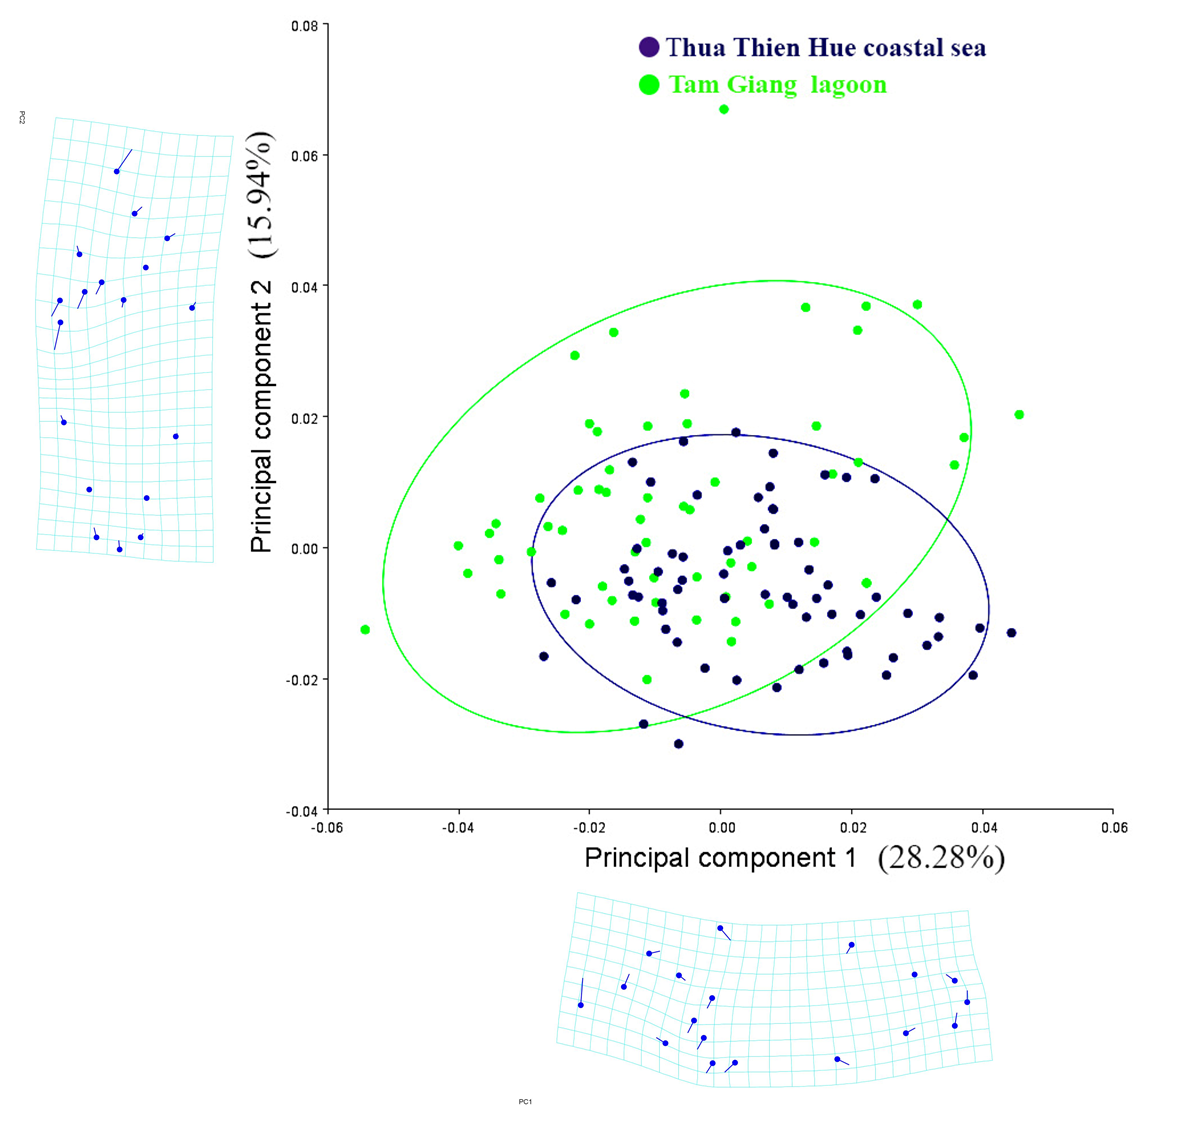
If we remove the role of sex on conformational variations in fish populations, characterizing fish shape between populations will show differences that correlate with the ecology of the two subpopulations. The distribution is shown by analyzing 32 main components (Figure 5). The first Principal component (PC1: 28.28%) loaded characteristics composing snout tip, anterior insertion of the dorsal fin, superior and inferior insertion of the pectoral fin origin, anterior insertion of the pelvic fin, end of caudal peduncle, the lower end of the caudal fin, superior and posterior insertion of the anal fin, the center of the eye. The second Principal component (PC2: 15.94%) loaded characteristics such as snout tip, anterior and posterior pelvic fin insertion, and superior and inferior insertion of the pectoral fin origin. The results of the analysis of differences (Figure 6) from 1,000 permutation rings for Procrustes distance between two sample areas in the Tam Giang lagoon (60 individuals) and the Thua Thien Hue coastal sea (66 individuals) showed that there was a statistically significant difference (p<0.0001).


Genetic diversity of T. jarbua (Forrskäl, 1775)
Genetic variation
Analysis of 42 COI gene sequences found 16 polymorphic sites, and 13 haplotypes based on 697 bp sequences of COI, in which haplotype H1 accounted for the most significant number (28 individuals, accounting for 66.67 %) and H4, H7 had the least number (2 individuals, accounting for 4.76 %). The remaining haplotypes (H2 to H6 and H8 to H13) were found in only one individual (2.38 %) (Table 3). Overall, the population had a moderate haplotype diversity with 0.624 ± 0.121 for Tam Giang Lagoon, 0.495 ± 0.130 for coastal sea, and a low level of nucleotide diversity (0.00186 ± 0.00064 for Tam Giang Lagoon, 0.00165 ± 0.00055 for the coastal sea) (Table 5).
The model predicting population characteristics and phylogenetic trees
Population prediction model
Estimates of the evolutionary divergence between haplotypes (H) of COI gene fragments were performed on 15 H (2 control haplotypes and 13 haplotypes from the study area). The results have shown that most of the T. jarbua collected on the Central coast of Vietnam have great genetic similarity with the two reference samples from Genbank, with the distance equal to 0.007 - 0.014 and 0.007 - 0.014 corresponding to KP455734.1 and KF999839.1. Of the 42 specimens obtained, there are 28 individuals (accounting for 66.67 %) in H1 with a distance of 0.007; 8 individuals (19.1%) in H2, H5-H8, H10, H12, H13 with a distance of 0.009; 2 individuals in H4, H11 (4.8%) with a distance of 0.012; 1 individual in H9 (2.4%) with a distance of 0.014 and 1 individual in H3 (2.4%) with a distance of 0.013 (compared to KP455734.1) (Table 4).
The population of T. jarbua in the study area also shows low genetic diversity among individuals with genetic distances ranging from 0.001 to 0.01. The low proportion of individuals with large genetic distances from the rest of the population indicates the closeness of genetic origin in the study population structure (Table 4).
The results of AMOVA analysis (Table 6) showed that the genetic variation of fish between different collected areas (between geographical areas) is low (2.76%). In contrast, genetic variation that occurs between individuals within a population is very high, at 97.24%. That result indicates that the genetic variation has no genetic difference in the two studied areas. The Fst value of 0.028 (p>0.05) indicates no significant genetic variation among the two populations.
Genetic structure
The genetic connection between the sampling areas is represented by the haplotype connection network built based on the analysis of the median-joining polymorphisms, including the number and frequency of the polymorphism’s haplotype for COI sequences (Figure 7). On associative networks, the blue numbers represent polymorphic sites between each haplotype pair. Ray-like haplotype networks with many haplotypes are closely related to the central H1 haplotype. H1 is considered to be the native haplotype found in all sampling areas. This result shows a close correlation between fish in the population of Central Vietnam. In addition, some other haplotypes have little correlation with other haplotypes that exhibit population specificity (H4, H7). The remaining haplotypes in the network were scattered compared with the central haplotype, showing the diversity and tendency of some independent individuals to differentiate.

Phylogenetic tree Maximum Likelihood with bootstrap values (1000 repetitions) based on 13 haplotypes belonging to this study and 12 COI gene sequences from different geographical locations (Vietnam, China, Taiwan, Philippines, Indonesia, Malaysia, Bangladesh, India, Pakistan, Australia) and which were downloaded from the National Center for Biotechnology Information (NCBI) (Table 7). All spaces and missing data in strings have been removed. A total of 608 nucleotide positions were expressed in the final sequence of COI, in which the tree showing the highest likelihood was built of -1466.67 for the COI segment (Figure 8). The phylogenetic tree is divided into 2 main clades. Clades 1 is a common share of the same ancestry for most haplotypes in this study and most of the geographic areas except Australia and Taiwan. The low number of haplotypes in clades 2 (four haplotypes: H3, H4, H9, H11) represent different populations, and most especially, H9 occurs in geographically remote areas such as Australia.

Discussion
Shape analysis is a fundamental part of biological research. The description and identification of conformational variations among T. jarbua species in this study by using geometrical morphologies based on similar landmarks give extremely intuitive statistical results. Analyzing differences in left body shape is essential in development (Nosil and Reimchen 2001; Russo et al.40)—the sexual dimorphism of T. jarbua absences in both populations. A similar finding is presented in some species, such as siphon whelks Penion chathamensis, reflecting the nonappearance of dimorphism in these shells due to the palaeontological perspective. The similar shape and size of Penion chathamensis presented strongly between male and female shells.41 Yet, in some fish species, the variation in morphological traits appears within males and females, leading to distinguishing through the naked eye more easily. Kitano et al.42 represented the sexual dimorphism in the morphology of Gasterosteus aculeatus adult, in which the head and mouth of the male are larger than female while its standard length and pelvic girdles have a shorter size than the female, and these characteristics are the results of genetic factors but not of phenotypic plasticity. In this study, we examined the morphometric divergence in two sites. Observing the external morphology of this species in two populations indicated that the body of collected fish in the lagoon is shallower than those inhabiting the coastal sea. Morphological divergence caused by water flow results from adaptation in swimming strategies to reduce energy costs. In this way, salmon respond to environmental changes occurring in the body’s length and in the fin’s size, which Salmon from the fast flow have more robust than those in the slow flow.1 The fish component of Tam Giang lagoon has a marine fish origin, including a series of species adapted to the low and unstable salinity of the estuary,16 with the soft substrate of the lagoon bottom and shallow water supply excellent facilities for aquacultural activities.43 This paper suggested that morphological differences occurred in body shape as the migrant strategies, suitable for migrant lifestyles from Thua Thien Hue coastal sea to estuaries and lagoons, combined with the typical environment of this lagoon to cause the body a shallower shape.
In addition, water temperature and salinity also can affect the fish morphology.44 The threespine stickleback (Gasterosteus aculeatus), repeatedly colonized and adapted to coastal freshwater bodies from the marine environment, exhibited phenotypically plastic changes in body shape in response to salinity that had shallower bodies and longer jaws in a saline environment.45 The threespine stickleback body shape variation caused temperature also was evaluated via the experiment in the laboratory. After rearing for approximately 100 days under three different temperature regimes (13, 17, and 21 °C), there were differences in fish size and shape among the temperature groups.46 In the study, the Thua Thien Hue coastal sea sample sites possess salinity higher than the Tam Giang Lagoon. In contrast, the water temperature between the two areas is not much different (Table 1). Hence, the salinity factor can influence the body shape variation in two populations.
When it comes to measures of population characteristics, the T. jarbua population in Vietnam showed noteworthy and unfavorable values for Tajima’s D and Fu’s Fs, indicating that there were an excessive number of uncommon haplotypes and a swift expansion in the population. Frankham et al.47 suggested that if the Fst value is more significant than 0.15, there is substantial genetic differentiation among the sampled groups. In this research, the Fst value was insignificant (p = 0.126) and low (Fst = 0.028).
When analyzing genetic relationships between populations, the occurrence of common haplotypes exhibited among sampling areas in Central (Vietnam), Vietnam, Philippines, China, Pakistan, Taiwan, Indonesia, India, Malaysia, and Bangladesh. Among them, the most distant population was recorded in India, indicating that the range of T. jarbua population expansion is very large or that there is a high genetic exchange between populations. This has been noted by many authors when studying the structure of the T. jarbua population. Lavergne et al.21 also reported high connectivity between populations in the Gulf of Aden and the South China Sea due to the unique sharing of COI haplotypes between sampling areas. The shared haplotype between the Malaysian population and populations as far away as India or Taiwan suggests that population expansion was not limited to the South China Sea but extended to the Indian Ocean.22,23 On the other hand, the T. jarbua population in the Tam Giang Lagoon is formed from the migration or drift of larvae and juveniles from different spawning grounds of the vast East Sea, creating diversity in the population structure. The sharing of haplotypes and their consequent genetic exchange may also be due to reproductive migration, mutation, larval flotation, and shared ancestry.48 Due to the lagoon being mainly connected to the East Sea through the Thuan An estuary, the drift of larvae or juveniles from spawning grounds to the lagoon becomes limited.
In short, the shape variation of T. jarbua appears among two populations, where the shape of fish collected in Tam Giang lagoon is shallower than that in Thua Thien Hue coastal sea. This difference in shape presents phenotypic plasticity in response to varied environmental conditions. Besides that, the genetic diversity of T. jarbua population in Central Vietnam is moderate and presents high genetic exchange with neighboring stocks.
Acknowledgments
This work was supported by a grant from Hue University, Ministry of Education and Training, Vietnam, under project code B2020-DHH-17, and Hue University, under the Core Research Program, Grant No. NCM.DHH.2022.07.