
The gilthead sea bream (GSB; Sparus aurata) is an important aquaculture species in Israel and Europe, where the 2016 production was ca 200,000 tons.1 Nevertheless, the supply of quality juveniles of GSB as well as other domesticated species in aquaculture, has been hampered by high mortality during larval rearing.2 A critical period that impacts on early larval survival and performance is the success of exogenous feeding immediately following the depletion of their yolk reserves3 as well as the opening of the mouth and anus. Prey capture during early larval development is heavily dependent on vision.4 Indicative of this, was the dry weight (DW) of the eyes in 10 DPH GSB larvae reaching up to 50% of their total DW.5 However, most fish larvae can only detect prey over a visual distance of approximately one to two body lengths,6 underscoring the need for a highly functional visual system. A failure to ingest sufficient amounts of prey and/or essential nutrients during early development, will quickly bring the larvae to the “point of no return”.7 At this time the digestive tract begins to degenerate irrevocably, leading to mortality or compromised growth. Although providing larval environmental conditions in commercial aquaculture are vitally important, the nutrient composition of the live food and their level of consumption in larval culture are believed to be the prime reasons determining rearing success and juvenile quality.
Docosahexaenoic acid (DHA; 22:6n-3) is present in the membranes of all tissues, but it mainly accumulates in the brain, retina and other neural tissues. In fish, DHA was associated with improved neural development, function and growth,5,8–11 broadly suggesting a requirement for this n-3 long chain polyunsaturated fatty acid (LCPUFA) in vision. This was reinforced in several studies that reported a dietary DHA effect on improved hunting success and behavior as well as prey consumption in larval GSB, yellowtail (Seriola quinqueradiata) and herring (Clupea harengus) under low light intensity, respectively,.5,8,12,13
GSB and marine fish, in general, have a limited ability to elongate and desaturate shorter chain fatty acids such as α-linolenic acid (ALA;183n-3), thus lacking the necessary capacity to synthesize LCPUFAs such as DHA. In nature, this fatty acid deficiency is compensated for by the high levels of DHA found in copepods, the dominant zooplankton prey consumed by marine fish larvae. However, reports of the successful mass production of copepods in aquaculture have not been implemented on a commercial scale. Alternatively, the main live food fed to fish larvae in aquaculture worldwide is rotifers (Brachionus spp.), which are relatively easy to mass produce and Artemia, that are hatched from cysts commercially sold. However, these zooplankters are naturally deficient in DHA and must be enriched in this LCPUFA to ensure good larval performance.14,15
Rhodopsin is the primary photopigment protein found in the retinal rod photoreceptors of fish and other vertebrates, and is responsible for vision under low light intensity.16–18 Studies in mammals showed that DHA promotes the rate of conformational change in light-stimulated rhodopsin, leading to faster processing of visual stimuli (Litman et al.19; Grassfield et al. 2006). Furthermore, it was recently demonstrated by our group that DHA upregulates the expression of 5 opsin genes17,18 including rhodopsin. Nevertheless, there have been only scant studies directly associating dietary DHA level with photoreceptor abundance and rhodopsin synthesis during larval development of GSB17,18 and how this is manifested in growth.
Therefore, the objective of the present study was to determine the effect of dietary DHA on larval photoreceptor abundance, rhodopsin expression, and performance in developing GSB larvae in terms of dry weight (DW) and total length (TL).
Materials and Methods
Larval rearing
The experiment was carried out in the hatchery of the National Center for Mariculture (NCM), a branch of Israel Oceanographic and Limnological Research (IOLR) in Eilat, Israel. GSB eggs were obtained from a local fish farm (Ardag Red Sea Mariculture Ltd., Eilat, Israel) and stocked randomly (100 eggs/l) in twenty-eight 400 l conical tanks. The experimental system was filled with well aerated (>95% O2 saturation), sand filtered (10 μm) and UV treated Red Sea seawater ( 40‰) with a flow rate of 280 ml/min. Treated seawater entered the tanks from the bottom and exited through an outflow filter at the water surface, whose mesh size increased as the larval rearing progressed according to Tandler et al.20
After hatching, seawater salinity in the larval rearing tanks was gradually decreased over a period of 24 hours from 40‰ to 25‰ at a constant exchange rate (Gavish, Israel), while the temperature was raised, incrementally, from 19 to 24 ºC (Gavish, Israel) according to Tandler et al.20 A lower salinity (25 ‰) reduced energy expenditure during osmoregulation in larval GSB and redirected it towards growth.21 “Green water” was maintained in the rearing tanks, by the addition of fresh microalgae (Nannochloropsis oculata) twice a day, at a concentration of 5x10⁵cells/ml. From 2 days post hatching (DPH), groups of four larval tanks were supplied twice a day, at a concentration of 10 rotifers/ml in each ration, with one of four DHA enriched rotifer treatments (Brachionus rotundiformis) (Red Pepper® BernAqua, Belgium) and tested in replicates of 4 tanks/treatment (Table 1). Together with the feeding of the DHA rotifer treatments, two daily rations of one of 4 DHA enriched Artemia nauplii treatments were added to the tanks from 17 DPH until the end of the experiment at 34 DPH. The daily enriched nauplii ration increased gradually with larval age from 0.1 nauplii/ml at 17 DPH to 4 nauplii/ml during the course of the study.20 GSB larvae (5-10 fish/tank) were collected onto a 250-350 µm mesh at 6 time points, euthanized in an excess of MS222 (Sigma-Aldritch-Merk, Israel), and immediately analyzed for total length (TL), and then lipid extracted and stored at -20 ⁰C until analysis for larval fatty acid content (only DHA levels are shown). During culture, 5-10 larvae/tank were sampled for rhodopsin gene expression (see Total RNA extraction) at 7 time points, euthanized in excess MS222, and stored at -80 ⁰C until RNA analysis. Groups of larvae (20, 5, 5 fish/tank) were sampled at the end of the study (34 DPH), euthanized in excess MS222, and analyzed for dry weight (DW), photoreceptor abundance, and RNA extraction, respectively.
Live food: Rotifers (Brachionus rotundiformis)
Rotifers were mass cultured at the NCM to a concentration of 200-500 rotifers/ml in 8 m3 circular tanks and then transferred and concentrated in 80 l cylindrical V-tanks, and washed with fresh, UV treated and diluted seawater (25‰). After removal of dead and dying rotifers through settling, the remaining live rotifers were counted and restocked (500 rotifers/ml) into 200 l well aerated (> 90% dissolved oxygen saturation) conical enrichment tanks, filled with filtered and UV treated diluted seawater (25‰, 25 ºC) and microalgae (Nannochloropsis oculata). Four enrichment media treatments with varying DHA content, were obtained by diluting a custom enrichment preparation of 32% DHA of total fatty acids (Red Pepper®, BernAqua, Belgium) with the resulting DHA levels shown in Table 1. The tanks were individually supplied with the 4 different enrichment media, according to the Bernaqua protocol (0.36 ml/106rotifers/tank), using an automated and calibrated peristaltic pump which dispensed the enrichment media treatments to the rotifers over time until harvesting them after 8 hours. The enriched rotifers were washed, counted, and fed to the larvae in the experimental tanks twice a day to maintain a concentration of 10 rotifers/ml. Rotifers were frequently sampled, washed on a circular mesh with freshwater and then rinsed in double distilled water (DDW) and stored (-30 ºC) under nitrogen until analysis for fatty acid content.
Live food: Artemia nauplii (Artemia fanciscana)
Decapsulated Artemia eggs (Great Salt Lake, Utah, USA) were hatched, according to Sorgeloos et al.,22 in 200 l conical tanks filled with well aerated, filtered and UV treated diluted seawater (25‰ ; 22-23 ºC). Four enrichment media of varying DHA content were prepared by diluting a custom enrichment preparation of 32% DHA of total fatty acids (Red Pepper®, Bernaqua, Belgium), which are listed in Table 1. These preparations were dispensed (1.5ml/200 x 103 nauplii; Bernaqua protocol) to the Artemia enrichment tanks stocked with 500x103 nauplii/l by a peristaltic pump over a period of time and harvested after 16 hours of enrichment. Then the nauplii were washed, counted, and fed to 17 DPH larvae at 0.1 nauplii/l. This concentration progressively increased to 4 nauplii/l in 34 DPH larvae. Artemia nauplii were sampled frequently from the enrichment treatments, washed on a circular mesh with freshwater and then double distilled water (DDW) and stored (-20 ºC) under nitrogen until analysis for fatty acid content.
Rotifers and Artemia nauplii feeding protocol
To provide the enrichment diet for all GSB larval stages of development up to 34 DPH, rotifers were exclusively provided until 16 DPH. Although the rotifer treatments continued to be offered throughout larval rearing, the larvae from 17-34 DPH are assumed to predominantly feed on Artemia nauplii due to its larger size compared to rotifers. Larvae sampled at 17 DPH would have fed only on rotifers having one of 4 DHA levels (mg DHA/g DW); Control or non-enriched Low (L), Intermediate-Low (I-L), Intermediate-High (I-H), and High (H), and are listed in Table 1. On the other hand, older 34 DPH larvae were also exposed to the Artemia DHA treatments that differed from rotifers in their L, I-L, I-H, and H DHA levels. This means that these older fish were fed a range of DHA levels in the live food they consumed. Consequently, the DHA rotifer-Artemia ranges in the L, I-L, I-H and H treatments that 34 DPH larvae were consuming were 0.99-0.0, 1.9-2.6, 3.2-7.2, and 12.1-11.8 mg DHA/g DW prey, respectively (Table 1).
Total larval length
Five larvae from each tank were frequently sampled for total larval length (TL) from 6 - 31 DPH using an ocular micrometer after calibration with a stage micrometer (±0.5 mm).
Fatty acid analysis
Larvae were gently washed on a filter with freshwater followed by a washing with double distilled water (DDW) and the filter then placed on ice. Larvae were then collected with fine forceps, to avoid damaging the fish, and transferred (≥ 100 mg tissue wet weight; WW) into sampling Eppendorf tubes (1.5 ml) for storage at -30 °C until lyophilization. The lyophilized samples were then weighed for DW determination and about 10 mg of tissue from each sample were then prepared for fatty acid analysis.
Fatty acid analysis was carried out by chloroform - methanol (2:1) extraction of total lipid from freeze dried tissue samples.23 The lipid-containing chloroform upper phase was removed and evaporated to dryness under a stream of nitrogen and total lipid weighed (GH-120 analytical balance, A&D, San Jose, CA, USA). This was followed by the addition of the internal standard 17:0 (heptadecanoic acid; Sigma, St. Louis, MO, USA) to each of the samples. The samples were then transmethylated to their fatty acid methyl esters (FAME), using a modified procedure of Rule,24 by adding 1 ml/mg lipid of a 14% solution of boron trifluoride methanol (BF3) and sonicated for 1 h at 50 °C. To the samples were added 0.5 ml DDW and 1 ml/ 1mg lipid of analytical grade hexane (99%), which was vortexed and then centrifuged (2300 rpm) for 2 min. The FAME was analyzed by a Varian 450–220 GC/MS/MS (Agilent technologies, California, USA). Injected FAME samples (1 μl) were separated on a Varian WCOT fused silica column (50M ×0.32mm) at a flow rate of 1.5 ml/min and fatty acids identified by known purified standards and quantified using a response factor to the internal standard. The 30 min oven temperature program began at 70 °C and held for 2 min followed by a temperature ramp to 170 °C at 30 °C/min and held for 4 min.
Total RNA extraction
Five 34 DPH larvae per tank were gently washed on a sampling circular mesh with seawater, placedon ice and transferred gently (≥ 100 mg tissue wet weight) into sampling Eppendorf tubes (1.5 ml) and stored at -70ºC until RNA extraction. Total RNA extraction was performed from the sampled larvae, with BioTri (Biolab; 959758027100), according to its protocol. Total RNA concentration in each sample was determined in a plate reader (BioTek, Synergy HT), using Gene5 software. An amount of 1µg of RNA was diluted (with DDW) to a final volume of 10µl. Samples were treated with RNase-free DNase (Promega, M1601), followed by cDNA synthesis (Quanta; 95047-100). Primers specific to the sequences of sea bream rhodopsin (NCBI; GenBank: DQ197907.1) and 18S (NCBI; GenBank: AY993930.1), that was used as a reference gene, were designed using the Primer Express 3 (Invitrogen; 4363991) software and received from Hylabs (Rehovot, Israel) as synthetic DNA. Quantification of rhodopsin sequences in the samples was performed using Perfecta SYBR Green FastMix (95074-012) (Quantabio, Beverly, MA, USA) reaction volume of 10µl, in a quantitative PCR system (Applied Biosystems, 7500 Fast Real Time PCR System). ΔΔCt analysis of the relative quantity25 of rhodopsin sequences was performed, using the 7500 software. RNA integrity was confirmed by separating the RNA fragments in three random samples of total extracted RNA using a standard gel electrophoresis procedure (common RNA integrity check- according to Invitrogen protocols). In Table 2 the primers and partial sequence of rhodopsin (RH1) gene in gilthead sea bream are shown.
Histology
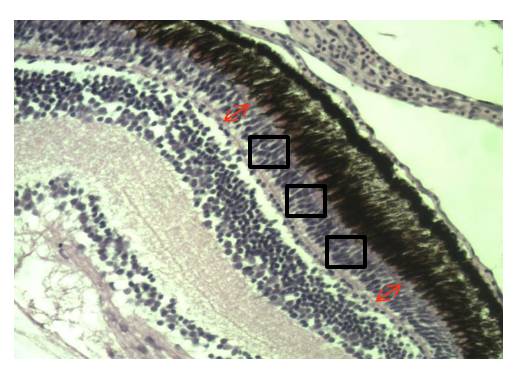
Five 34 DPH larvae per tank were sampled for histological examination, kept on ice, collected with fine forceps, and gently placed into Eppendorf sampling tubes (1.5 ml) filled with paraformaldehyde (PFA) 4% (Sigma, Israel). These tubes were stored at room temperature until histological analysis. Standard protocol for histological analysis was implemented.26 Briefly, larvae were fixed and stored (~2 months) in PFA 4% solution (PFA). Samples were dehydrated in a series of 2 h exposures in the following solutions: 30%, 50% and then 70% ethanol stored overnight. The following day samples were exposed to 95% ethanol for 3 hours (twice), and finally 100% ethanol for 1 hour (twice) and stored in 100% ethanol. Samples were cleared in K-Clear (Kaltek, Padova, Italy) before being embedded in paraplast (Sigma P3558) and cut to a thickness of 6 µm with a Leica RM2245 microtome. Sections were placed on slides and stained with hematoxylin-eosin (HE) that stained cell nuclei and eosinophilic cell structures in the tissues. Slides were examined under a microscope (Leica DM750) and photographed with Optikam (Optika, Via Riglia 32; 24010 Ponteranica, Italy) Pro 5 camera, using Optika Pro Vision software (Figure 1; magnification of x200). Abundance of photoreceptor cells (rods and cones) in the sectioned retinas was determined by cell count per random area unit.
.png)
Data Analysis
ANOVA analyses and Barlett’s test for equal variances were carried out simultaneously. If significance (P < 0.05) was found for ANOVA while Barlett’s test was not significant (P > 0.05), then testing differences between groups was carried out by Tukey’s multiple comparison test. In cases where ANOVA and Barlett’s test were both significant (P < 0.05), then the non-parametric Kruskal Wallis Test was applied followed by Dunn’s multiple Comparison test to determine significant (P < 0.05) differences among treatments. All data are presented as mean ± SEM. Measured parameters as a function of larval age were first analyzed for the probability which of two curve models are the most suitable for further analysis according to Akaike’s information criterion (AIC). Then the chosen curve model (based on >50% probability) is employed in linear or non-linear regression analysis (The GraphPad Prism 8 program) to compare treatments.
Ethics statement
All experimental animal procedures were conducted in compliance with the Guidelines of the European Union Council (86/609/EU) for the use of laboratory animals.
Results
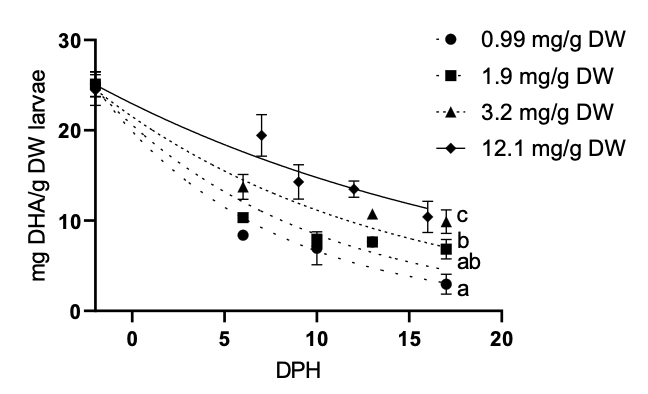
In Figure 2, larval whole-body DHA, independent of the rotifer treatments fed to the fish until 17 dph, markedly (P < 0.0001) decreased with age (DPH). The negative doubling time of these inverse exponential curves represents the time (days) for larval DHA to be reduced by half. Consequently, the 0.99 mg DHA/g DW control exhibited a significantly (P < 0.05) shorter negative doubling time (-6.32 days) than the 3.2 and 12.1 mg DHA/g DW treatments (-10.55 and -15.74 days, respectively), while there was no significant (P > 0.05) negative doubling time difference between the control and the 1.9 mg DHA/g DW treatments (-6.32 and -7.78 days, respectively) (Figure 2).
_to_17_dph_larvae_in_all_dha_treatments_decreased.png)
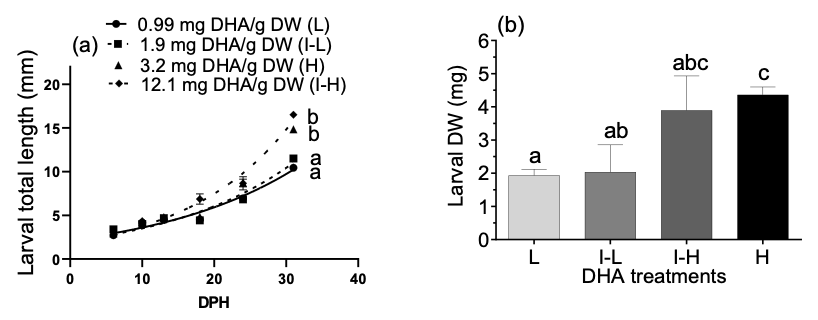
In Figure 3a, GSB larvae fed the DHA rotifer treatments demonstrated exponential growth in TL from 6-31 dph that increased with dietary DHA inclusion and was highly significant (P<0.0001) between the 0.99 mg and 1.9 mg DHA/g DW treatments and the 3.2 and 12.1 mg DHA/g DW treatments. At 34 DPH seabream larvae fed the highest (H) dietary DHA dose range (12.1-11.8 mg DHA/g DW prey) were 226% heavier (DW) than the control (L) larvae that were fed a DHA range of 0.99-0.0 mg DHA/g DW prey (P<0.05; Figure 3b).
_the_effect_of_only_rotifer_dha_on_exponential_larval_growth_in_total_length_from_6-31_.png)
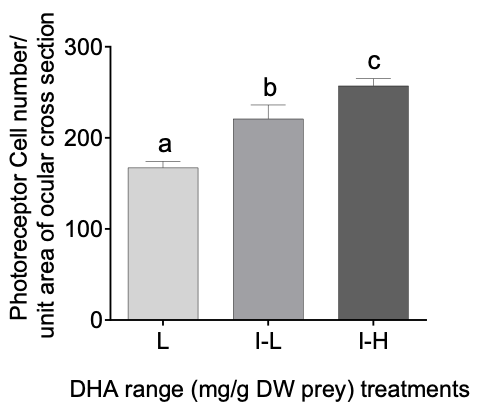
There was a significant (P < 0.005) prey DHA dose-range dependent effect on the abundance of photoreceptor cells in the retina of 34 DPH larvae. Figure 4 shows that a dietary DHA increase in the intermediate-low DHA range (I-L) larvae resulted in a significant (P < 0.05) 32% increase in retinal photoreceptor abundance over fish in the control or low DHA treatment (L) treatment. In addition, the higher DHA range in the intermediate-high DHA range (I-H) treatment demonstrated a further and marked (P < 0.05) 16% increase in photoreceptor abundance over larvae from the I-L treatment. Unfortunately, due to technical issues, the samples for photoreceptor analysis of the High (H) DHA group were lost.
_treatments_low_(l)__intermediate_low_(i-l)_and_.png)
In Figure 5 the gene expression of rhodopsin in sea bream larvae positively increased (P<0.05) with dietary DHA dose range (L, I-L, I-H and H) and larval age (P<0.0001), despite the variability in the high DHA treatment.
_on_the_age-dependent_relati.png)
Discussion
Numerous studies have associated DHA with vision and neural development in fish larvae.5,8,11,12,15,17,18,27,28 Several authors have reported that increased dietary DHA or n-3 long chain polyunsaturated fatty acids (LCPUFA) improved feeding behavior in herring larvae8 and larval prey consumption in GSB5,17 as well as bluefin tuna (Thunnus thynnus).29
In our study, the DHA-modulated increase in rhodopsin gene expression, and photoreceptor abundance likely led to improved vision and prey consumption. A DHA dose dependent effect on prey capture success under reduced light intensities was reported in herring (Clupea harengus)8,15 and GSB larvae5,13 and was presumably the result of increased rhodopsin synthesis. Therefore, it follows that improved prey consumption, due to enhanced vision, is a main contributor to larval weight gain. In fact, the present study demonstrated a marked (P < 0.05) increase in GSB larval growth, in terms of TL and DW, with prey DHA.
There was an increasing abundance of retinal photoreceptor cells in 34 DPH GSB larvae with each augmentation of dietary DHA dose range. This is in accord with Shields et al.,10 who inferred an association between retinal rod cells and dietary DHA in halibut larvae, while Bell and Dick30 found that the amount of phospholipid di22:6n-3 in herring eyes correlated with the rising proportion of rods in the photoreceptor population. Koven et al.29 and Gaon et al.18 reported increased cone and rod photoreceptor cell abundance with dietary DHA in bluefin tuna (Thunnus thynnus) and GSB larvae, respectively.
Nevertheless, the physiology underpinning the link between dietary DHA and photoreceptor abundance remains obscure with only a few papers discussing this in fish.10,30 Importantly, increased retinal rhodopsin and opsin synthesis positively correlated with dietary DHA content18 but this does not necessarily lead to increased photoreceptor abundance. In fact, enhanced levels of retinal proteins might contribute only to higher photopigment density in photoreceptor disc membranes without necessarily increasing their presence. In support of this, Senapati et al.31 found that increased packing of photopigments in the photoreceptor disc membranes, which was coincident with fewer discs and shortened outer segments, was the adaptive response to retinal DHA deficiency in rats and lead to impaired vision. Conversely, this suggests that when there are higher levels of DHA and rhodopsin protein, as was found in our study, conditions would be ideal to encourage disc membrane assemblage and synthesis leading to higher photoreceptor abundance as well as promoting membrane fluidity.32
In fact, the very high DHA moiety in retinal lipid membranes appears to provide the physiologically relevant environment that facilitates rhodopsin function and encourage rhodopsin expression and synthesis as well as delaying the onset of apoptosis (Koven, pers communication). The DHA rich membranes react specifically with rhodopsin hydrophobic transmembrane helices so that the membrane phospholipid organization changes upon light activation and phototransduction.33 In addition, DHA facilitated photoreceptor maturation of the outer disc membranes, which led to increased photoreceptor abundance.34
DHA-modulated photoreceptor abundance may also be affected by the protective effect of this LCPUFA on photoreceptor survival and differentiation, which has been widely reported in mammals.35–37 However, at first glance this seems counter intuitive. This is because the large number of double bonds in DHA together with retinal tissue’s exposure to high oxygen levels and light would likely encourage decreased photoreceptor survival and differentiation due to oxidative damage to cells and their removal by apoptosis. In contrast, several authors35,38 reported that DHA prevented oxidative stress-induced apoptosis in photoreceptors through its conversion to neuroprotectin D139 and/or its upregulation of Bcl-2 proteins, which inactivate proapoptotic proteins.35,40
The decrease in larval tissue DHA with age during rotifer feeding, albeit maintaining the correlation between larval whole body and prey DHA, is in accord with Watanabe14 who reported similar results for a number of marine larval fish species. Interestingly, Gaon et al.18 concluded that the rotifer DHA growth-promoting effect in GSB was markedly enhanced with taurine, a β-amino sulfonic acid that plays an array of critical roles that promote fish growth. Taurine contributes markedly to digestion and absorption in fish, where it conjugates with bile acids to form bile salts.41–43 As emulsification capacity would decline, due to reduced taurine ingestion, it follows that this would lead to a decrease in the digestion and absorption of essential LCPUFAs, including DHA, into the tissues.
In summary, this study established the link between dietary DHA level, photoreceptor abundance and rhodopsin expression, which would likely improve vision leading to improved prey capture and growth in developing gilthead sea bream larvae. However, decreasing tissue DHA with larval age during rotifer feeding suggests that taurine enrichment of this zooplankter is required to boost emulsification and the tissue incorporation of essential fatty acids such as DHA.
Acknowledgments
This project received no formal funding from any specific source. We are grateful to the Ardag fish farm (Eilat, Israel) for their contribution of gilthead sea bream fertilized eggs for this study.
CRediT
Conceptualization: William Koven and Amos Tandler; Methodology: Anton Levitan, Oriya Nixon, Aviad Gaon; Formal analysis and investigation: Anton Levitan; Writing - original draft preparation: William Koven, Amos Tandler; Writing - review and editing: William Koven; Funding acquisition: William Koven; Resources: The National Center for Mariculture; Supervision: William Koven, Amos Tandler.