


Introduction
With the development of technology, aquaculture has changed from a traditional mode to an intensive culture mode.1 However, poor water quality, improper nutrition, fishing, and other factors will affect the intestinal mucosal barrier and lead to intestinal damage. Bacterial enteritis can quickly occur in the deterioration of water quality in fish ponds and the intake of rotten feed by fish, which leads to the decrease of disease resistance of fish. High-fat and high-protein feed was usually used to promote fish growth, reduce nitrogen and phosphorus discharge in water and protect the environment. However, too much fat and protein in the diet can lead to adverse effects such as fat accumulation, oxidative damage, and intestinal inflammation in fish.2 Feeding with a high-fat diet led to liver steatosis and intestinal barrier damage in zebrafish.3 Oxidative stress and liver tissue damage in halibut and hybrid grouper were also common in high-fat feeding.4,5 Plant protein was widely used in production to replace fish meal as the main feeding component, resulting in frequent foodborne enteritis in aquaculture.6 In previous studies, plant protein-based diets affected metabolism-related genes in juvenile rainbow trout’s intestinal and liver transcriptome.7 Once suffering from enteritis, the growth of aquatic animals will be inhibited for a long time.8 Minor intestinal injuries or diseases are often difficult to detect in the early stage because aquatic animals live in water. However, a comprehensive pathological evaluation standard was still lacking in judging whether aquatic animals were infected with enteritis.
A. hydrophlia, a Gram-negative bacterium, is the pathogen of human-animal-fish symbiosis and widely exists in various water environments, such as rivers, lakes, swamps and marine water.9 In aquatic animals, A. hydrophlia mainly infects grass carp, carp, silver carp, bighead carp, perch, and other aquatic animals and causes diseases such as enteritis, hemorrhagic sepsis, red sores, and ulcer, and so on, causing significant economic losses all over the world.10 The conditional pathogens in normal freshwater fish were mainly divided into 8 genera, Aeromonas accounts for the largest proportion, one of the primary pathogens causing fish bacterial enteritis.11 The main symptoms of enteritis caused by A. hydrophlia infection were decreased food intake, blackening of body color, redness and swelling of the anus, whitening of excreta, enlargement of the abdomen, hydronephrosis of the digestive tract, light yellow thick fluid may flow out of the anus with gently pressing the abdomen of diseased fish, hyperemia and yellowish or blue mucus in the intestine.12 As the main economic animals in Chinese aquaculture, largemouth bass and channel catfish have the advantages of high nutritional value and delicious meat. In recent years, with the expansion of the culture scale of largemouth bass and channel catfish, enteritis has become a familiar and frequently-occurring disease in culture. In this study, the intestinal injury model of fish was established by intraperitoneal injection of A. hydrophlia in largemouth bass and channel catfish, and gross pathological and histopathological changes established the intestinal injury evaluation method.
The intestines are one of the most important organs in aquatic animals, and they play an important role in various physiological functions. When inflammation occurs in enteritis, the endocrine and immune functions were impaired, and the function of digestion and absorption of nutrients was weakened.13 Mild enteritis often occurs in aquaculture, which does not show severe symptoms. Still, it will significantly impact the growth of aquatic animals and cause huge economic losses to aquaculture. These mild lesions were regarded as “unimportant lesions” and therefore ignored in pathological analysis. The diagnosis of enteritis was very difficult, provided there were only mild, non-specific histological changes. The pathological evaluation criteria established in this study were based on the intestinal structure and comprehensively observed the pathological changes in various parts of the intestine. When enteritis occurs, the body surface lesions are anal bleeding and inflammation, and intestinal lesions are mainly hyperemia or bleeding and intestinal mucosal injury. Under the microscope, the intestinal tissue of fish can be divided into the mucosal layer (mainly including lamina propria and mucosal epithelium), muscular layer, and serous layer. Enteritis lesions were mainly distributed in the mucosal layer, and there were almost no lesions in the muscular and serous layers. The specific lesions were inflammatory cell infiltration, hyperemia and an increase in thickness of lamina propria, an increase in the number of goblet cells, degeneration, necrosis, and proliferation of epithelial cells, and an increase in the number of bifurcated intestinal villi.14,15 Regarding the histopathological evaluation methods of poultry and other animals, we established a pathological evaluation method for evaluating the intestinal lesions of fish. Also, we provided a reference for the diagnosis of fish enteritis.
Materials and Methods
Bacterial strain
A. hydrophlia strain CW (GenBank: MN428791, identified and preserved by the Aquatic Animal Disease lab of Sichuan Agricultural University, Chengdu, China) was isolated from a dying Ictalurus punctatus.16 The strain CW was cultured overnight in the Luria Bertani (LB) broth at 28°C. Then the concentration of the strain was detected by spectrophotometry. Phosphate Buffer Saline (PBS) was added to adjust it to 1.0 × 10⁵, 1.0 × 10⁶, 1.0 × 10⁷ and 1.0 × 10⁸ CFU/mL.
Fish and feeding conditions
A total of 155 healthy largemouth bass and 155 channel catfish with an average weight of 50 ± 5.0 g were purchased from two fish farms in Sichuan. Microbiological, parasitical, and clinical examinations of randomly selected five fish just before the experiments demonstrated that these fish were fully healthy. All fish were fed with standardized circulating water at 26 ± 1°C. The feeding and handling procedures of all experimental animals were approved by the Animal Care and Use Committee of Sichuan Agricultural University under permit number HSH-S2020303099.
Experimental design
A total of 150 largemouth bass were randomly divided into 5 groups: 4 challenge groups (CH, fish were infected with A. hydrophila by intraperitoneal injection with a concentration of 200 µL 1x10⁸ CFU/mL, 1x10⁷ CFU/mL, 1x10⁶ CFU/mL, and 1x10⁵ CFU/mL, respectively) and a control group (NC). 150 Channel catfish were grouped in the same way. To establish an enteritis model, largemouth bass and channel catfish were infected with different concentrations of A. hydrophlia by intraperitoneal injection. The fish of the NC group received the same volume of sterile PBS solution. During the experiment, oxygen was supplied for 24 hours, and the fish were fed twice daily. After the challenge, gross symptoms, histopathological alterations, and the death of fish were observed and recorded twice a day.
Gross pathological analysis
Six largemouth bass were randomly selected from each group for pathology analysis on 2d, 6d, 9d, 12d, and 14d, respectively. Channel catfish were also treated in the same way. After being anesthetized with MS-222, gross lesions were mainly scored by the visual observation of the body surface and intestines. The pathological evaluation method in this study was adapted from the “I See Inside” (ISI) methodology of poultry, and the specific evaluation parameters were presented in Table 1.17–19 Similar to the ISI methodology, an impact factor (IF) was defined for each change in the macroscopic and microscopic analyses based on the reduction in organ functional capacity. IF ranges from 1 to 3, of which 3 have the most significant impact on changes in organ function. Based on the severity of the lesion, a score (S) of 0 to 6 was used to assess: (0) unchanged; (2) mild; (4) moderate; and (6) severe. The score for each section was the score (S) multiplied by the IF, and the final score was the sum of all the sections. Before dissection, the changes in ventral fin color, abdominal skin color and anal swelling, protrusion, and squeeze with or without feces were observed to score. Enteritis on the body surface was mainly manifested as inflammation of the anus. Therefore, the influencing factor of anal inflammation on the body surface was 3 points, and the rest were 1 point. After aseptic dissection, the intestines were taken out for observation and scored according to the color and transparency of the intestines, as well as the shedding and damage of the intestinal mucosa. Regarding the degree of influence on enteritis, the IF of these alterations was 2 points.
Histological analysis
The intestinal tissue was collected and fixed in a 10% formalin solution for 48 hours. After 48 hours, the same position of the foregut was taken out for histological embedding, made into paraffin sections, and stained with hematoxylin and eosin (H&E) and Alcian Blue and Periodic acid–Schiff (AB-PAS) staining for goblet cells staining.20 Histopathological evaluation methods were mainly based on the intestinal tissue structure of fish, including the mucosal layer (mucosal epithelium and lamina propria), submucosal layer, muscular layer, and serous layer. When enteritis occurs, the injury is generally expected in the mucous layer, mainly characterized by cell degeneration, necrosis, and proliferation, vasodilation and hyperemia, bleeding, inflammatory cell infiltration, etc. The mucosal epithelium was mainly composed of mucosal epithelial cells and goblet cells, and the main pathological changes were cell degeneration, necrosis, and proliferation. The lamina propria, submucosa, and serosa were prone to inflammatory cell infiltration, hyperemia or bleeding, resulting in increased thickness. The IF of the mucosal layer was set to 2 points, and the submucosal layer, muscle layer, and serous layer were set to 1 point. Cell necrosis was the most severe damage to intestinal function, so the IF was set to 3 points. In addition, the highest score was set for each part (Table 2).
Data analysis
All data were presented as mean ± SD (standard deviation). Charts were drawn by GraphPad Prism (USA) and Adobe Illustrator (USA) software. Statistical significance was analyzed using the unpaired two-tailed Student’s t-test or deviation analysis with GraphPad Prism. And the significant level was set as P < 0.05 (*), P < 0.01 (**) or P < 0.001 (***).
Results
Clinical symptoms of fish
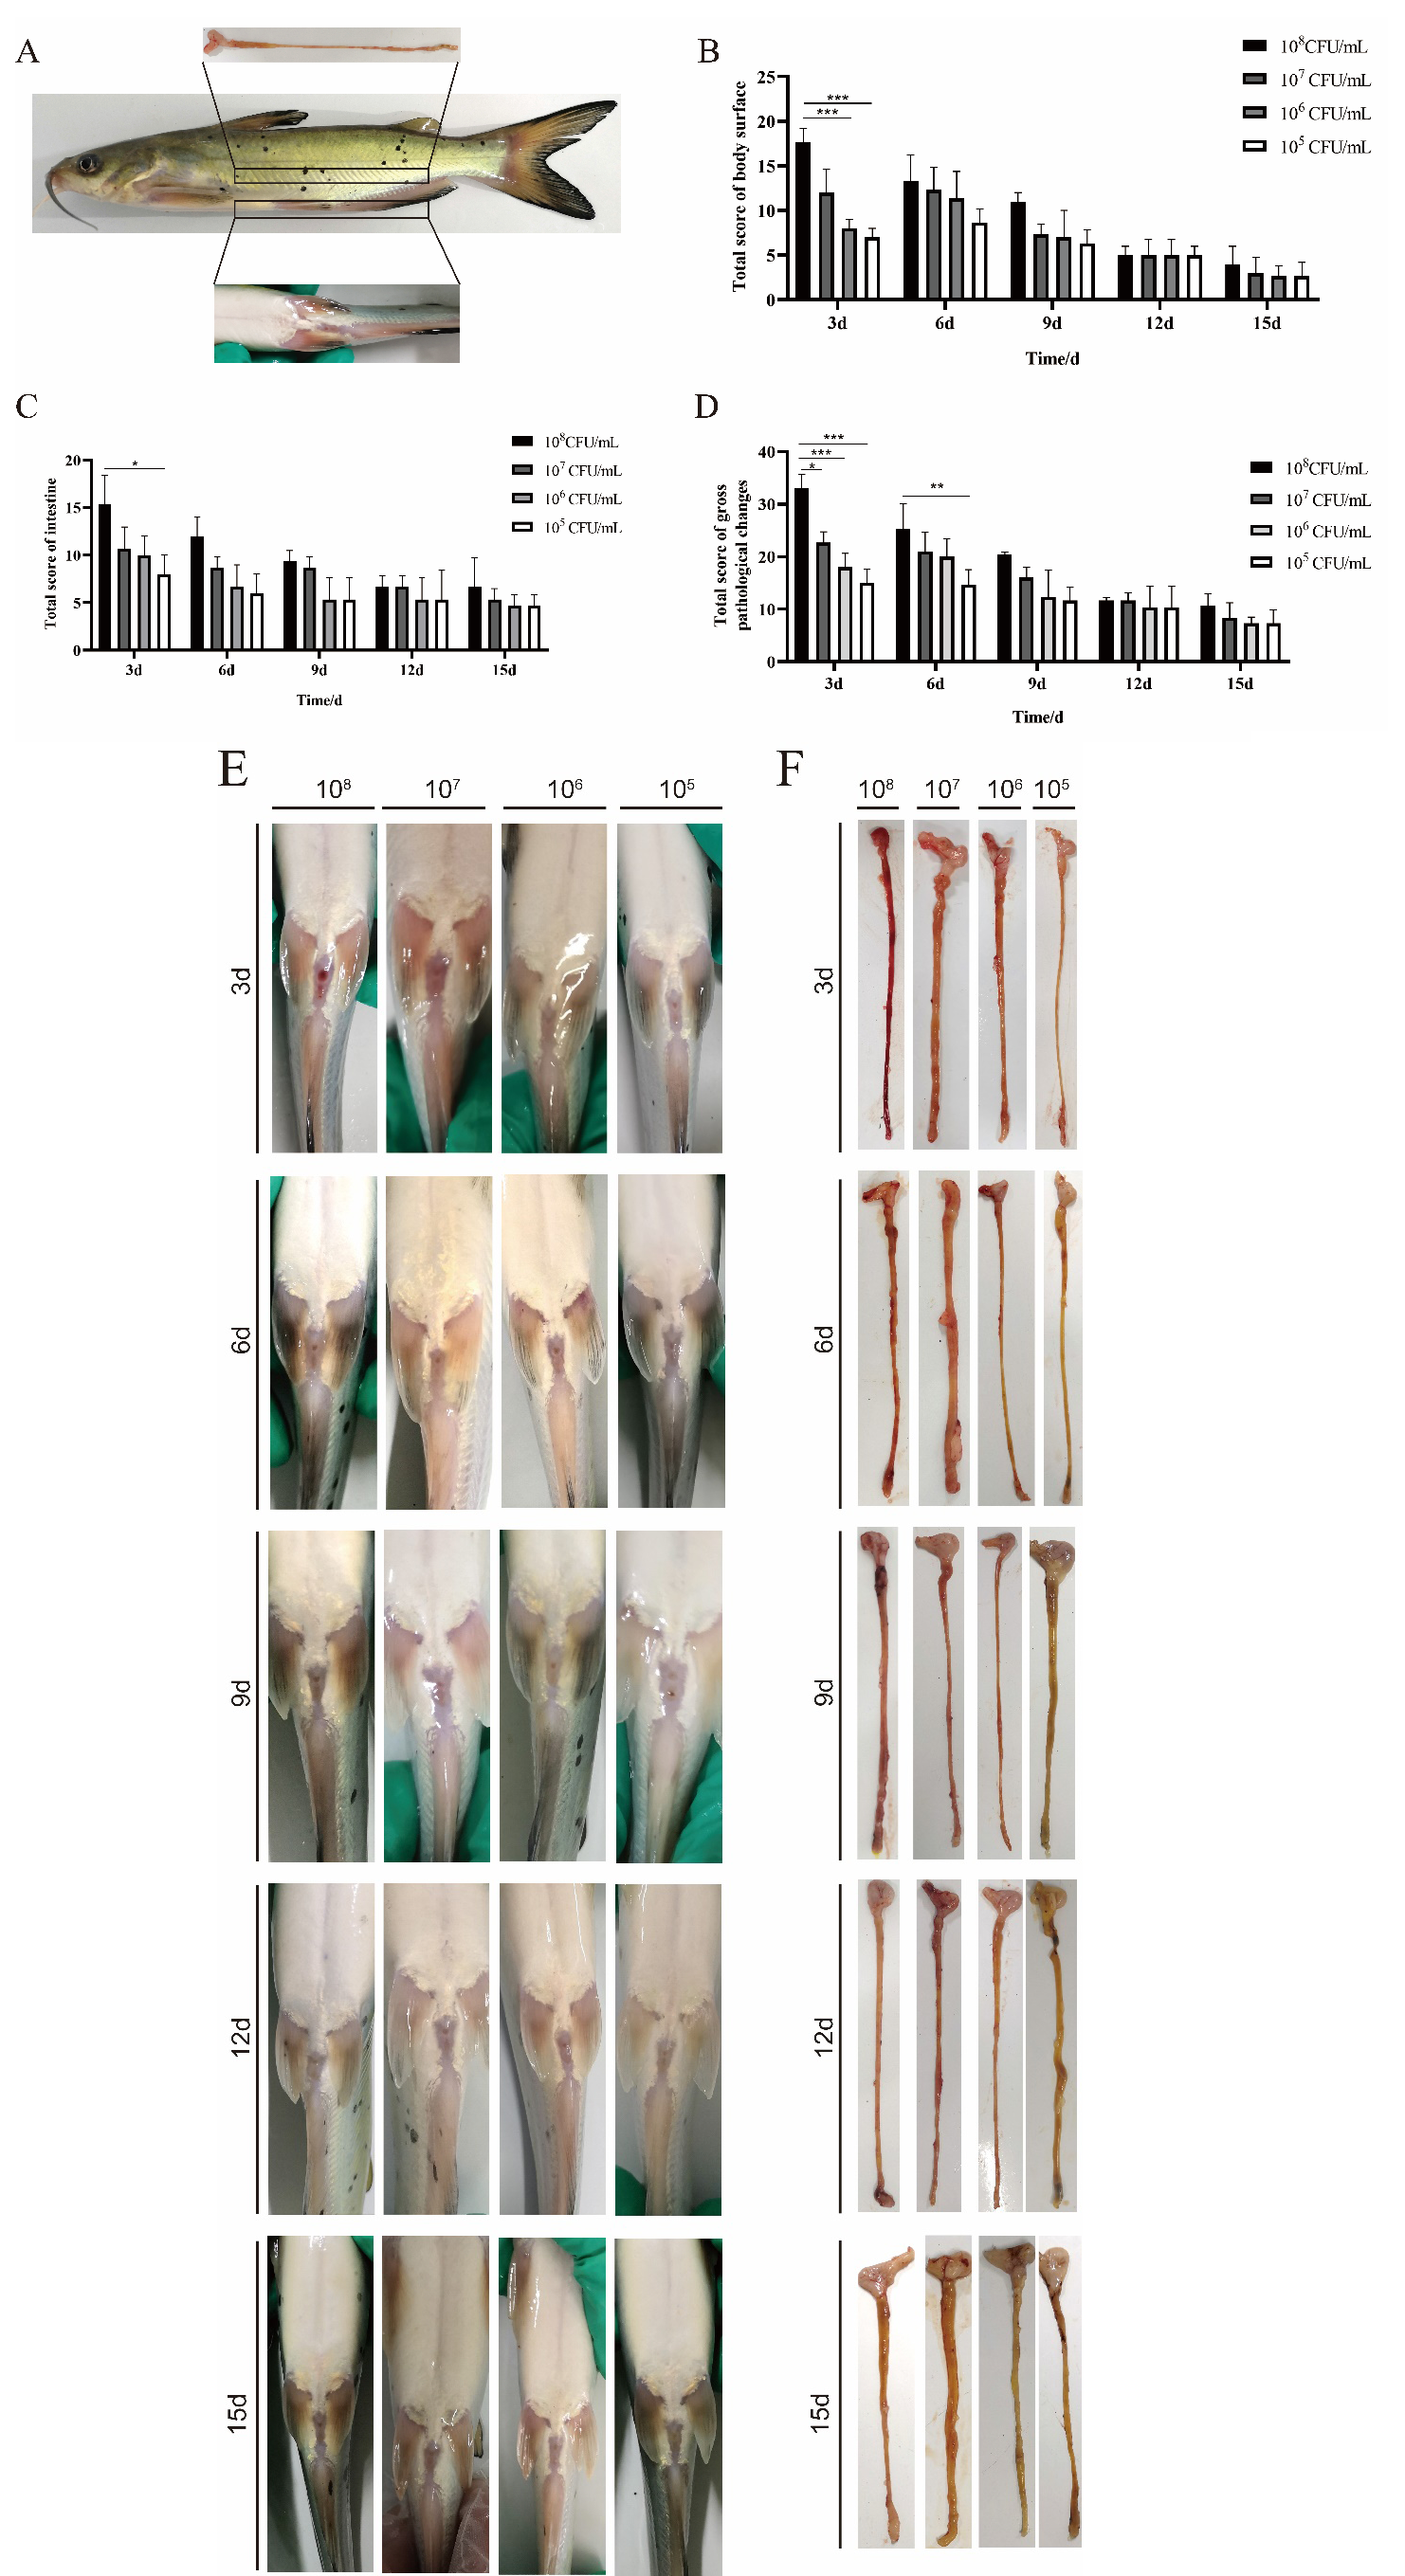
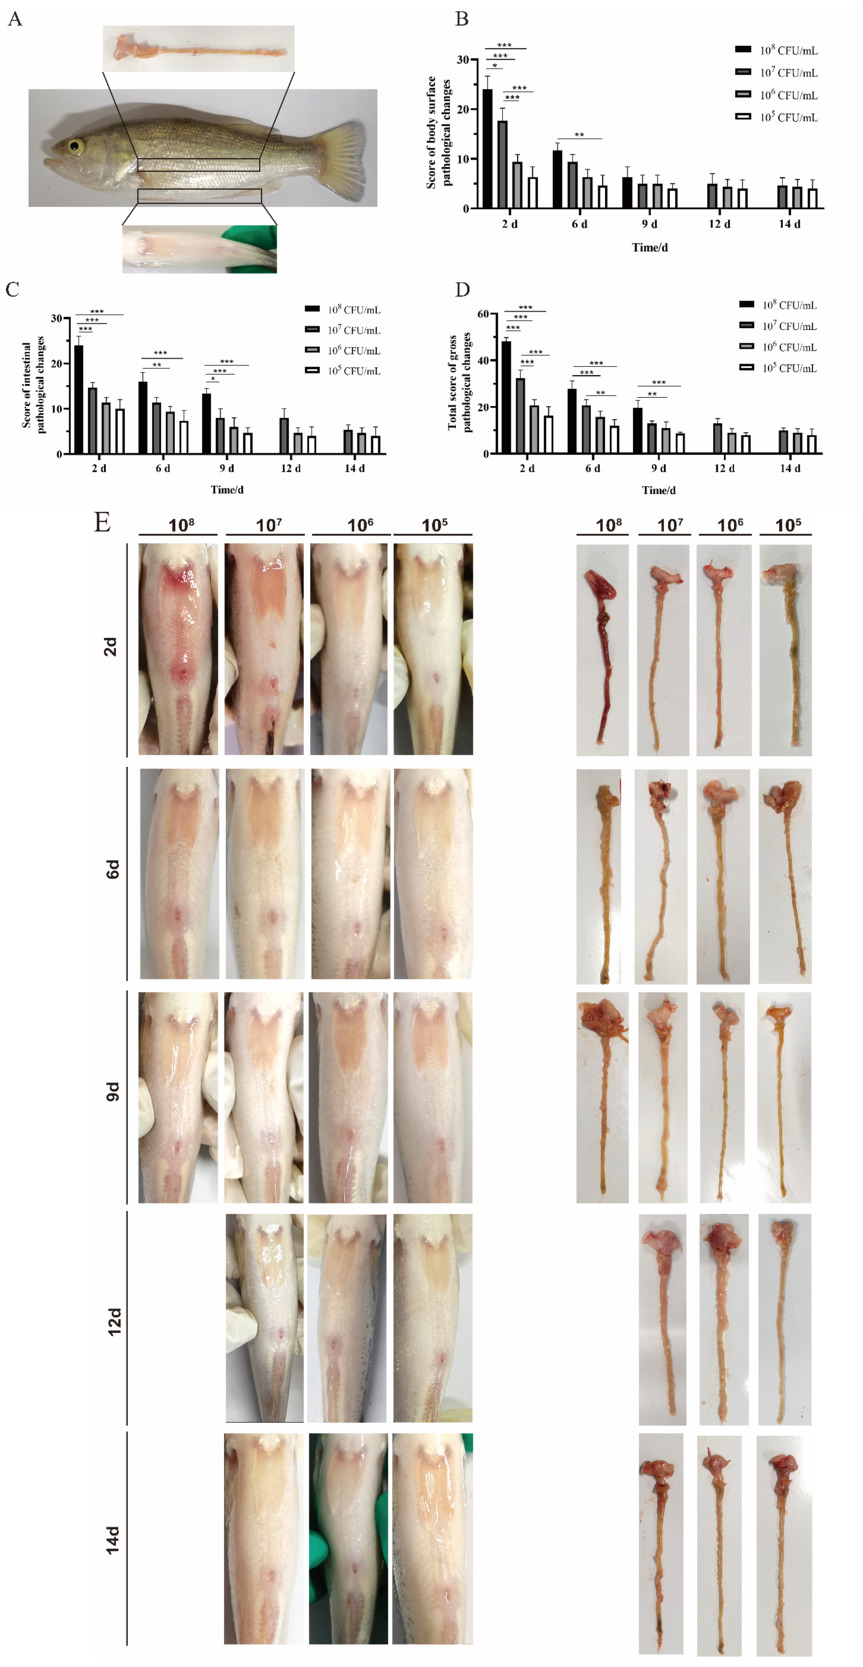
During the experiment, neither largemouth bass nor channel catfish in the control group showed clinical symptoms. They were no mortality and had normal swimming and feeding activity. In the experimental groups, as the infection concentration increased, the symptoms became more obvious, such as swimming slowly, reduced feeding intake, reddening of the abdominal skin and ventral fins, redness and swelling of the anus, and even fecal excretion when pressed. After dissection, the intestines were thinned and hyperemic, and there was intestinal fluid retention in the intestinal lumen. There were 12 fish died in largemouth bass and 3 fish died in channel catfish after infection with a high dose of A. hydrophlia (1.0×10⁸ CFU /mL), while the other dose groups had no death (Fig. 1E and 4 E).
Macroscopic analysis of Largemouth bass
Two days post-infection, the symptoms of anal redness, protrusion, abdominal fin, and abdominal skin bleeding on the body surface, intestinal congestion, bleeding, and intestinal mucosal exfoliation after dissection were observed in the challenge groups (Fig. 1E). With the extension of infection time and the decrease of infection concentration, the clinical symptoms and pathological scores of largemouth bass in the experimental groups showed a downward trend. On the 2nd day of infection, the pathological score of the body surface in the high-dose group was significantly higher than the other groups (107,106 and 105 challenge groups) (P < 0.001) (Fig. 1B). The intestinal pathological score was significantly different between the low dose groups (106 and 105 challenge groups) (P < 0.001) and the middle dose group (107 challenge group) (*P<*0.05). And compared with the low-dose group, the intestinal pathological score in the middle-dose group was significantly higher than that in the low-dose group (P < 0.001) (Fig. 1C). The total score of gross pathology in the high-dose group was significantly higher than that in the middle and low-dose groups (P < 0.001). There was a significant difference between the middle-dose group (P < 0.001) and the low-dose groups (P < 0.001) (Fig. 1D). On the 6th day of infection, the body surface pathological score of the high-dose group was significantly higher than that of the low dose groups (P < 0.01). The intestinal pathological score was significantly different from that of the 105-infection group (P < 0.01) (Fig. 1D). The total score of gross pathology in the high-dose group was higher than in other infection groups. There was a significant difference compared to the low-dose group (P < 0.01). The total score of gross pathology in the middle-dose group was higher than that in the low-dose groups. There was a significant difference compared with the 105 groups (P < 0.01) (Fig. 1D). On the 9th day of infection, the body surface pathological scores of high dose infection group were significantly different from those of other infection groups (P < 0.05) (Fig. 1B). There was no significant difference in intestinal pathology score (Fig. 1C). The total score of gross pathology was significantly higher than that of the low dose group (P < 0.001) (Fig. 1D). Nine days post-infection, there were no significant differences in body surface score, intestinal score and gross pathological score among the groups (Fig. 1B-D). The results were correlated with infection dose and time.
Microscopic observation and histopathological analysis of Largemouth bass
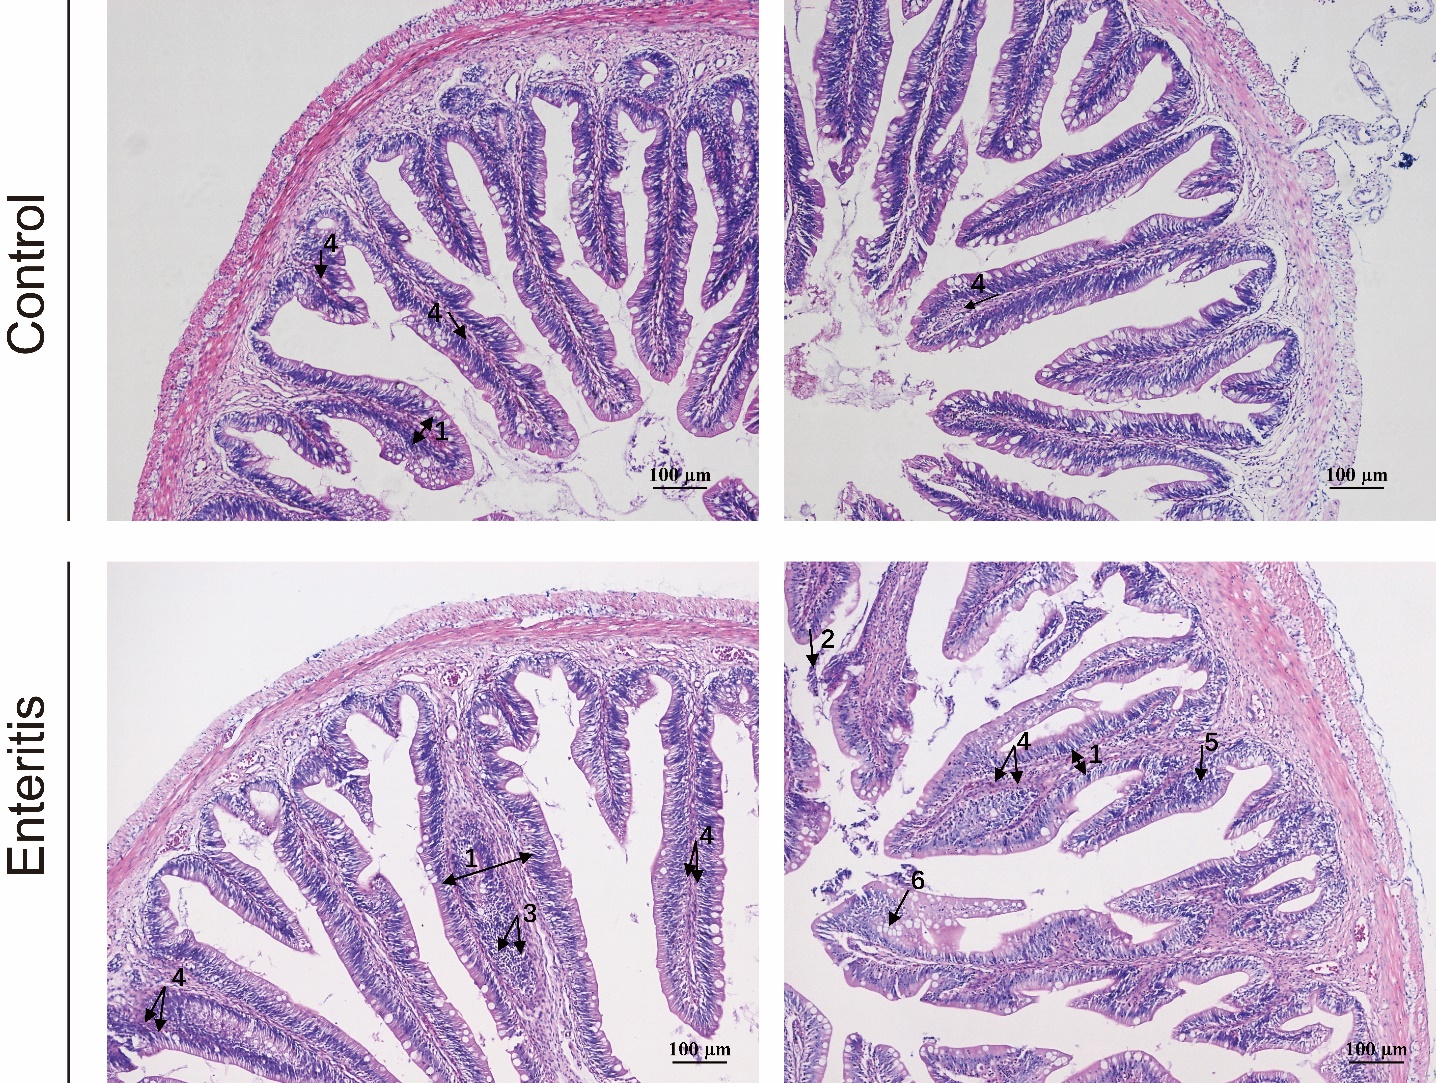
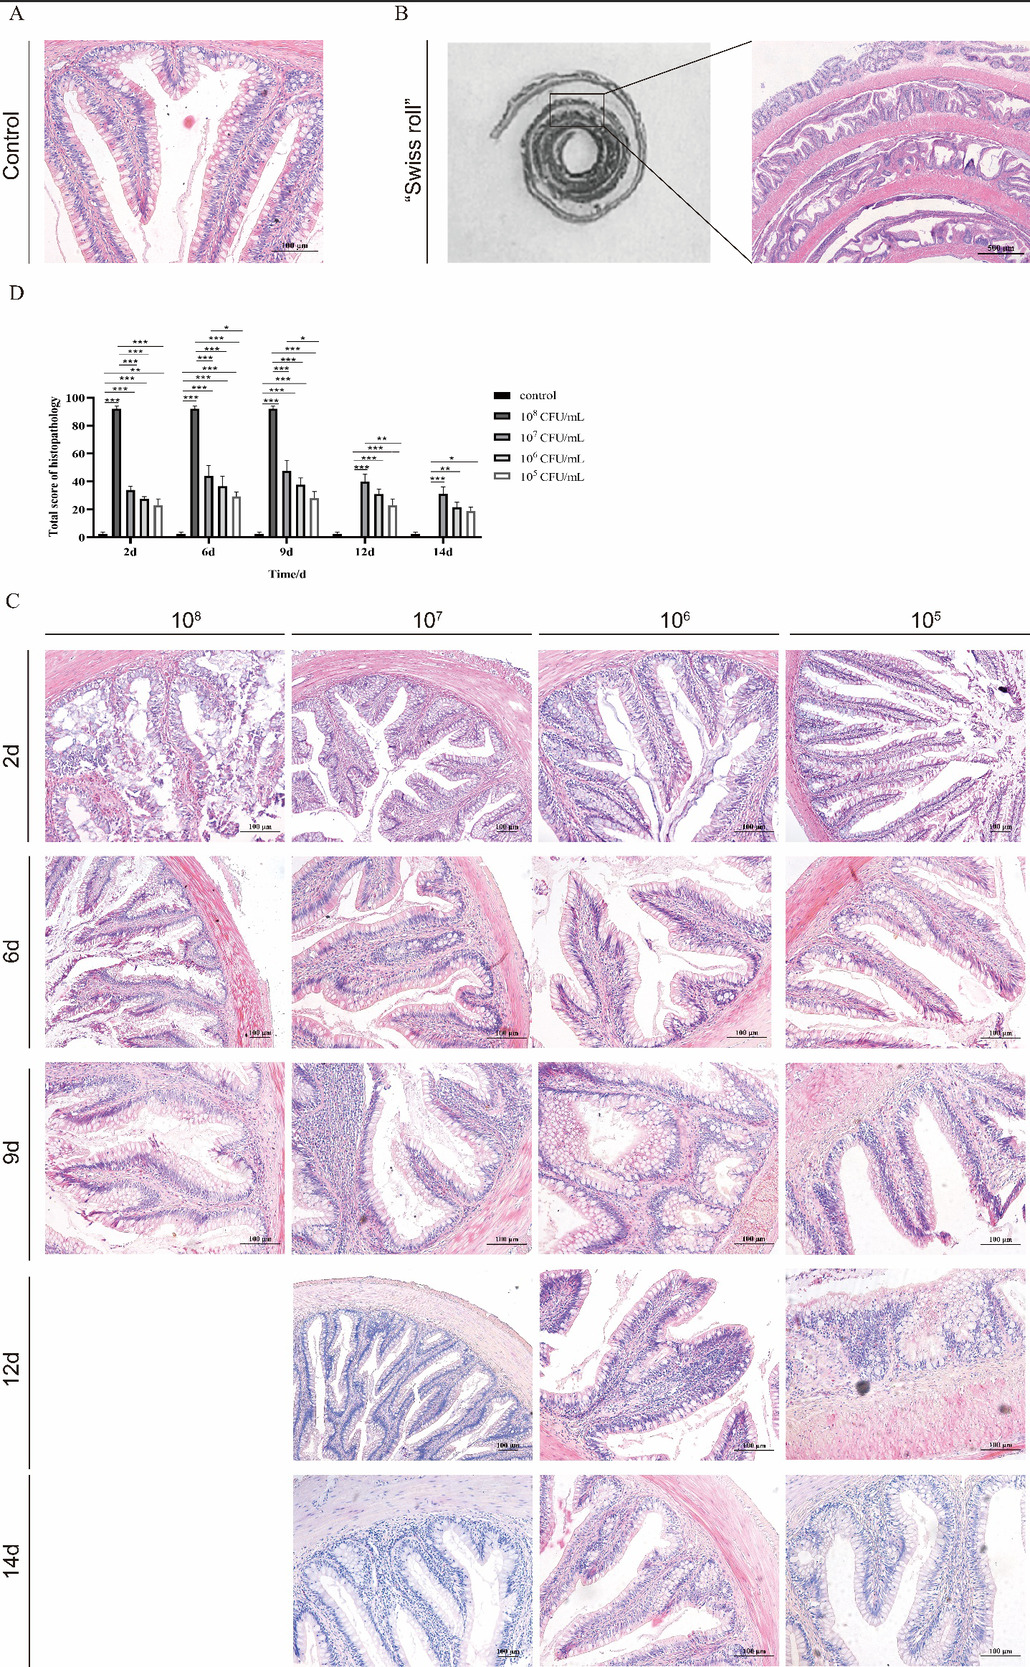
Compared with the control group, the intestines of the infection groups showed lesions with different degrees. The intact intestinal villi, clear intestinal wall structure, and complete cell morphology were observed under the microscope in the control group (Fig. 3). Enteritis groups showed intestinal mucosal epithelial injury and exfoliation; intestinal lamina propria hyperemia and edema, thickness increased, and accompanied by inflammatory cell infiltration, intestinal epithelial cell proliferation, degeneration and necrosis, goblet cells increased after Alcian Blue staining (Fig. 3).
With the increase in the concentration of A. hydrophila infection, the changes of intestinal pathological histology in each experimental group were more serious (Fig. 2C). Consistent with general lesions, as the time of infection increases, the pathological changes in intestinal tissue gradually decrease. To comprehensively evaluate the pathological changes of intestinal tissue in fish, our study used the “Swiss roll” to evaluate enteritis from different sections (Fig. 2B). The highest pathological score of intestinal tissue was the highest infection dose of A. hydrophila (Fig. 2D). On the 3rd, 6th and 9th day of infection, the total score of histopathology in the infection group was significantly higher than the control group (P < 0.01). The score in the high-dose infection group was significantly higher than in other infection groups (P < 0.001). On the 12th and 14th day of post-infection, the total histopathological scores of 107, 106, and 105 groups were significantly higher than the control group. Still, there was no significant difference (P < 0.05) (Fig. 2D). The results were caused by congestion of lamina propria, infiltration of inflammatory cells, and cell proliferation of mucosal epithelium in the enteritis group, which finally led to an increase in score.

Total pathological score of Largemouth bass
According to the gross and histological pathological scores of largemouth bass, the total score of the challenge groups was significantly higher than that of the control group at each time point, and the pathology score gradually increased with the increase of the challenge dose (Fig. 7A). The total intestinal score of the high-dose infection group was significantly higher than that of the other infection groups on the 2nd, 6th and 9th day (P < 0.001). And the intestinal score of the middle-dose group was significantly higher than that of the low-dose group on the 2nd and 6th day and extremely significantly higher than that of the 105 CFU/mL infection group on the 9th day (Fig. 7A).
Macroscopic analysis of Channel catfish
Channel catfish in experimental groups showed different degrees of enteritis symptoms. And the severity of enteritis symptoms was positively correlated with the infection dose and negatively correlated with the infection time (Fig. 4E). In the body surface, the score of the high-dose group (1.0×10⁸ CFU/mL) reached the maximum on the 3rd day, while the middle-does (1.0×10⁷CFU/mL) and low-dose groups (1.0×105,1.0×106 CFU/mL) reached the maximum on the 6th day. On the 3rd day, the body surface score of the high dose group was significantly higher than that of the low dose group (P<0.001), but there was no significant difference at other time points (Fig. 4B). In the intestinal score, the maximum score of each experimental group appeared on the 3rd day, and the group infected with 1.0×10⁸ CFU/mL was significantly higher than that of the group infected with 1.0×10⁵ CFU/mL, and there was no significant difference in other results (Fig. 4C). From the comprehensive point of view of body surface and intestinal score, the total score of channel catfish in the high dose group (1.0×10⁸ CFU/mL) was significantly higher than that in the middle (1.0×10⁷ CFU/mL) (P<0.05) and low dose groups (1.0×106,1.0×105 CFU/mL) (P<0.001) on the 3rd day, and that in the high-dose group (1.0×10⁸ CFU/mL) was significantly higher than that in the lowest-dose group (1.0×10⁵ CFU/mL) (P<0.01) on the 6th day (Fig. 4D). And after 12 days of infection, all the experimental fish showed no apparent symptoms and returned back to normal. These results showed that the symptoms of enteritis were related to the dose and time of infection.

Microscopic observation and histopathological analysis of Channel catfish
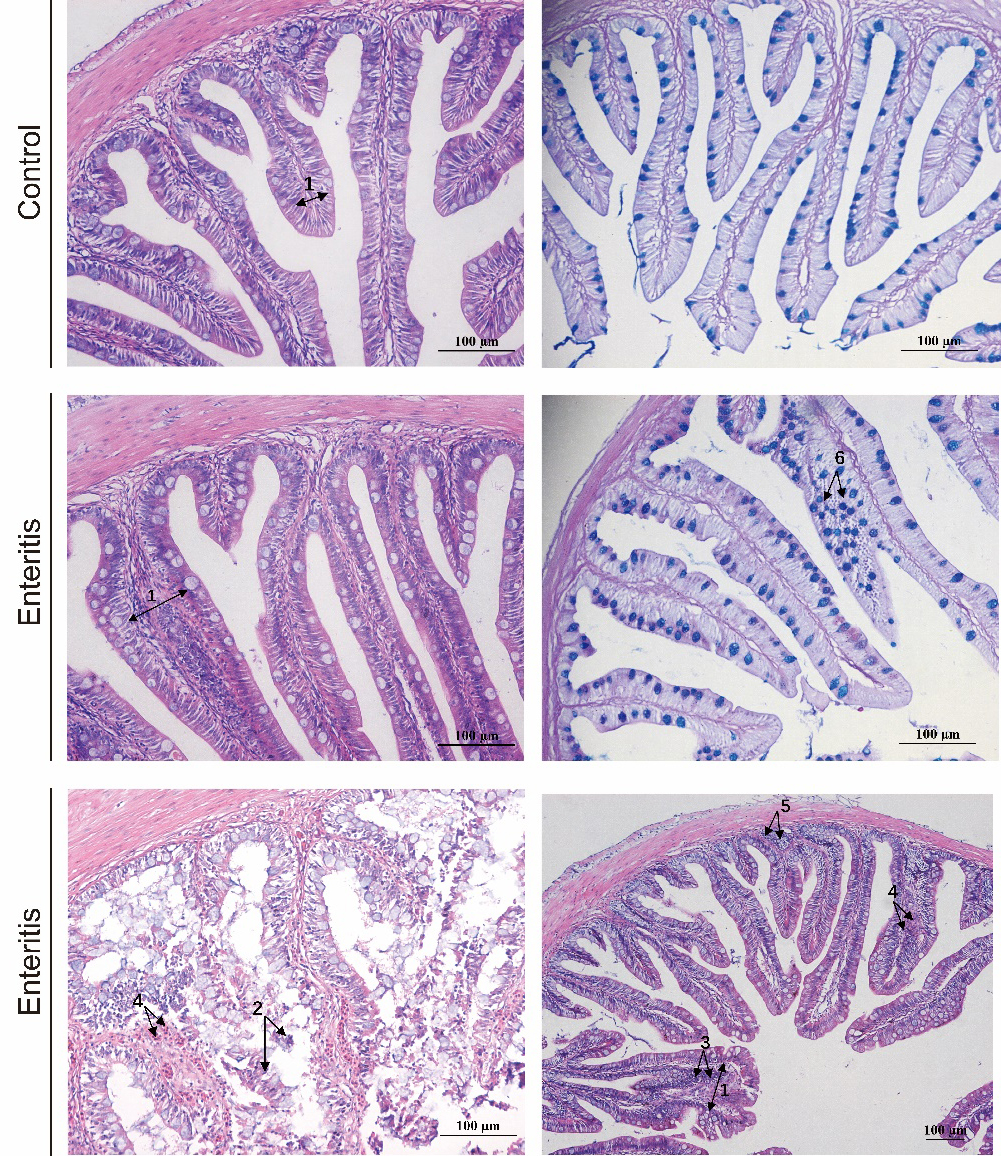
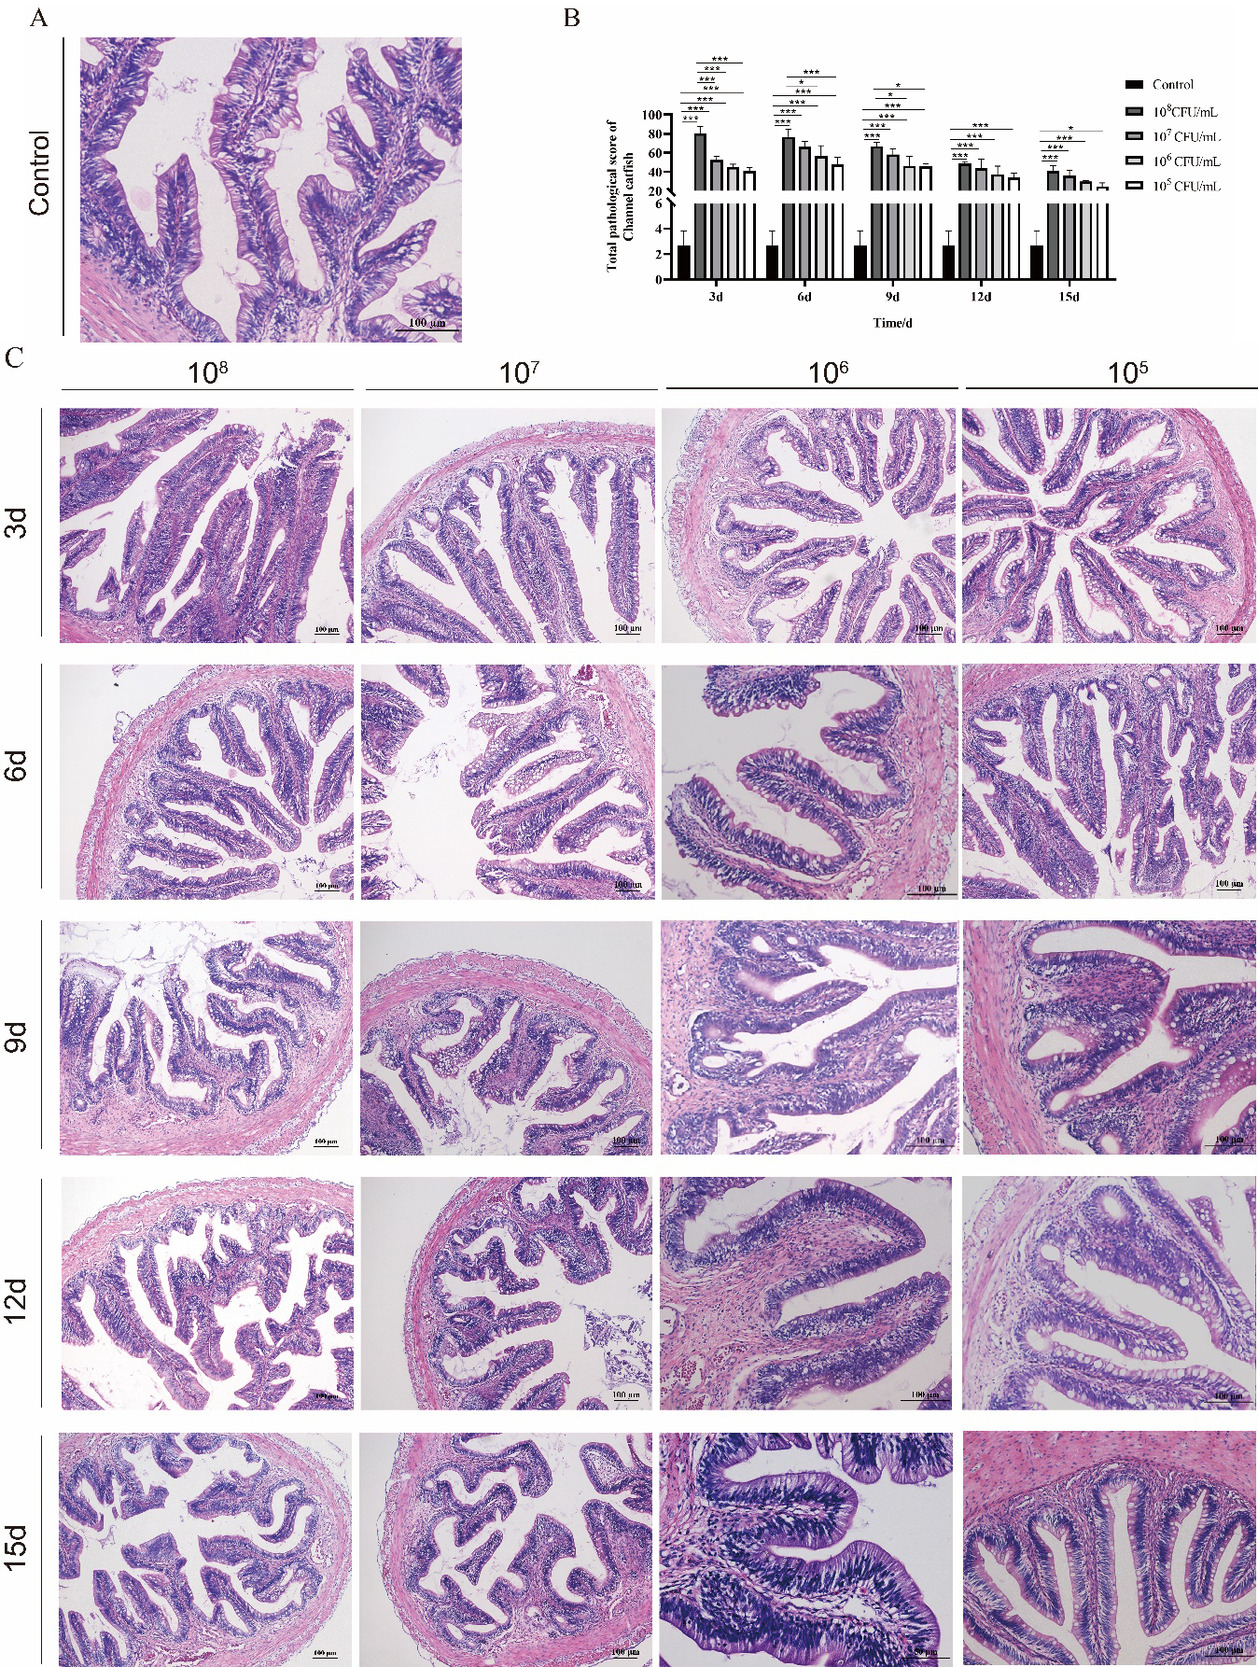
In the control group, a small amount of hyperemia in the lamina propria, intact intestinal villi, normal morphological epithelial cells, and goblet cells can be observed under the microscope (Fig. 6). After the challenge, the lamina propria of the channel catfish intestine thickened, in which there were a large number of red blood cells and inflammatory cells infiltration. In addition, proliferation, degeneration, and necrosis of epithelial cells, the increase of goblet cells, and intestinal villi bifurcation were also observed (Fig. 6).
Similar to the gross pathological alterations, the histopathological changes of the channel catfish intestine were related to the concentration and time of infection. And the most severe lesion occurred on the 6th day. Compared with the control group, the score of the enteritis group was significantly higher than that of the control group on the 3rd, 6th, 9th, 12th, and 15th days (P<0.05). On the 3rd day, the pathological score of the high-dose group was much higher than the middle and low-dose groups (P<0.01). On the 6th day of infection, there was a significant difference in pathological score between the high-dose and low-dose groups (P<0.05). After 9 days, there was no significant difference in pathological scores among enteritis groups (P>0.05). Overall, the pathological scores of each enteritis group showed a trend of increasing and decreasing with the time of infection (Fig. 5B). These results were related to enteritis, such as lamina propria hyperemia, inflammatory cell infiltration, cell degeneration, and necrosis.

Total pathological score of Channel catfish
According to the general pathological and histological pathological scores of channel catfish, the total intestinal score in the challenge group was positively correlated with the infection dose and negatively correlated with the infection time (Fig. 7B). Compared with the control group, the total intestinal score of the challenge groups were significantly increased. The total intestinal score in the high-dose infection group was significantly higher than that in the other infection groups on the 3rd day (P < 0.001) and significantly higher than in the low-dose group on the 6th and 9th day (P < 0.05). Still, the other groups had no significant difference (Fig. 7B).

Discussion
The intestinal tract is an essential mucosal immune organ and the first line of defense against the invasion of pathogenic microorganisms.21,22 On the one hand, the physical barrier of the intestinal tract prevents the invasion of pathogens and toxic and harmful substances in the environment. On the other hand, the intestinal mucosa contains many goblet cells, lymphocytes, and macrophages, which play an essential role in the immune response.23,24 Therefore, intestinal health plays a vital role in maintaining immune homeostasis. Studies have shown that intestinal injury in fish was easy to induce intestinal production of various cytokines and inflammatory mediators, which destroy the intestinal barrier structure and threaten health. Pathological evaluation of intestinal health was the most common and intuitive method, widely used in poultry, livestock, and other breeding. The research on the evaluation methods and standards of intestinal health in aquatic animals was insufficient, so it was of great significance to establish a pathological evaluation standard to evaluate the intestinal health of fish.
The gross pathological and histopathological scores were used to evaluate the enteritis infection comprehensively. In fish, such as grass carp and zebrafish, the Disease Activity Index (DAI) score was used to reflect the symptoms of enteritis, which can be used to guide treatment, observe the curative effect and judge the prognosis clinically.25,26 In this study, the gross pathological evaluation index mainly included the color change of pelvic fins and abdominal skin, anus redness, swelling, and whether there was fecal or mucus excreted by compression, intestinal color, intestinal wall transparency, and intestinal mucosal damage and shedding of intestinal mucosa in response to changes induced by A. hydrophlia in largemouth bass or channel catfish. The previous study used the ISI method to convert histopathological changes into numerical values in avian intestinal tissues to evaluate the severity of enteritis, but there was a lack of research on intestinal evaluation in fish.18,19 On this basis, this study was improved and divided according to the fish’s intestinal structure, and each structure’s unique pathological changes were measured and scored.
In this study, the symptoms of A. hydrophlia infection were observed in largemouth bass and channel catfish such as reddening of the ventral skin, redness and swelling of the anus, hyperemia of the intestine, thinning of the intestinal wall, and fluid retention in the intestine. These symptoms were consistent with typical symptoms of bacterial enteritis in fish.27,28 And it was observed that the gross pathological change score of the enteritis groups was significantly higher than that of the control group. This difference was related to the time and concentration of infection, and it can be gradually recovered with the prolongation of infection time.
In histopathological assessment, inflammatory lesions of the intestine were mainly concentrated in the lamina propria and mucosal epithelium, while there were almost no lesions in the muscular layer and submucosa. In the early stage of enteritis, the lamina propria was mainly characterized by inflammatory cell infiltration and hyperemia, and the thickness increased. At the same time, the mucosal epithelium mainly showed cell degeneration and necrosis, an increased number of goblet cells, and bifurcation of intestinal villi. Therefore, it was observed that the histopathological score of the largemouth bass enteritis groups was significantly higher than that of the control group on the 2nd day, and the histopathological score of the channel catfish enteritis groups was also significantly higher than that of the control group on the 3rd day. As the inflammation persists, these lesions worsen. Correspondingly, this study observed that the histopathological score of largemouth bass increased gradually in the first nine days. This upward trend was mainly due to the continuous increase of inflammatory cell infiltration and hyperemia in the lamina propria, as well as the proliferation of mucosal epithelial cells, the increase of bifurcation of intestinal villi, and the decrease of the proportion of degeneration and necrosis. And the peak score of the channel catfish enteritis groups was observed on the 6th day, mainly due to lamina propria hyperemia, inflammatory cell infiltration, and the continuous increase in goblet cells. Subsequently, in the later stages of infection, the inflammation was gradually relieved, and the lesions in the intestinal tissue gradually returned to normal.
Inflammatory cells are one of the crucial components of the immune system and play an essential role in dealing with infection.29,30 By observing intestinal pathological sections of Largemouth bass and Channel catfish, we found that with the development of inflammation, the number of inflammatory cells continued to increase in the early stage of infection (2-6 days) and decreased slowly in the later stage (9-15days). It indicates that the infiltration of inflammatory cells occurred in the early stage of inflammation and gradually recovered in the later stage of inflammation. Inflammatory hyperemia was mainly seen in the early stage of local inflammatory reaction due to inflammatory factors making the vasodilation nerve excited, resulting in red blood cells entering the tissues.31 Lamina propria is a layer of loose connective tissue prone to inflammatory cell infiltration and hyperemia when enteritis occurs, increasing its thickness.32 This study also found that the proportion of inflammatory cell infiltration and hyperemia in the lamina propria was the highest in the pre-inflammatory score. In addition to these lesions, the number of goblet cells was also associated with the period of inflammation. This study found that the number of goblet cells continued to increase in the early and middle stages of enteritis (2-9 days), and decreased slowly in the later stage (12-15 days). Goblet cells are a kind of mucous secretory cells distributed between mucous columnar epithelial cells and play an essential role in the innate immune defense system in the intestinal tract.33,34 Goblet cells were arranged between intestinal epithelial cells, which can promote the clearance of intestinal contents, thus providing the first line of defense against intestinal pathogens.35 Interestingly, we also found that the proportion of intestinal villi bifurcation to total villi in the enteritis group was higher than in the control group when we observed the intestinal tissue sections under the microscope. The cause of this phenomenon may be a compensatory division of the intestinal villi due to bacterial invasion, which increases the absorption area of intestinal villi and slows down the effects of absorption function brought about by inflammation. In addition, the cell morphology will also change with the development of inflammation. In the early stage of inflammation, the degeneration of cells in tissue leads to changes in morphology, structure and function. This change was generally reversible. Once this degeneration continues to develop, necrosis was occurring in severe cases.36 Necrosis was generally irreversible, mainly characterized by nuclear condensation, rupture, and dissolution. In the later stage of inflammation, the cells were mainly proliferated, which may be a compensatory proliferation to meet physiological needs and enhance or compensate for local metabolism.37 The cells were mainly denatured and necrotic in the early stage (2-6 days) and proliferated in the later stage (9-15 days).
Ethical Approval
The Animal Care and Use Committee of Sichuan Agricultural University reviewed and approved the animal study.
Competing interest
The authors declare that they have no competing interests.
Funding
This work was supported by a foundation project of the Sichuan Science and Technology Department (grant number 2021YFN0123) and a project from Chengdu Science and Technology (2021YF0501672SN).
Availability of data and materials
This published article and its supplementary information files include all data generated or analyzed during this study.
Author contributions
Conceptualization: Shuanghui Huang (Equal), Ping Ouyang (Equal). Methodology: Shuanghui Huang (Equal), Wenyan Wei (Equal), Jianing Wu (Equal), Ping Ouyang (Equal). Investigation: Shuanghui Huang (Equal), Wenyan Wei (Equal), Jianing Wu (Equal). Visualization: Shuanghui Huang (Equal). Data curation: Shuanghui Huang (Equal). Writing – original draft: Shuanghui Huang (Equal), Defang Chen (Equal), Lizi Yin (Equal), Xiaoli Huang (Equal). Formal Analysis: Yi Geng (Equal), Weiming Lai (Equal). Writing – review & editing: Hongrui Guo (Equal), Jing Fang (Equal), Huidan Deng (Equal), Zhengli Chen (Equal), Ping Ouyang (Equal).