Introduction
For many decades, Pacific white shrimp (Litopenaeus vannamei Boone 1981) have been extensively farmed globally because they have high nutrition values and are well adapted to intensive farming systems.1 This shrimp accounted for nearly 51.7% of global crustacean production in 2020,2 denoting its important role in the food section. The demand for shrimp products worldwide has increased daily, while land and water resources have become limited due to human activities and climate change. These are the driving forces behind the rapid development of shrimp farming technology, with a trend toward intensification with high stocking densities, the use of rich protein feed, and few water exchanges.3 Such farming technologies generated large amounts of organic and inorganic contaminants, such as ammonium, phosphorus, dissolved organic carbon, organic matter, etc., leading to high risks to cultured animal health and human safety.4,5
Biofloc technology (BFT) uses microbes to manage nutrient levels in production systems. It is considered a sustainable aquaculture solution because it is highly effective in cost, product quality, and environmental protection.5 The technology exploits the microbial community in the water column to assimilate nitrogenous and phosphorus waste, converting these products into microbial biomass. BF particles (BFs) are formed from microbial chains, e.g., protozoa, bacteria, fungi, and microalgae, and they attach to debris and organic particles.6,7 The microbial chains use excretory products from cultured animals for multiplying biomasses, thereby removing toxic substances from the water through algae uptake, autotrophic assimilation of bacteria, and nitrification of Lactic acid bacteria (LAB).6,8 BFs are ideal natural feed sources in situ and available all day for cultured animals because they contain high nutritional components, e.g., 25–50% protein, 0.5–15% fat,9,10 3–61% ash,11 15% fiber, and 18–35% total carbohydrates12; and numerous bioactive compounds, such as carotenoids, chlorophylls, phytosterols, bromophenols, amino sugars, vitamins, and minerals. Besides, microbial derivatives in BFs, such as 1,3-glucan, poly-hydroxybutyrate (PHB), lipopolysaccharides, and peptidoglycans, act as immunostimulators for cultured animals.13 In addition, free amino acids, including alanine, arginine, glycine, and glutamate, are known attractants in the shrimp diet; they are present in BFs with similar contents in the shrimp commercial diet.14,15 Thus, BFT application could improve the overall welfare indicators of aquaculture systems, such as decreasing feed costs, maintaining good water quality, controlling pathogens, and finally achieving high performance in culture.8,16,17
BFT has been applied to the culture of different shrimp species. They are mentioned as Penaeus monodon,18 Litopenaeus setiferus,19 Farfantepenaeus paulensis,20 Fenneropenaeus chinensis,21 F. duorarum,22 and L. vannamei.23 It is known that using different carbon sources has various effects on microorganism composition, nutritional contents in BF, and the growth and survival of cultured animals.9,22 Success in BF applications critically depends on effectively controlling the C/N ratio from the organic carbohydrate sources and feed supplied to the systems. The C/N ratio of 15:1 is considered optimal for BF L. vannamei culturing systems.24 Many sources of carbohydrates have been singly used in BF shrimp culture systems, like bagasse, cassava, corn, glucose, maize starch, molasses, rice bran, rice flour, sorghum meal, starch, sugar dextrose, sugarcane molasses, tapioca flour, wheat, wheat bran, wheat flour, etc.1,24–28; among them, rice flour and molasses have been commonly used as effective carbohydrate sources for BF systems because of their availability, low cost, and several biochemical characteristics.26,29,30 Molasses, with its simple structure, is considered a stimulus for LAB development.30–32 Meanwhile, rice flour, with its abundance of linked glucose chains and high purity, is a suitable substrate for BF systems.29 However, documents on the combined use of different carbon sources for BF culture systems being rare, e.g., Serra et al.,27 Zhao et al.,33 Tao et al.,34 and Chakrapani et al.24 The current work aims to determine the effects of the different combination ratios of rice flour and molasses on the growth and survival of Pacific white shrimp in order to gain more knowledge about the potential uses of these carbohydrate sources in BF aquaculture systems.
Materials and Methods
Experimental materials
Pacific white shrimp postlarvae (mean weight of 0.095±0.012 g) were purchased from a local shrimp hatchery. Rice flour (AAA brand) contained carbohydrate and nitrogen contents of 73.43 and 0.26%, respectively, and was purchased from the SADEC market in Dong Thap province, Vietnam. The rice flour was stirred with water at a ratio of 1 rice flour to 3 water, then heated (40–60 oC) for 60 minutes and incubated for 48 hours.35 The molasses contained carbohydrate and nitrogen contents of 46.7 and 0.95%, respectively, and were purchased from the CASUCO sugar factory in Phung Hiep District, Can Tho City, Vietnam. The molasses was also mixed with water at a 3:1 ratio and incubated for 24 hours.30 Lotus shrimp feed (commercial pellet) with a protein content of 40%, a product of CP manufacturers in Vietnam, was used during the experiment. The water used was mixed using saline water (salinity of 80‰) and tap water to reach a salinity of 15‰. Then, the mixed water was treated with chlorine at 30 mg L−1 and continuously aerated for 72 hours before being used for the experiment.
Experimental design
This study was conducted at the hatchery of the Faculty of Applied Biology at Tay Do University, Can Tho City, Vietnam. A 63-day experiment with a completely randomized design in three replications and applied the BF culturing system to compare the effects of different combination ratios of rice flour (R) and molasses (M) on the growth performance and survival of the postlarvae Pacific white shrimp (L. vannamei). Five treatments applied BF, including R90-M10, R70-M30, R50-M50, R30-M70, and R10-M90, formed with the addition of different combination ratios of rice flour and molasses, including 90% R+10% M, 70% R+30% M, 50% R+50% M, 30% R+70% M, and 10% R+90% M, respectively, with C/N ratios of 15:1, and one control (no BF) was randomly arranged into the 18 plastic tanks of 1.0 m3 (with 0.5 m3 of water in each tank and salinity of 15‰) placed indoors. The postlarvae were stocked into the tanks at a density of 150 ind. m−3 and fed pelleted feed (40% protein) to apparent satiation four times every day (i.e., 6:00, 10:00, 14:00, and 18:00) using feeding trays. The daily feed intake for the shrimp was adjusted according to Wyk et al.36 All tanks were managed without water exchange during the rearing. The C/N ratio (15:1) was maintained based on the added carbon source and the feed carbohydrate/protein (nitrogen) used for shrimp culturing.6,16,24,33 The rice flour and molasses were provided to the tanks every three days, two hours after feeding, based on the formula by Avnimelech16 and Megahed.6
Data collection and calculation
Water quality was checked at the beginning and during the period of the experiment. The temperature and pH were tested twice a day (at 7:00 and 14:00) using a pH meter. Alkalinity was checked every seven days using the Sera test kit. Total suspended solids (TSS), volatile suspended solids (VSS), total ammonia nitrogen (TAN), nitrite (NO2-), and nitrate (NO3-) were sampled weekly per tank, stored at 4 °C, and analyzed using the method described by APHA.37
Plankton and bacteria were checked weekly. The quantitative and qualitative determinations of phytoplankton were done according to the method described by Shirota,38 Karlson et al.,39 Patten et al.,40 and Ut & Oanh,41 and the quantitative and qualitative determinations of zooplankton were followed by Shirota,38 Conway,42 Al-Yamani et al.,43 and Ut & Oanh.41 Meanwhile, the densities of bacteria were determined using the method of Manan et al.44
BF volume (FV) was measured every week using an Inhoff conical tube and calculated based on the formula by Avnimelech.7 One liter of the sample water was settled in 20 minutes, and the sediment volume at the bottom was measured (unit: mL L−1). The mean floc length (MFL) and mean floc width (MFW) were measured weekly using a microscope at 40x magnification.
At the end of the experiment, 30 shrimps per tank were randomly collected to determine growth performance. Wet weight was individually measured using a digital scale accurate to 0.01 g. All shrimp were counted and weighed to determine the survival rate and final biomass. The shrimp performance parameters, including final mean weight (FMW), weight gain (WG), daily weight gain (DWG), specific growth rate (SGR), food conversion ratio (FCR), survival rate (SR), and final biomass (FB), were calculated using the following equations:
-
FMW (g) = total final weight of 30 individuals/30
-
WG (g) = final weight – initial weight
-
DWG (g day−1) = final weight − initial weight/culturing days
-
SGR (% day−1) = [(Ln final weight) − (Ln initial weight)]/culturing days × 100
-
FCR = consumed feed (g)∕weight gain (g)
-
SR (%) = (final number/initial number) × 100
-
FB (kg m−3) = total weight/culture volume
Statistical analysis
The variance homogeneity was assessed using Levene’s test, and the percentage data were transformed to arcsine prior to conducting statistics. All data were analyzed by one-way analysis of variance (ANOVA) followed by the Duncan test to identify significant differences between mean values at p < 0.05. Statistical analyses were conducted using the Statistical Package for the Social Sciences (SPSS) software for Windows version 20.0.
Results
Water quality parameters
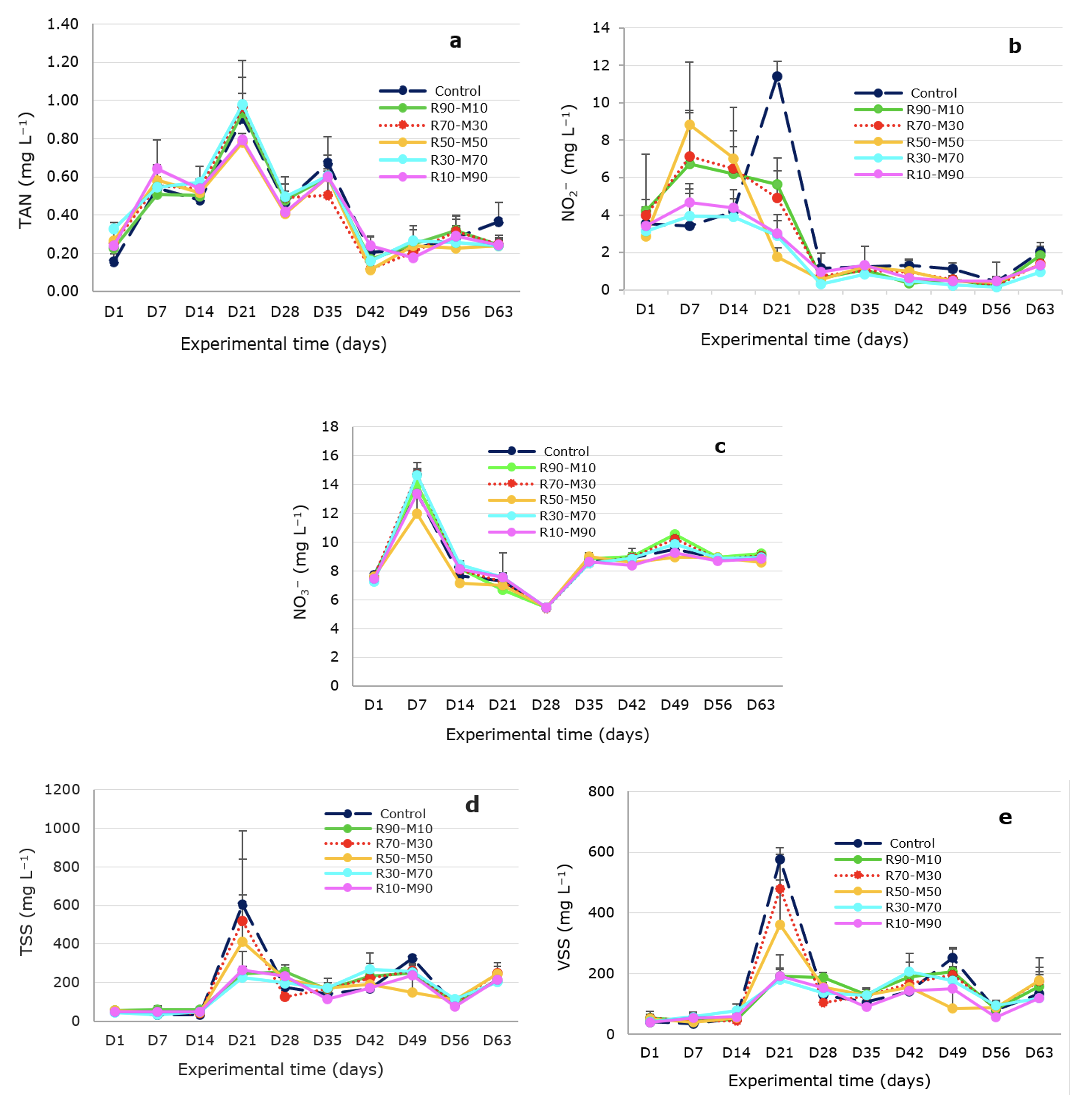
The water quality parameters are presented in Table 1. The temperature ranged from 27.2 to 27.4°C in the morning and from 28.7 to 29.1°C in the afternoon. The pH ranges were 7.37–7.50 (morning) and 7.20–7.63 (afternoon). Besides, parameters of Alkalinity, DO, TAN, NO3−, NO2−, TSS, and VSS varied in the ranges of 108–119 mg L−1, 9.25–10.3 mg L−1, 0.40–0.44 mg L−1, 8.32–8.85 mg L−1, 1.69–2.98 mg L−1, 146.0–183.0 mg L−1, and 106.0–155 mg L−1, respectively. There were no significant differences among the means of most of the water quality parameters (p > 0.05), except for NO2−, with the highest level (2.98 mg L−1) at the control and significantly differing from that at the treatments (p < 0.05) (Table 1). Although the mean values of TSS and VSS did not have significant differences among the treatments and the control (p > 0.05), both were highest in the control (Table 1).
The variation tendency of the nitrogen compounds over the monitoring period was observed (Figure 1). Figures 1a, 1b, and 1c show that during the initial experimental period, the nitrogenous compounds (TAN, NO2−, and NO3−) exhibited a tendency to sharp increases and high variations. They peaked on day 14 for NO3− (Figures 1c) and on day 21 for TAN and NO2− (Figures 1a and 1b), then all were reduced and stabilized during the late experimental period. Besides, the nitrite in the treatments rapidly increased and peaked on day 7, then gradually decreased to day 28 and stabilized until the experimental end. At the same time, the nitrite in the control gradually increased and peaked at day 21, then sharply decreased to day 28 and tended to stabilize during the late period of the experiment. Furthermore, the mean NO2− contents in the control always tended to be higher than those in the treatments from the 14th day to the end of the experiment (Figure 1b). Remarkably, the mean NO2− levels in the treatments were all lower than those in the control, with the lowest NO2− level at R70–M30 and significantly different compared to the control (Table 1).

Bacterial density parameters
There was no significant difference in total bacterial densities among the treatments and the control in both water and BF (p > 0.05), with the fluctuation ranging from 1.59 to 2.07 106 CFU mL−1 in the water and from 2.50 to 3.37 106 CFU mL−1 in BF. Besides, the LAB densities ranged from 0.09 to 0.15 103 CFU mL−1 in the water and 0.17 to 0.72 103 CFU mL−1 in BF. Meanwhile, the Vibrio bacteria densities varied from 3.21 to 4.41 103 CFU mL−1 in the water and from 47.0 to 66.9 103 CFU mL−1 in BF (Table 2).
The LAB densities in both water and BF tended to be higher in the treatments than in the control, with a significant difference observed in BF (p < 0.05) except for the R30-M70. In BF, the highest LAB densities were in the treatments R70-M30 and R50-M50. Besides, the Vibrio bacteria densities both in the water and in BF tended to be higher in the treatments than the control, except for the R70-M30 in the water, where the Vibrio bacteria density was lower than the control (Table 2).
Plankton parameters
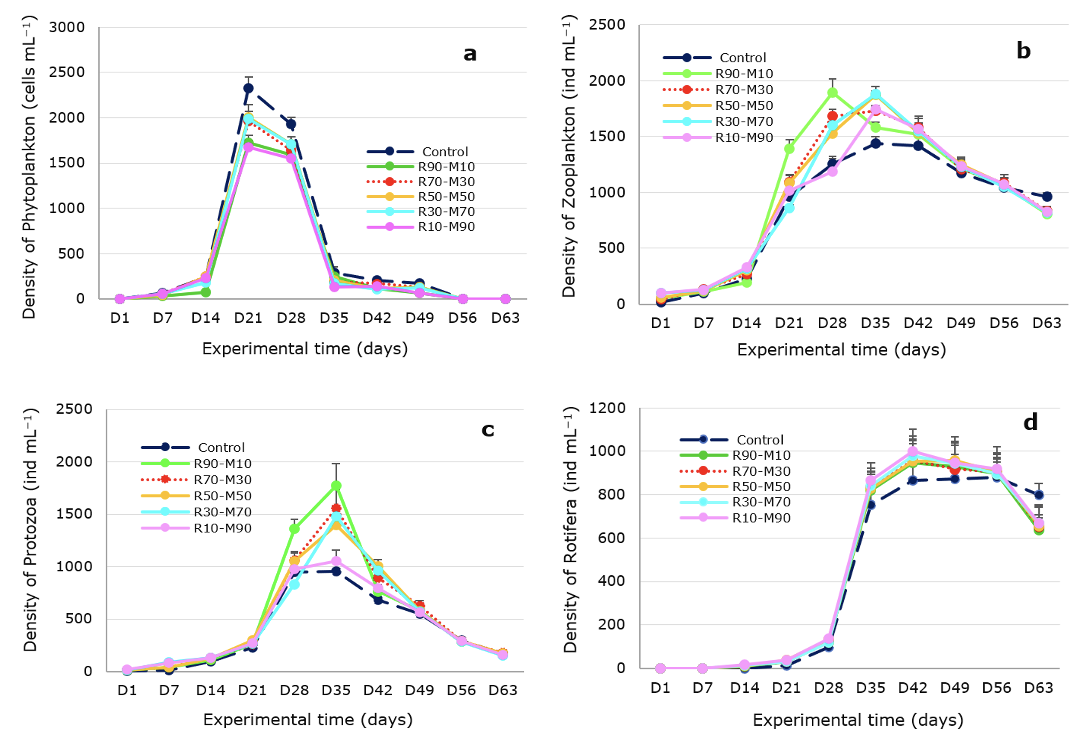
The highest phytoplankton density (523 cells mL−1) was observed in the control and significantly higher than that in the treatments (p < 0.05). There were no significant differences in phytoplankton densities observed among the R70-M30, R50-M50, and R30-M70 (with values of 440, 444, and 434 cells mL−1, respectively) (p > 0.05), and all of them were significantly higher than those in the R90-M10 and R10-M90 (with values of 385 and 386 cells mL−1, respectively) (p < 0.05). Besides, there were no significant differences in phytoplankton densities between the R90-M10 and R10-M90 observed (Table 3). During the experiment, the observed algae species belonged to 4 groups, including cyanobacteria with the highest density (183–9273 cells mL−1), followed by diatoms (168–220 cells mL−1), chlorophytes (17–28 cells mL−1), and dinoflagellates, which were only found in control, with a very low density (3 cells mL−1) (Table 3a).
In contrast to phytoplankton, the lowest density of zooplankton in the control (842 ind mL−1) was significantly lower than in the treatments. Among the treatments, the highest zooplankton density was in the R10-M90 (974 ind mL−1) and significantly higher than in the R10-M90 (904 ind mL−1). Still, there was no significant difference from that in the R70-M30, R50-M50, and R30-M70 (948, 948, and 938 ind mL−1, respectively) (Table 3). The zooplankton groups observed included protozoa, with the highest density (394–535 ind mL−1), followed by Rotifera (428–459 ind mL−1), and Eelworm, which was only found in the treatment with ratios of molasses > 50%, with a very low density (42–131 ind mL−1) (Table 3a). In addition, the high protozoa densities in the initial period of the experiment, with a peak on day 35, clearly decreased from day 35 to the experimental end (Figure 2c). Meanwhile, the low rotifera densities in the initial experimental period remarkably increased and peaked on day 28 and were maintained at high levels during the late period of the experiment (Figure 2d).

Biofloc (BF) parameters
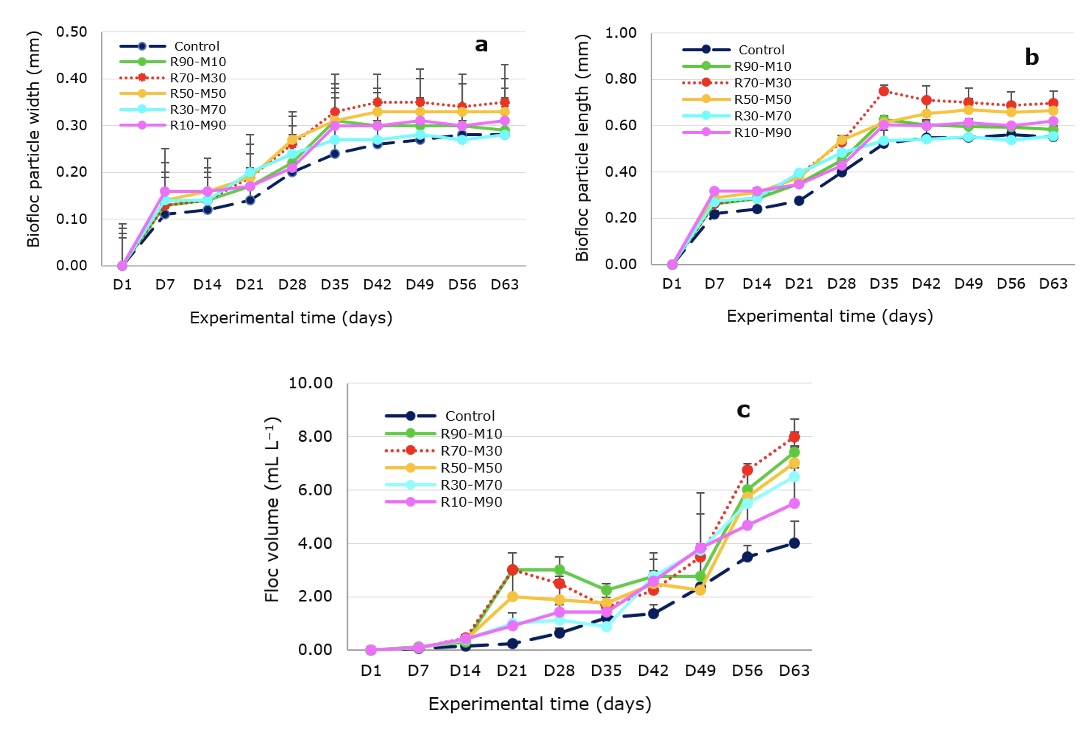
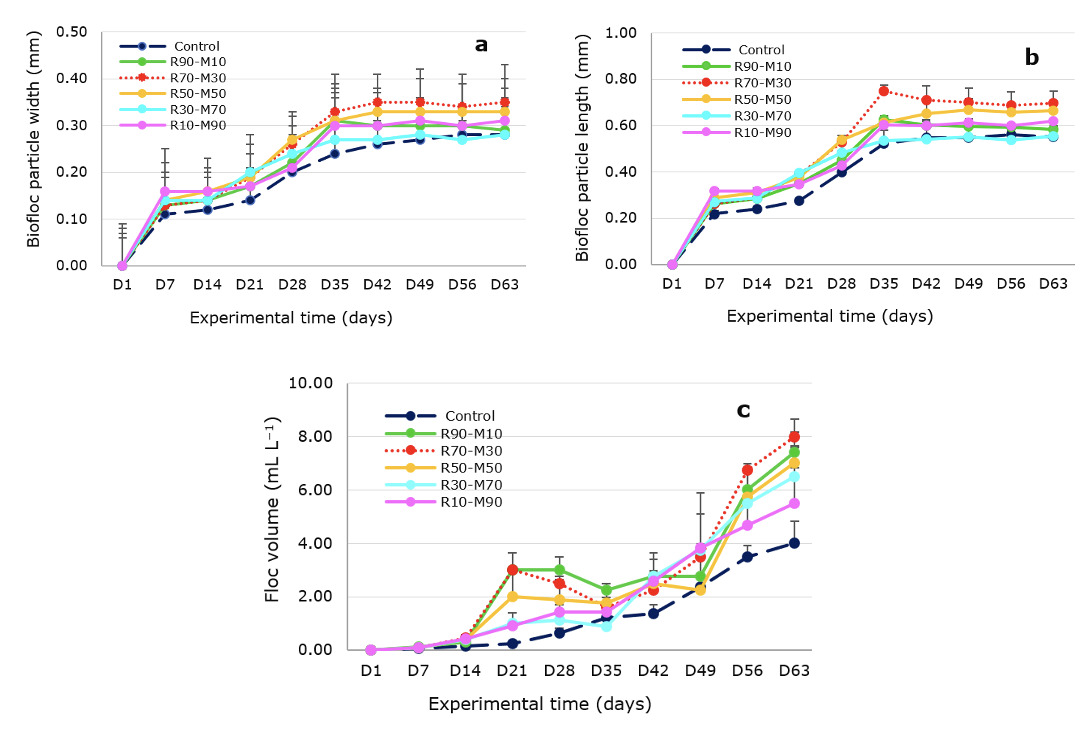
All BF parameters,i.e. dimension, FV, MFL, and MF, tended to grow with the experimental time (Figures 3a, 3b, and 3c). The means of MFW, MFL, and MFV varied in the ranges of 0.21–0.27 mm, 0.43–0.56 mm, and 1.46–3.21 mL L−1, respectively. All reached their largest sizes in the R70-M30, with significant differences observed in MFV between the R70-M30 and the control, R10-M90; in MFL between the R70-M30 and the control and other treatments except for the R50-M50; and in MFW between the R70-M30 and the control (Table 4).
FMW, WG, DWG, and SGR were in the ranges of 9.8–10.2 g, 11.0–12.8 g, 0.17–0.20 g day−1, and 7.64–7.88% day−1, respectively. Among the treatments, all growth performance parameters showed very little fluctuation and tended to be higher than those in the control, with significant differences observed in parameters of WG, DWG, and SGR between the R90-M10 and the control. Meanwhile, the SR and FB fluctuated from 81.8 to 94.2% and 1241 to 1435 g m−3, respectively. Both SR and FB reached the highest values (94.2% and 1435 g m−3, respectively) in the R70-M30, with significant differences observed in SR between the R70-M30 and the R90-M10 and in FB between the R70-M30 and the control. Besides, the lowest FCR (1.28) was observed in the R70-M30 and significantly differed from that in the control and other treatments. There was no significant difference in FCR between the control, R90-M10, and R50-M50; all three were higher than those in R30-M70 and R10-M90.
Discussion
Water quality parameters
Water quality parameters play an important and fundamental role in the life cycle of aquatic organisms, including shrimp.45,46 Van Wyk & Scarpa47 suggested that the temperature ranges of 15–35 and 28–32°C were the tolerance and optimal ranges, respectively, for the health of L. vannamei shrimp, while the optimal pH range for the culture of marine shrimp is between 7.0 and 8.2.48 DO is considered a crucial factor for BF formation because it is related to organic matter decomposition by aerobic bacteria.31 The addition of carbohydrate sources to BF systems will increase the oxygen demand of bacteria.7 Adding carbohydrate sources to BF systems will increase the oxygen demand of bacteria.7 BF systems may require DO concentrations of up to 6 mg L−1 h−1.49 An alkalinity of about 100–150 mg L−1 has been suggested for maintaining optimum water pH and alkalinity,50,51 while concentrations of TAN should also be kept at < 1.5 mg L−1 in shrimp BF systems.52 The safe NO2− levels for juvenile L. vannamei were estimated to be 6.1 mg L−1 at a salinity of 15‰.53 The safe concentration of TSS for the health and performance of shrimp in the BF shrimp culturing system is below 500 mg L−1.12,54 The concentrations of TSS and VSS observed (Table 1) are within their ranges found by Poersch et al.55 Overall, the variations in water quality parameters in the current study (Table 1) were within a suitable range for the culture of L. vannamei in the BF curing system.
Performance of nitrogen compounds
Ammonia is highly toxic for most aquatic organisms; therefore, its control in aquaculture systems is very important.56 There are three main processes that contribute to the control of ammonia in BF systems: the uptake of algae, the assimilation of autotrophic bacteria, and the nitrification of LABs.8 The trend in variations in nitrogenous compounds (TAN, NO2−, and NO3−) presented in Figures 1a, 1b, and 1c showed the role of the biota (microbiota and cultured animals) in adjusting ammonia contents in the late period of the experiment, as proven by the fact that during the initial experimental period when the microbiota (mainly algae and bacteria) in tanks had perhaps not yet developed stability, all three (TAN, NO2−, and NO3−) showed a tendency to sharp increase and high variation. Still, they reduced and stabilized all during the late experimental period. Previous authors found that following feeding, oxygen consumption and ammonia excretion by fish significantly increased, creating high fluctuations in ammonia concentration daily.57 However, following the addition of organic carbon to the system of tilapia culture, the ammonia, nitrite, and nitrate levels did not show significant diurnal fluctuations.58
Besides, the variable tendency of nitrite in the treatments and the control (Figure 1b) and the mean nitrite levels in the treatments were all lower than those in the control, with the lowest nitrite level at R70–M30 and significantly different as compared to the control (Table 1). These showed that the control’s transformation of ammonia into nitrate was slower, less stable, and less effective than in all the treatments. The findings were probably related to the role of LAB. It is known that LABs directly control nitrification processes.59,60 Meanwhile, the highest LAB densities in water and in BF were observed at the treatments R70–M30 and R50–M50 (Table 2).
The choice of organic carbon source and organic loading rate also influence the performance of the BF system. Molasses has a fast dissolution rate, providing high levels of organic carbon as a substrate for LABs to metabolize ammonia. Therefore, molasses can effectively control the TAN and nitrite levels in the BF systems.27,28 However, Samocha et al.28 it was reported that the shrimp performance of L. vannamei in the nursery and grow-out phases did not show significant effects at different levels of molasses. Besides, Vilani et al.1 used two carbon sources, rice bran (RB) and molasses (MO), at two fertilization doses (25 and 100 mg L−1 of total suspended solids) in the BF L. vannamei culturing system. RB had a 22% higher yield and a 15% lower feed conversion rate than MO. At the same time, no significant differences were observed in the water quality parameters among the treatments, except for orthophosphate at the end of culturing. In another study by Chakrapani et al.,24 complex carbon sources (tapioca flour, rice bran, wheat flour, and rice flour) were used in the BF culturing system for Penaeus vannamei. An effective reduction (62–67%) in TAN and improvement in shrimp performance when using rice flour and wheat flour compared to the control (no BF), while beneficial bacteria isolated from all treatments and controls were the same. The mentioned studies showed that i) The role of molasses in promoting the development of beneficial bacteria and controlling the conversion of ammonia was at specific doses, as increasing molasses doses would not increase the efficiency of beneficial bacteria or water quality. ii) Molasses has little role in the performance of farmed shrimp, even when increasing its additional doses.1,28 iii) Complex carbon sources like rice bran,1 rice flour and wheat flour24 showed good potential for conversing with shrimp performance but did not play a visible role in promoting the development of beneficial bacteria. In our results, the R70-M30 and R50-M50 treatments perhaps provided the best rice flour and molasses doses to develop LAB. The LAB effectively absorbed inorganic nitrogen, leading to a faster reduction of TAN than nitrification.61 These resulted in a significant reduction in nitrite concentration in the treatment R70-M30. In addition, in a similar trend to previous findings by Vilani et al.1 and Chakrapani et al.,24 there was no significant improvement in nitrite concentrations (Table 1) and densities of LAB (Table 2) in the treatments with increases in the molasses percentage greater or equal to 50% and 70%, respectively. The variations in nitrogenous compounds during the experiment proved that the different ratios of rice flour and molasses prevented the accumulation of ammonia and nitrite in the culturing system, where the ratios of 70% rice flour and 30% molasses achieved the best nitrite removal efficiency.
Performance of bacteria
LAB in BF improves water quality (Asaduzzaman et al., 2008) and controls pathogenic bacteria.62 The genus Vibrio bacteria is known as a common pathogen in shrimp. Its antagonist was LAB.63 LAB inhibits pathogenic bacteria by producing antibacterial compounds such as lactic acid, acetic acid, bacteriocins, bacteriocin-like factors, and hydrogen peroxide,64 competing for space and nutrients (Anand et al., 2013; Santhana et al.65). In the present study, the densities of LAB in the BF at the treatments were significantly higher than those in the control (p < 0.05), except for R30–M70. Also, the densities of LAB in the water at the treatments obtained higher values than those in the control, though the difference was insignificant (Table 2). It proved the role of adding rice flour and molasses ratios in improving beneficial bacterial densities in the treatments. These findings agree with the results of a previous study by Anand et al.,66 which detected an increase in total LAS densities when organic carbohydrates and artificial substrates were added to tanks. And as discussed above, the R70-M30 and R50-M50 probably obtained the best contents of rice flour and molasses for the conversion to LABs, so LAB densities were highest in these treatments. Thanks to added carbohydrates, the densities of Vibrio bacteria in water and in BFs at the treatments also tended to be higher than those at the control, except for the density of Vibrio bacteria in water in R70-M30 (Table 2).
Furthermore, the lowest density of Vibrio bacteria observed in R70-M30 and the highest density of LAB in R70-M30 and R50-M50 (Table 2) showed that the development of LAB has perhaps limited the growth of Vibrio bacteria, resulting in the lowest Vibrio bacteria density in treatments R70-M30.62 In the present study, the number of vibrios in BF was 10–15 times higher than in water. However, this value did not exceed 103 CFU mL−1 if the total density of vibrios was calculated it in 1.0 mL of water (including BF), implying that the density of vibrios was negligible to cause damage to cultured shrimp.67
Performance of plankton
Four groups of algae detected in the current study (Table 3a) had been reported in BF shrimp culture systems.68,69 Among them, diatoms70,71 and chlorophytes14,72 are effective nutritional sources for shrimp. Furthermore, phytoplankton density at the control was significantly higher than at the treatments (p < 0.05, Table 3); this may have resulted in a slightly higher TSS concentration in the control as compared to the treatments (Table 1), which agreed with Tinh et al.,73 who also found that chlorophyll content (indicated by algae density) was highest in the treatment without added corn starch during the sampling period. It may be explained that the control was not added to the carbohydrate sources (rice flour and molasses), so high water clarity allowed light to penetrate the water and facilitated algae development quickly.74 Figure 2a shows a reduction in phytoplankton densities from day 21 to day 56. This was expected because adding carbon sources to the culture tanks promoted the dominance of bacteria over microalgae.14 This was expected because the addition of carbon sources to the culture tanks promoted the dominance of bacteria over microalgae.14 This variation in phytoplankton densities can also explain the decrease in TSS and VSS from day 21 to day 28 and their stability until the end of the experiment. Besides, the predominance of cyanobacteria (presented in Table 3a) agrees with previous studies.20,22 It was thought cyanobacteria are mixotrophic organisms that can take advantage of different environmental conditions by changing their trophic mode. In low-light conditions, they can adopt the heterotrophy mode for development.75,76
The zooplankton densities in the treatments were all higher than those in the control during the experimental period (Figure 2b). Besides, the means of zooplankton densities in the treatments were significantly higher than those in the control (Table 3). These showed a remarkable improvement in the natural feed amount for the shrimp in BF tanks, with the best improvement observed in the treatments with a molasses rate of 10–70% (Table 3). In addition, the high protozoa densities were in the initial period, and they decreased during the mid-to-end of the experiment (Figure 2c). Meanwhile, low rotifera densities in the initial period remarkably increased, then maintained high levels during the late-half period of the experiment (Figure 2d). These indicated an effective conversion of organic matter into inorganic nutrients in the culturing system. It is known that protozoa favor organic material-rich environments,77 while rotifera favor inorganic nutrient-rich environments.78
Performance of biofloc (BF)
The increase in the size of BF (MFW, MFL, and MFV) throughout the experiment (Figures 3a, 3b, and 3c) is consistent with the results by Huang et al. (2002) and Zhao et al.33 Interestingly, MFW, MFL, and MFV in the treatments were all higher than those in control throughout the experimental period. The means of all three parameters in the R70–M30 were significantly higher than those in the control (Table 4). The differences were consistent with a report by Zhao et al.,33 Duy & Khanh,30 and Huang et al.,25 who mentioned that adding carbohydrates promoted a change in floc size. Yet, we also observed that the TSS and VSS concentrations tended to increase as the molasses percents increased. In contrast, the size parameters of BF tended to reduce in treatments with molasses percents greater than or equal to 50%. It is shown that the addition of the two carbohydrate sources into the BF system at ratios of molasses equal to or above 50% only resulted in increases in the suspended solid concentrations without promoting the formation of BFs.
Performance of shrimp
All the treatments in the current study applied a C/N ratio of 15:1, which has been recommended for the BF culturing systems of L. vannamei.23,79 The SR of 87.12–94.23% in treatments was lower than that with the addition of molasses (SR of 93.7–99.0%)79–81 but higher than that with the addition of rice flour (SR of 83–89%).80 Also, the SGR range of 7.67–7.88% day−1 was within the SGR range found with the addition of molasses (2.49–11.20% day−1).82 but higher than the SGR found with the addition of rice flour (2.78–6.40% day−1).24
Table 5 shows an improvement in growth parameters (FMW, WG, DWG, and SGR) at the treatments compared to the control. Besides, treatments with molasses ratios of more than or equal to 30% tended to improve SR, FCR, and FB. Especially the highest SR (94.2%) was obtained at the R70-M30, which perhaps created the highest FB (1435 g m−3) at this treatment. The lowest FCR (1.28) was also observed in the R70-M30 and significantly differed from that in the control and other treatments. The best performance of the shrimp observed at the M70-30 may be supported by favorable conditions, such as a low nitrite level (Table 1), inhibiting the thriving of Vibrio bacteria, stimulating the development of LABs (Table 2), and especially promoting the formation of BFs (as evaluated by good indicators such as MFW, MFL, and MFV) (Table 4). Besides, water quality parameters (temperature, pH, alkalinity, DO, TAN, NO3−, NO2−) were within the ranges recommended for Pacific white shrimp health during the experimental period (Table 1). Our findings indicated the benefits of shrimp culture using the BF system if the combination of rice flour and molasses were applied, of which a ratio of 70% rice flour and 30% molasses was considered the best.
Conclusion
The findings indicated improved growth (FMW, WG, DWG, and SGR) with the treatments. Besides, treatments with a more than or equal to 30% molasses percentage improved SR, FCR, and FB. Especially the highest SR (94.2%) was obtained at the R70-M30, which perhaps created the highest FB (1435 g m−3) in this treatment. The lowest FCR (1.28) was also observed in the R70-M30 and significantly differed from that in the control and other treatments. Further, water quality parameters were within the ranges recommended for Pacific white shrimp health during the experimental period. Our study showed the benefits of shrimp culture using the BF system when a mixture of rice flour and molasses was applied, of which a ratio of 70% rice flour and 30% molasses was considered as the best. Combining the available and low-cost single and complex carbohydrate sources needs further study to exploit local material sources in aquaculture development efficiently applied BFT.
Authors’ Contribution - CRediT
Conceptualization: Ta Van Phuong, Nguyen Van Hoa; Methodology: Ta Van Phuong, Nguyen Van Hoa; Formal analysis and investigation: Ta Van Phuong, Doan Xuan Diep, Van-Thanh Vo; Writing - original draft preparation: Ta Van Phuong, Doan Xuan Diep, Van-Thanh Vo; Writing - review and editing: Ma Bich Nhu, Nguyen Van Hoa.