_and_gadeokdo_(gd)__south_kore.tiff)


Introduction
The Pacific oyster, Crassostrea gigas (Magallana gigas), is a seasonal delicacy beloved all over the world and has become one of the globally important aquaculture species.1 It is also reputable for its high nutritional quality and health benefits; therefore, it has been dubbed “Milk of Sea” (USDA 2018). Since the new suspended culture techniques with longlines and rafts had been employed in Korea in the 1960s, the nationwide yearly production of C. Gigas dramatically increased and came to the point where it exceeded 300,000 metric tons, making the country the second-largest producer in the world as of 2019.2,3 During which Korea’s oyster industry also faced a significant reduction in natural seed production occurred by the climatic change and the country’s rapid industrialization throughout the time.4 Subsequently, many seeds got imported from other countries, such as Japan and the United States, to replenish the drastic shortage of seeds, and afterwards they blended into the wild populations.4,5 In 2007, the 10,900 tons of crude oil released from the tanker MV Hebei Spirit, covered 375km of the shoreline of the western coast of Korea.6 The toxicity of the oil wiped out most oysters at more than 90% of the oyster farms in that region, triggering the displacement of the natural spats by the ones from southern areas.7 In consequence, this accident and the climatic and anthropogenic interference further depleted the wild stock on the West Coast and predictably impacted the diversity.
Mitochondrial DNA (mtDNA) analysis is one of the commonly adopted approaches to examine divergences in animals by its small size, maternal and non-recombining mode of inheritance, rapid evolution, extensive intraspecific polymorphisms, etc.8 Among mtDNA markers, cytochrome oxidase c subunit I (mtCOI) is an eminently conserved protein-encoding gene in the mitochondrial genome.9 The effectiveness of mtCOI analysis in studying genetic diversity and genetic structure of marine mollusk populations has been charted in blood cockle, estuarine clam, and hard clam.10–12 In Korea, although a few studies have examined the genetic diversity of C. gigas using molecular-based methods,13,14 our understanding of the current genetic structure and diversity is still insufficient, given the above chronologically deteriorating circumstances and the economic value of this species.
As a preliminary work for full-on research on the populations throughout the Korean peninsula, the present study investigated the mtCOI gene to understand better the genetic variation and population structure of C. gigas from Tongyeong and Gadeokdo in the southern coast, where about 80% of the cultivated oysters in Korea are produced.15,16
Materials and Methods
Sample collection
Forty oysters each were obtained from aquaculture farms in Tongyeong (TY, 34°52’38.4"N 128°14’40.8"E) and Gadeokdo (GD, 35°04’19.0"N 128°50’28.6"E) with ten collected at each site in October 2020 and January, April, and July 2021 (Figure 1). They were immediately transferred on ice to the Laboratory of Physiology, Pukyong National University, Busan, Korea. Their fresh mantle edges were dissected and stored in 100% ethanol at room temperature until DNA isolation.
_and_gadeokdo_(gd)__south_kore.tiff)
DNA extraction
The excised samples were incubated with 600 µL of TNES-urea buffer (10 mM Tris- HCl, pH 8.0; 125 mM NaCl; 10 mM EDTA, pH 8.0; 0.5% SDS; 6 M urea) and 10 µL proteinase K (20 μg/mL) at 60°C for at least 12 h, and total genomic DNA (gDNA) was extracted using the phenol/chloroform method.17 The extracted gDNA was dried at room temperature, resuspended in TE buffer (10mM Tris-HCl; 1 mM EDTA, pH 8.0), and stored at −20°C for later use. Its quantity and quality were checked using a spectrophotometer (DS-11; DeNovix, DE, Wilmington, USA).
Primer design
To design a pair of primers for polymerase chain reaction (PCR), we retrieved mtCOI sequences from GenBank (https://www.ncbi.nlm.nih.gov/)) and aligned them using ClustalW in BioEdit 7.2.18 After comparing the aligned nucleotide matrix, conserved regions of the Magallana sequences were selected as forward and reverse primers. Their melting temperatures and secondary structures were checked with the web service Sequence Manipulation Suite19 before oligonucleotide synthesis.
PCR amplification and sequencing
PCR was conducted in a 20-μL reaction using AccuPower® PCR PreMix (Bioneer, Daejeon, South Korea) with 0.2 μM of the forward [CRA- MT-18171f (5’-TTTCGCACTGGGCAGGTAT-3’)] and reverse [CRA-MT-1865r (5’-ATTTCGCACTGGGCAGGTAT-3’)] primers and 1 μL of gDNA template (20 ng/μL). The DNA was amplified using the ProFlex PCR System (Thermo Fisher Scientific, Waltham, MA, USA) at 95°C for 5 min, followed by 35 cycles at 95°C for 30 s, 55°C for 30 s, and 72°C for 2 min, with a 5-min final extension at 72°C. The PCR product was electrophoresed in 1.5% agarose gel stained with ChamelGreen™ I (SFC Probes, South Korea) followed by gel purification with an AccuPrep® PCR Purification Kit (Bioneer, Daejeon, South Korea). The purified DNA was subsequently sequenced at Macrogen (Seoul, South Korea).
Data analysis
The raw sequence data were imported to Sequencher v. 5.4.5 (Gene Codes, Ann Arbor, MI, USA) to check the base manually calls on the chromatograms. Using the Clustal W function in BioEdit 7.2.5, we aligned all sequences with the default parameters. After the manual correction of obvious misalignments, a nucleotide sequence matrix of 863-bp mtCOI fragments from the 80 C. gigas specimens from TY and GD was generated. DnaSP v. 628 was employed to estimate the total number of haplotypes (H) and haplotype distribution among populations. The haplotype diversity (h), nucleotide diversity (π), and mean number of pairwise differences (k) were calculated using ARLEQUIN v. 3.5.29
A parsimony network was generated and plotted with TCS analysis30 using PopART v. 1.731 to evaluate the genealogical relationship of all C. gigas haplotypes. The network was constructed from 80 sequences from the TY and GD populations, alongside 117 sequences from various countries, which had been examined in the previously published studies (Table 1).
The genetic structure of the C. gigas populations from the TY and GD was assessed by analysis of molecular variance (AMOVA) on ARLEQUIN v. 3.5. The fixation index (FST) value ranges from 0 (no differentiation between subpopulations) to 1 (complete differentiation of populations).32 The significance of each pairwise comparison was tested with 10,000 random replicates.
Results
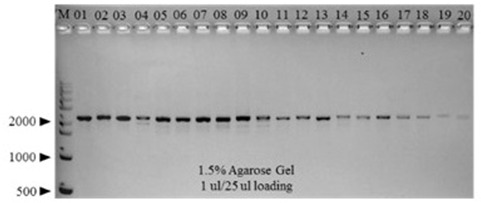
Amplification of mtCOI gene from a chronological set of C. gigas
Eighty C. gigas samples collected from aquaculture farms in Tongyeong (TY) and Gadeokdo (GD) over the 4 consecutive seasons (i.e., 10 TY and 10 GD samples per season) were used for this study. Initially, the mtCOI gene of each individual was amplified by PCR. All samples generated a single 2000-bp amplicon, indicating the presence of an intact mtCOI gene in each individual (Figure 2). Subsequent sequencing confirmed that all of the amplicons are mtCOI-specific (data not shown).
Genetic diversity
To characterize the genetic diversity of C. gigas populations from TY and GD, multiple sequence analysis was performed using an 863-bp nucleotide sequence of the mtCOI from the 80 samples. This analysis identified 27 different single nucleotide polymorphism (SNP) sites in total, consisting of 21 transitions (a/g, c/t) and 4 transversions (t/g), with no indels being detected. The translated amino acid sequences of the mtCOI fragments from the 80 C. gigas were 100% identical, indicating that the sequence variation of C. gigas mtCOI is predominantly due to synonymous substitutions (data not shown).
Based on the SNP profiles, a total of 22 haplotypes were determined: 13 in TY and 9 in GD (Table 2), which indicates that the genetic diversity is slightly greater in TY (h=0.5154) than GD (h=0.4397) during the study period (Table 2)". Haplotype 1 (HAP_1) was the most abundant haplotype shared by 58 samples (28 in TY and 30 in GD), accounting for 72.5% of the total sample size. Other 20 haplotypes differed from HAP_1 by 1-3 nucleotides. As expected, TY and GD populations displayed low nucleotide diversity (0.000927 and 0.000689, respectively), with TY slightly more diverse (Table 2). Consistently, the haplotype diversity of TY was higher than that of GD. The mean number of pairwise differences (k) measuring the genetic diversity within a population was higher in TY than in GD (Table 2). Overall, TY and GD populations shared a similar genetic profile characterized by low genetic diversity with the predominant HAP_1 and diverse minor haplotypes.
Population genetic structure
AMOVA analysis was conducted to characterize the genetic structure of the 2 C. gigas populations. As shown in Table 3, most of the total molecular variance was present within populations (99.81%) rather than between the two populations. Accordingly, the fixation index (FST), a measure of population differentiation due to genetic structure, was 0.00188 but was not statistically significant (p-value = 0.49853).
Characterization of haplotypes
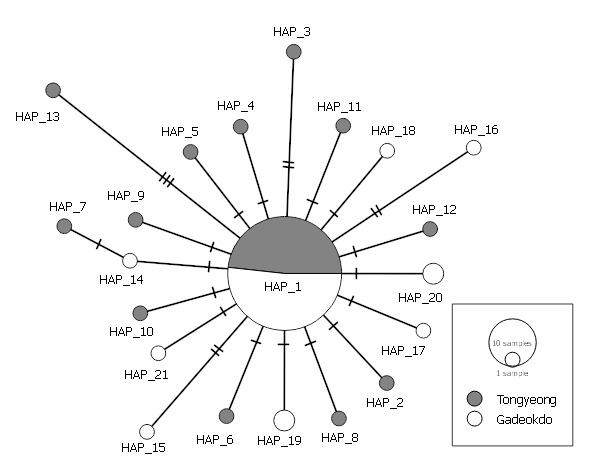
To further delineate the genetic relationship of the two C. gigas populations, a haplotype network was constructed using the 863-bp mtCOI alignment matrix. As shown in Figure 3, HAP_1 formed a core of the network with other 20 satellite haplotypes. Except for HAP_19 and HAP_20, all satellite haplotypes were shown to be a singleton with a distinct SNP profile. All satellite haplotypes differ from HAP_1 by 1-3 nucleotides, resulting in the characteristic ‘star-like’ network pattern.
Next, 117 mtCOI sequences of 8 different country origins and two Korean origins (Incheon and Sucheon) were retrieved from the NCBI GenBank and included in the haplotype network analysis (Table 1). Li et al.20 previously characterized 46 HAPs in the C. gigas population with 12 geographical origins in the northwestern Pacific. Selected mtCOI sequences representing 37 haplotypes, including HAP_1 (KP099007), out of the 46 HAPs were included in this analysis (see Table 1). Similar to Figure 3, the haploid network consisted of the dominant HAP_1 and the satellite HAPs. While a majority of satellite haplotypes was a singleton, 11 satellite haplotypes shared by different geographical origins were identified (Figure 4). Despite the geographical proximity, only 3 haplotypes (i.e., HAP_3, HAP_11, and HAP_14) were shared by Chinese and Korean C. gigas populations. No significant relationship was observed between the Korean origins (TY, GD, Incheon, and Sucheon).
Discussion
A total of 21 haplotypes were identified in the two populations (TY and GD, hereafter) based on nucleotide sites within the mtCOI gene. The subsequent genealogical analysis showed that these haplotypes form a characteristic shallow network consisting of the major haplotype (i.e., Hap_1) at the center and 20 minor satellite haplotypes diverging from HAP_1 (Figure 3).
Genetic differences between the two populations were shown to lie in their distinctive satellite haplotypes; TY had 12 satellite haplotypes while GD had 8, but none of the satellite haplotypes were shared between the two. Each satellite haplotype differed from HAP_1 by 1-3 nucleotides and mostly formed a singleton, suggesting these satellite haplotypes have emerged recently. Previously, Li et al. reported a similar “star-like” network based on 228 mtCOI sequences of wild C. gigas collected from the coasts of China, Korea, and Japan.20 Furthermore, HAP_1 accounted for more than 70% of both wild and cultured populations, suggesting the population genetic structure of C. gigas is conserved between wild and hatchery populations. The sharing of HAP_1 at equally high frequencies among the geographically diverse populations indicates that HAP_1 likely represents the ancestral spat oyster from Japan that has become prevalent worldwide since the early 20th century.1 Weak genetic differentiation (FST = 0.00188) between TY and GD is, thus, more likely due to the history of monophyly and large-scale distribution associated with the current C. gigas industry, rather than distance-dependent genetic homogenization between the two populations.
C. gigas populations were further characterized by analyzing a haplotype network of 117 mtCO1 sequences from 12 different geographic origins (Figure 4). This extended network consisted of the predominant HAP_1 and 56 satellite haplotypes, most of which were singleton. Only 3 satellite haplotypes (i.e., HAP_3, HAP_11, and HAP_14) were shared between analyzed Chinese and Korean C. gigas populations. This data could imply that geographic proximity might not exert much influence on the genetic makeup of C. gigas populations, which needs further investigations on a larger scale.
The loss of genetic diversity reduces the fitness and adaptability of a species and the size of its population, possibly increasing the risk of species extinction. The rapid decline of C. gigas populations in recent years necessitates systemic management to improve the sustainability of C. gigas populations. In the present study, both C. gigas populations (Tongyeong and Gadeokdo), located on the southern coast of Korea, were shown to possess low levels of genetic diversity, which is in parallel with the extant Pacific oyster C. gigas populations.14,20

Acknowledgments
The Basic Science Research Program supported this research through the National Research Foundation of Korea (NRF), funded by the Ministry of Education (NRF- 2020R1F1A1074614).
Authors’ Contribution per CRediT
Methodology: Thanh T. Biet (Equal), Hong-Keun Park (Equal), Dongjin Park (Equal). Formal Analysis: Thanh T. Biet (Equal), Su-Jin Park (Equal). Writing – original draft: Thanh T. Biet (Equal), Hong-Keun Park (Equal). Writing – review & editing: Thanh T. Biet (Equal), Hong-Keun Park (Equal), Dongjin Park (Equal), Youn-Hee Choi (Equal). Investigation: Su-Jin Park (Equal). Resources: Su-Jin Park (Lead). Conceptualization: Youn-Hee Choi (Lead). Funding acquisition: Youn-Hee Choi (Lead). Supervision: Youn-Hee Choi (Equal).