
Introduction
The concept of ecosystem services links nature to human well-being, emphasizing the anthropocentric view of human beings in the natural environment. Therefore, scholars define it as the direct or indirect benefit that humans receive from the natural environment,1,2 which can influence people’s evaluation of self-well-being through the penetration of many aspects of life. For example, ecosystem services can meet human needs for food security,3 can meet people’s needs for income security,4 and can provide more meaningful practices,5,6 with safer and more functional living environments,7 in addition, can also promote the connection between people and nature and increase people’s closeness to nature.8
Freshwater is necessary for human survival, and the freshwater environment provides the most important ecosystem service for humans.9,10 With their high biodiversity and abundance, freshwater products are central to providing ecosystem services through protein supply, nutrient network control, nutrient cycle regulation, and recreational activities enrichment.11
The realization of the value of ecosystem services has obvious public goods and externalities,12,13 so it requires government intervention.14 The Chinese government has made a lot of efforts to realize the value of ecological services in order to better respond to current environmental and welfare problems. For example, the Chinese government has proposed an ecological civilization strategy that coexists in harmony with natural systems rather than trying to dominate nature, in order to mitigate ecological degradation and maintain ecosystem services.15 China’s 13th Five-Year Plan (2016-2020) focuses on coordinating prominent ecological and environmental issues, providing residents with high-quality ecological products, with the core goal of optimizing environmental quality. In April 2021, the General Office of the CPC Central Committee and the General Office of the State Council issued ‘the Opinions on Establishing and Improving the Value Realization Mechanism for Ecological Products’, calling for efforts to build a policy and institutional system for transforming clean water and green mountains into gold and silver mountains, and promoting the formation of a new model of ecological civilization construction with Chinese characteristics.
Agricultural intensification transforms natural habitats into single agricultural planting or farming areas, and due to the use of large amounts of agrochemicals, local biomes disrupt,16,17 the abundance and richness of beneficial arthropods reduced,18 becoming the main reason for biodiversity loss and decline in ecosystem services.19–22 The marketization of freshwater ecosystem services value requires a shift from agricultural intensification to ‘ecological intensification’.23–25 This process is inseparable from the support of the government and the operation of producers, as well as the recognition of the value of freshwater ecosystem services by consumers.
Based on existing theories, this paper decomposes freshwater ecosystem services in multiple dimensions. From the perspective of consumers’ willingness to pay for ecosystem services, using the survey data of 821 consumers in six cities in eastern, central and western China, the influence of various dimensions of freshwater ecosystem services on consumers’ willingness is explored by structural equation model. At the same time, to ensure the accuracy of the model regression results, the individual characteristics of consumers are introduced to analyze the possibility of realization of freshwater ecosystem services value, to improve the willingness of producers to supply ecological products, ensure regional ecological security and green economy of freshwater resources. Compared with the existing studies, the main contributions of this paper are as follows: first, the dimensions of freshwater ecosystem services are decomposed, which has received less attention in existing related studies; Secondly, consumers are taken as the research object and analyzed from the perspective of their willingness to pay, so that the research conclusions are closer to the market rules.
Theoretical framework
From the perspective of consumers’ acceptance of ecological value, this paper decomposes freshwater ecosystem services in multiple dimensions. We apply the methodology of the UN Millennium Ecosystem Assessment,26 which provides a basic framework for evaluating the dimensions of ecosystem services and paves the way for further promoting consumer acceptance of the marketization of the value of ecosystem services into decision-making.27
1. Dimensions of Freshwater Ecosystem Services
Using the MEA framework, four dimensions of services have been utilized—provisional services, regulating services, cultural services, and supporting services. Provisional services mainly refer to direct and indirect contributions to human consumption; regulating services refer to the role in regulating the carbon cycle and ‘biological pump’ in the water environment28; cultural services refer to the transmission of local culture through traditions, customs and rituals; supporting services refer to the provision of nutrition to predators, indirect contribution to commercial fisheries and tourism.29
(1) Provisional services
Provisional services are the products obtained from ecosystems, such as food, wood, freshwater, and other products.2 They are a tangible contribution to human consumption, which can be divided into direct and indirect contributions.
The direct contribution of it is expressed in products and the environment as an integral part of provisional services via the most intuitive contribution to ecosystem functions. This has been reflected in many studies of scholars.30,31 For freshwater products, provisional services are manifested as the supply of ecological aquatic products and the provision of a healthy water environment.
In the long run, the indirect contribution of provisional services may be as a source of indirect use value,32–34 insurance value.35–37 For freshwater ecosystem service, the indirect contribution is manifested as the provision of germplasm resources.
(2) Regulating services
To determine regulating services provided by the freshwater ecosystem, the studies have been reviewed to distinguish their role in the carbon cycle and ‘biological pump’,28 mainly sequestering carbon from the atmosphere and exporting particulate organic matter.
Some studies have quantified the role of fish in a given ecosystem. For example, Fox and Bellwood38 measured fish-controlled algae biomass, and McIntyre et al.39 determined the nutrient quality recycled by fish. On the other hand, biomechanical features analysis also assessed the potential role of fish in ecosystems (e.g., Carroll et al.40). Carbon is a main component of fish tissues and prey items41 and critical to ecosystem function.42 Fish can modulate primary production through nutrient cascade and excretion, indirectly mediating CO2 fluxes at the air-water interface.43,44 Carbon is passed through the food webs. Fish alter the nutrient cycle in aquatic ecosystems through their impacts up and down the food webs.45,46 Fish regulate aquatic ecosystems by storing and releasing nutrients as consumers and prey for other organisms.11,39,47,48
In this paper, the regulatory role of the freshwater ecosystem is divided into controlling algal biomass, maintaining nutrient cycling in aquatic ecosystems, and regulating carbon emissions.
(3) Cultural services
Culture is central to all connections between humans and nature, and the analysis of cultural services complements the study of ecosystem service frameworks.28,49 The contents of fishery culture mainly include the origin and development history of fishery; fishing boats, fishing gear, fishing methods, breeding and processing techniques and methods in various historical periods; living habits and customs of fishermen in various places; information about fish and fishermen Stories and legends, literary works of art; fish-eating techniques and methods; derivatives of the combination of fishery and religion, etc. Theories about fishery cultural tourism originated from Hobsbawn and Ranger’s50 study on growing nostalgia. This nostalgia was born of a yearning for a simpler way of life, that is, to escape to the countryside and escape modernity.51
Cultural services are defined as improving leisure and entertainment services for residents, enhancing local fishery culture, and increasing local tourism revenue.
(4) Supporting services
Supporting services, although part of ecosystem services are difficult to measure separately and thus at a risk of being overlooked.52 This is because the value of other ecosystem services (provisioning, regulating and cultural services) is expressed more directly, and supporting services are generally captured in them.53 It is well known that aquatic products can act as ecosystem engineers, and the functional diversity of freshwater ecosystem communities can modulate ecosystem services54,55 and processes.56,57
To make the analysis more complete, we use three variables to measure the supporting services of the freshwater ecosystem: protection of biodiversity in the water environment,58 implementation of water conservation projects,59 and demonstration of healthy production models.
2. Perception of Individual Characteristics to Ecosystem Services
Different types of consumers have different perceptions of ecosystem services. Different user groups (e.g., men and women, high-income groups and low-income groups) perceive ecosystem services differently.60 When ecosystem services develop and change, the differences in personal well-being of different groups will lead to differences in their sensitivity to changes in ecosystem services.5,61
Age, gender, education, and income were selected in our analysis as control variables for individual characteristics.
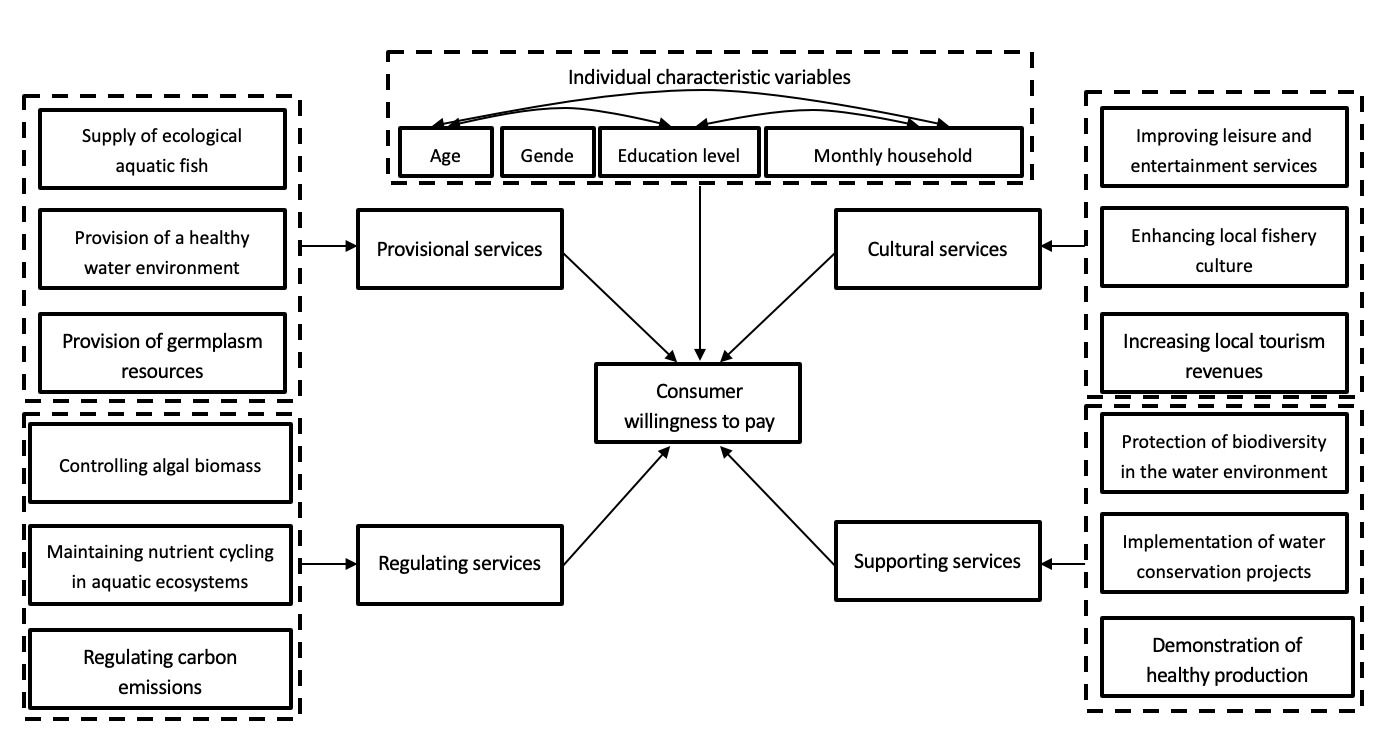
Figure 1 shows the theoretical framework of the factors affecting the marketization of freshwater ecosystem services value based on the MEA framework.
Data and methods
1. Data Source
A standardized questionnaire was used to collect data through an online survey system called ‘Wenjuanxing’ (www.wjx.com), issued from August to September 2022. The survey aims to analyze and explore the consumers’ acceptance of freshwater ecosystem services’ value through sample data recovery. 862 questionnaires were distributed, 821 valid questionnaires were recovered, and the effective rate was 95%. Consumers from six cities in China were selected in the research: Shijiazhuang, Wuxi, Hefei, Wuhan, Chengdu and Kunming.
Table 1 shows the individual characteristics of the interviewed consumers. The samples are mainly middle-aged consumers aged 26-35 and 36-45, accounting for 38.00% and 38.98% of the total sample, respectively. Male consumers accounted for 54.45% of the sample, which was not much different from the proportion of female consumers (45.55%). The years of education of the sample are mostly concentrated in 13-16 years (college or undergraduate education), accounting for 39.34% of the total sample, followed by 10-12 years (high school education), accounting for 33.01% of the total sample. The monthly household income is mostly concentrated in CNY3000-6000 (27.89%), CNY6001-10000 (22.78%) and CNY10001-15000 (22.41%).
2. Variable Settings
(1) Explained Variable
Based on the theoretical analysis, this paper defines consumers’ willingness to pay for freshwater ecosystem services as the explained variable. The question set in the questionnaire is: ‘Ecological freshwater products refer to the safe, harmless, nutritious, and healthy products that are produced following the requirements of aquatic products safety under the premise of protecting and improving the agricultural ecological environment, following the laws of ecology and ecological economics, and using the agricultural development model of intensive management. Are you willing to pay a higher price for them than normal?’ The answers are divided into unwilling to pay extra, willing to pay extra less than 1%, willing to pay extra 1%-3%, willing to pay extra 3%-6%, willing to pay extra 6%-10%, and willing to pay extra 10% or more, assigned values of 0, 1, 2, 3, 4, 5 and 6 respectively in the analysis (Table 2).
The proportion of consumers unwilling to pay extra accounts for 23.02%. Most consumers are willing to pay more for freshwater ecosystem services, but the proportion of extra payment is not high, concentrated at 1%-3%, accounting for 29.96% of the overall sample. Only 3.41% of consumers are willing to pay more than 10% for freshwater ecosystem services (Table 2).
(2) Explanatory Variable
This paper selects multiple dimensions of freshwater fish ecosystem services and individual characteristics as explanatory variables based on the existing studies. The multiple dimensions of freshwater ecosystem services include provisional, regulating, cultural, and supporting services, and consumer personal characteristics include age, gender, education, and income. The definitions of variables and their representative letters are shown in Table 3.
3. Model Selection
To assess the potential causality between the dimensions of ecosystem services on consumers’ willingness to pay, we constructed structural equation model (SEM). SEM explains the function of the entire system through the construction of a statistical framework by finding solutions that minimize the difference between the model’s predictions and observations, verifying the possible relationship between variables, and parameterizing the model.62,63
Based on the existing studies and practical experience, the model structure of this paper is established. The variables that ultimately affect consumers’ willingness to pay for ecosystem service include 4 latent variables of the ecosystem service system dimension (provisional services, regulating services, cultural services and supporting services), 12 observation variables of ecosystem services (each latent variable contains 3 observation variables), 4 observation variables of individual characteristics (age, gender, education level and monthly household income). The observation variables affect consumers’ willingness to pay by acting on latent variables, and individual characteristic variables directly act on consumers’ willingness to pay as observation variables. In addition, there is a correlation between age, education level, and household income. Therefore, the theoretical structure diagram was constructed, shown in Figure 1.
Results
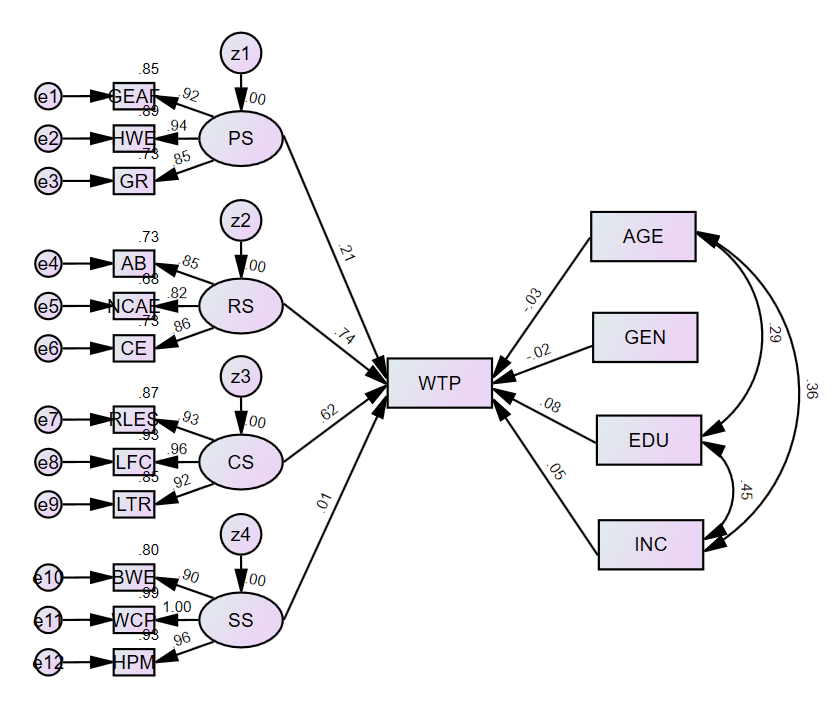
In this paper, the classical estimation approach of SEM—Maximum Likelihood is used to perform model operations. The model has obtained satisfactory results in AMOS26.0 (Chi-square =7.817, P=0.099). The results of the standardized estimate are shown in Figure 2.

It can be seen from Table 4 that all dimensions of ecosystem services (provisional services, regulating services, cultural services and supporting services) have a positive impact on consumers’ willingness to pay, and regulating services have the greatest impact (standardized coefficient = 0.745), followed by cultural services (standardization coefficient = 0.625), provisional services (standardization coefficient = 0.208), and the least impact is supporting services (standardization coefficient = 0.009). The impact of the first three dimensions is significant, and the impact of supporting services is not.
Among the variables of individual characteristics, gender, age, education level and income also have a significant impact on consumers’ willingness to pay. As education level (standardized coefficient = 0.080) and income (standardized coefficient = 0.050) increase, consumers’ willingness to pay for ecosystem services increases. The estimated coefficient for sex is negative, indicating that men are more willing to pay for ecosystem services than women. The estimated coefficient of age is also negative, which means consumers’ willingness to pay for ecosystem services decreases with age.
Discussion and Conclusions
Overall, our findings reveal the impact of ecosystem service dimensions and consumers’ individual characteristics on consumers’ willingness to pay.
1. Provisional services
The impact of provisional services on consumers’ willingness to pay for ecosystem services is a significant positive impact, but this impact only ranks third. According to existing research, the provisional services are the products obtained from ecosystems.2 Consumers should have a higher willingness to pay for the obvious role of ecosystem services, but the results of the study do not show such a high impact. With the online survey, there might exist knowledge gaps on the provisional services associated with product consumption, it could be improved when awareness improved.
Among the three observation variables of Provisional services, ‘Supply of ecological aquatic products’ has the greatest impact (standardized coefficient = 0.945), followed by ‘Provision of a healthy water environment’ (standardized coefficient = 0.924), and the least impact is ‘Provision of germplasm resources’ (standardized coefficient = 0.854). In the dimension of provisional services, consumers pay more attention to the provision of products and ecological environment. The impact of ecosystems on germplasm resources has not received sufficient attention (Table 5).
2. Regulating services
The impact of regulating services on consumers’ willingness to pay for ecosystem services is positive and significant. Compared with other dimensions, regulating services have the greatest impact on consumers, which means, consumers are willing to pay the greatest value for the regulating services function of ecosystem services, and what consumers value most is the regulating functions of ecosystems.
Among the three observation variables of regulating services, ‘regulating carbon emission’s has the greatest impact (standardized coefficient = 0.857), followed by ‘controlling algal biomass’ (standardized coefficient = 0.852), and the least impact is ‘maintaining nutrient cycling in aquatic ecosystems’ (standardized coefficient = 0.82 ). The concept of carbon peaking and carbon neutrality has formed a consensus in the minds of consumers. Consumers’ attention to the ecological environment has brought their willingness to pay for the ecological environment (Table 5).
3. Cultural services
Cultural services have a positive and significant impact on consumers’ willingness to pay for ecosystem services, second only to regulating services. That means, the cultural function of ecosystem services has been recognized by consumers.
Among the three observed variables of cultural services, ‘enhancing local fishery culture’ has the greatest impact (standardized coefficient = 0.962), followed by ‘improving leisure and entertainment services’ (standardized coefficient = 0.934), and the least impact is ‘increasing local tourism revenues’ (standardized coefficient = 0.92). The enhancement of local fishery culture and the improvement of leisure and entertainment services for residents are increasing consumers’ willingness to pay for ecosystem services (Table 5).
4. Supporting services
The impact of Supporting services on consumers’ willingness to pay for ecosystem services is positive, but not significant. It can be seen that the function of ecosystem in terms of supporting services has not attracted the attention of consumers, such as biodiversity and water conservation projects (Table 5).
In conclusion, according to the analysis of sample data, consumers already have a certain awareness of freshwater ecosystem services, but the proportion of consumers willing to pay extra for them is not high, indicating that this level of awareness needs to be improved. At the current level of consumer awareness, the realization of freshwater ecosystem services requires the selection of factors that have a greater impact on consumer intentions. SEM results show that individual characteristics have little effect on consumers’ willingness to pay. The regulating and cultural functions of freshwater ecosystem services are most likely to stimulate consumer willingness, especially freshwater ecosystem services’ role on regulating carbon emissions, controlling algal biomass, enhancing local fishery culture and improving leisure and leisure entertainment services. The government and relevant departments can publicize freshwater ecosystem services in these aspects, improve consumers’ awareness level and willingness to pay, so as to lay a better foundation for the realization of freshwater ecosystem services.
In addition, the division of observation variables in the freshwater ecosystem services dimension in this study may not be detailed enough. Further research can refine the indicators of each dimension observation variables, which is helpful to improve the research conclusions. In addition, consumers’ attitudes towards freshwater ecosystem services can also be set as latent variables which can be evaluated by observation variables to get a more comprehensive measurement of consumer attitudes.
Acknowledgments
This study was supported by the China Agriculture Research System of MOF and MARA (CARS-46), Philosophy and Social Science Research Project of Jiangsu Province Universities (2023SJYB0963), Social Science Foundation of Jiangsu Province (22GLB041) and Doctoral Research Project Funded by Wuxi Institute of Technology (BS202202).
Authors’ Contribution
Conceptualization: Yunyun Dai (Equal), Hong Yang (Equal). Formal Analysis: Yunyun Dai (Equal), Lin Yu (Equal), Yunbo Yu (Equal). Writing – original draft: Yunyun Dai (Equal), Zhen Zhou (Equal). Writing – review & editing: Yunyun Dai (Equal), Hong Yang (Equal). Funding acquisition: Yunyun Dai (Equal), Hong Yang (Equal). Supervision: Yunyun Dai (Equal), Hong Yang (Equal). Methodology: Zhen Zhou (Equal), Yunbo Yu (Equal). Investigation: Lin Yu (Equal), Yunbo Yu (Equal). Resources: Lin Yu (Equal), Yunbo Yu (Equal).