

Introduction
Regeneration is when organisms replace or restore lost or amputated body parts. The regeneration capacities are different in various organisms, based mainly on sex, age, and different development stages,1,2 and invertebrate species show overall superior regeneration ability compared to vertebrates.3 For example, starfish can regrow a new individual from a small body fragment,4 lizard can regenerate a new tail after its tail self-cut.5 Regeneration enables animals to recover well despite substantial injuries or autotomy. It is an important biological process for some animals to survive after injuries.
Regeneration involves a series of processes. The early stage is wound healing, which includes the process of the wound epidermis formation and recovery of body fluid. Then, the blastema is formed, that is a proliferative zone of cells consisting of mesenchymal progenitor cells. Finally, a redevelopment phase follows, when tissue grows again.6 Early stages of regeneration are critical for autotomy signal transduction and determine whether an amputated limb can regenerate successfully. There are many studies focused on the role of single molecules in the early stage of regeneration. In Xenopus laevis , Wnt-3a has played an role in blastema formation in the apical epithelium of regenerating limb buds.7 IGF-I is an important gene for controlling the regeneration of retinal ganglion cells during the early stage of regeneration in goldfish.8 Fgf is required to form blastema at the early stage of fin regeneration and then activate the regenerative cell proliferation in zebrafish.9 However, the molecular mechanism of animal regeneration during the early stage at transcriptome level is still incomplete.
Regeneration is a typical biological character in crustaceans; however, previous studies have mainly focused on the morphology of newly formed limbs and the effect of autotomy on regeneration phenotype in crustaceans. In Parhyale hawaiensis, the regenerated limb appears to be a perfect replica of the original limb before amputation.10 The size of the newly regenerated limb is the same as that of the normal limb after the second molt in Eriocheir sinensis.11 In Alpheus angulosus, the regenerated claw differs from mature claws in the first molt, while the most of differences disappeared in the second molt.12 No matter whether partial or full limb autotomy, it had no significant impact on the survival rate in Scylla serrata.2 However, the molecular mechanism of limb regeneration in crustaceans is still not fully understood currently.
Litopenaeus vannamei is widely distributed in the world and is also the most economically valuable cultured crustacean.13 During the breeding process of L. vannamei, regeneration occurs frequently. However, the severed limbs could grow into new limb buds and eventually form new limbs. In this study, a comparative transcriptomics study of limb regeneration of L. vannamei was carried out to identify potential genes associated with limb regeneration at the early stage (less than 24 hours). This study aimed to help us understand the underlying molecular mechanism of limb regeneration of L. vannamei at early stage.
Materials and methods
Experimental animals and sampling
All the male L. vannamei individuals (∼10g) in this study were collected from the Jinshan breeding station in Shanghai. First, they were acclimatized in the same tank for two days and then were physically stimulated on the second limb on the right side and autotomy took place at the coxa. Then, the limb bud tissues at the coxa from the wound site were sampled separately at 12 hours (12hpa) and 24 hours post autotomy (24hpa). The bases of coxae were collected from the second limb on the right side at 0-hour post autotomy (0hpa) for the control group. For each group, four individuals were sampled as biological replicates. Finally, the samples were immediately placed in liquid nitrogen and stored at −80°C in a refrigerator. In this study, no rare or protected species were used.
RNA extraction and RNA sequencing
Total RNA was extracted from the collected tissues of each individual by using RNAios plus (Takara, Dalian) according to the manufacturer’s instructions. RNA integrity and quantity were examined using agarose gel electrophoresis and an Agilent 2100 Bioanalyzer (Agilent, Shanghai, China). A total of 5 ug RNA with RNA integrity number (RIN) above 8.0 was used for RNA-seq library construction using the Illumina Truseq™ RNA sample Prep Kit (Illumina, USA). Then, indexed libraries were sequenced on Illumina Hiseq™4000, with 150 bp paired-end reads produced.
Identification of differentially expressed genes
The raw sequencing reads were first trimmed to remove low-quality reads using Trimmomatic software. Clean reads were mapped against the assembled L. vannamei genome (NCBI accession number: GCF_003789085.1) using hisat2-2.0 software. FPKM (fragments per kilobase per transcript per million mapped reads) value was calculated with the RSEM software for each individual to identify the expression levels. The differentially expressed genes (DEGs) were identified with a fold change > 2 and with statistical significance (p < 0.05) by DESeq2 software. Cluster analysis was conducted using the hierarchical cluster method based on the euclidean distance using the heatmap module in R.
Functional annotation
Functional annotation was performed by searching NR (NCBI nonredundant protein sequences), Swiss-Prot (A manually annotated and reviewed protein sequence database), GO (Gene Ontology), COG (Cluster of Orthologous Groups of proteins), and KEGG (Kyoto Encyclopedia of Genes and Genomes) databases using DIAMOND software.
Weighted correlation network analysis (WGCNA) analysis and GO analysis
Based on the differentially expressed genes, a WGCNA coexpression network was constructed. The weighted signed network was computed based on a fit to scale-free topology, with a threshold soft power of 6. A topological overlap dendrogram was used to define modules with a minimum module size of 30 genes and the deepSplit parameter set to 2. Module and trait associations were determined by calculating the correlation coefficient between module eigengene (ME) and traits (such as days after limb autotomy). GO enrichment analysis was conducted through Goatools software with p < 0.05. KEGG enrichment analysis were conducted on the DEGs by DAVID functional annotation tools 6.8. The p-values were adjusted using Fisher exact test. And the categories with adjusted p-value < 0.05 were considered enriched.
Results
Analysis of sequencing quality
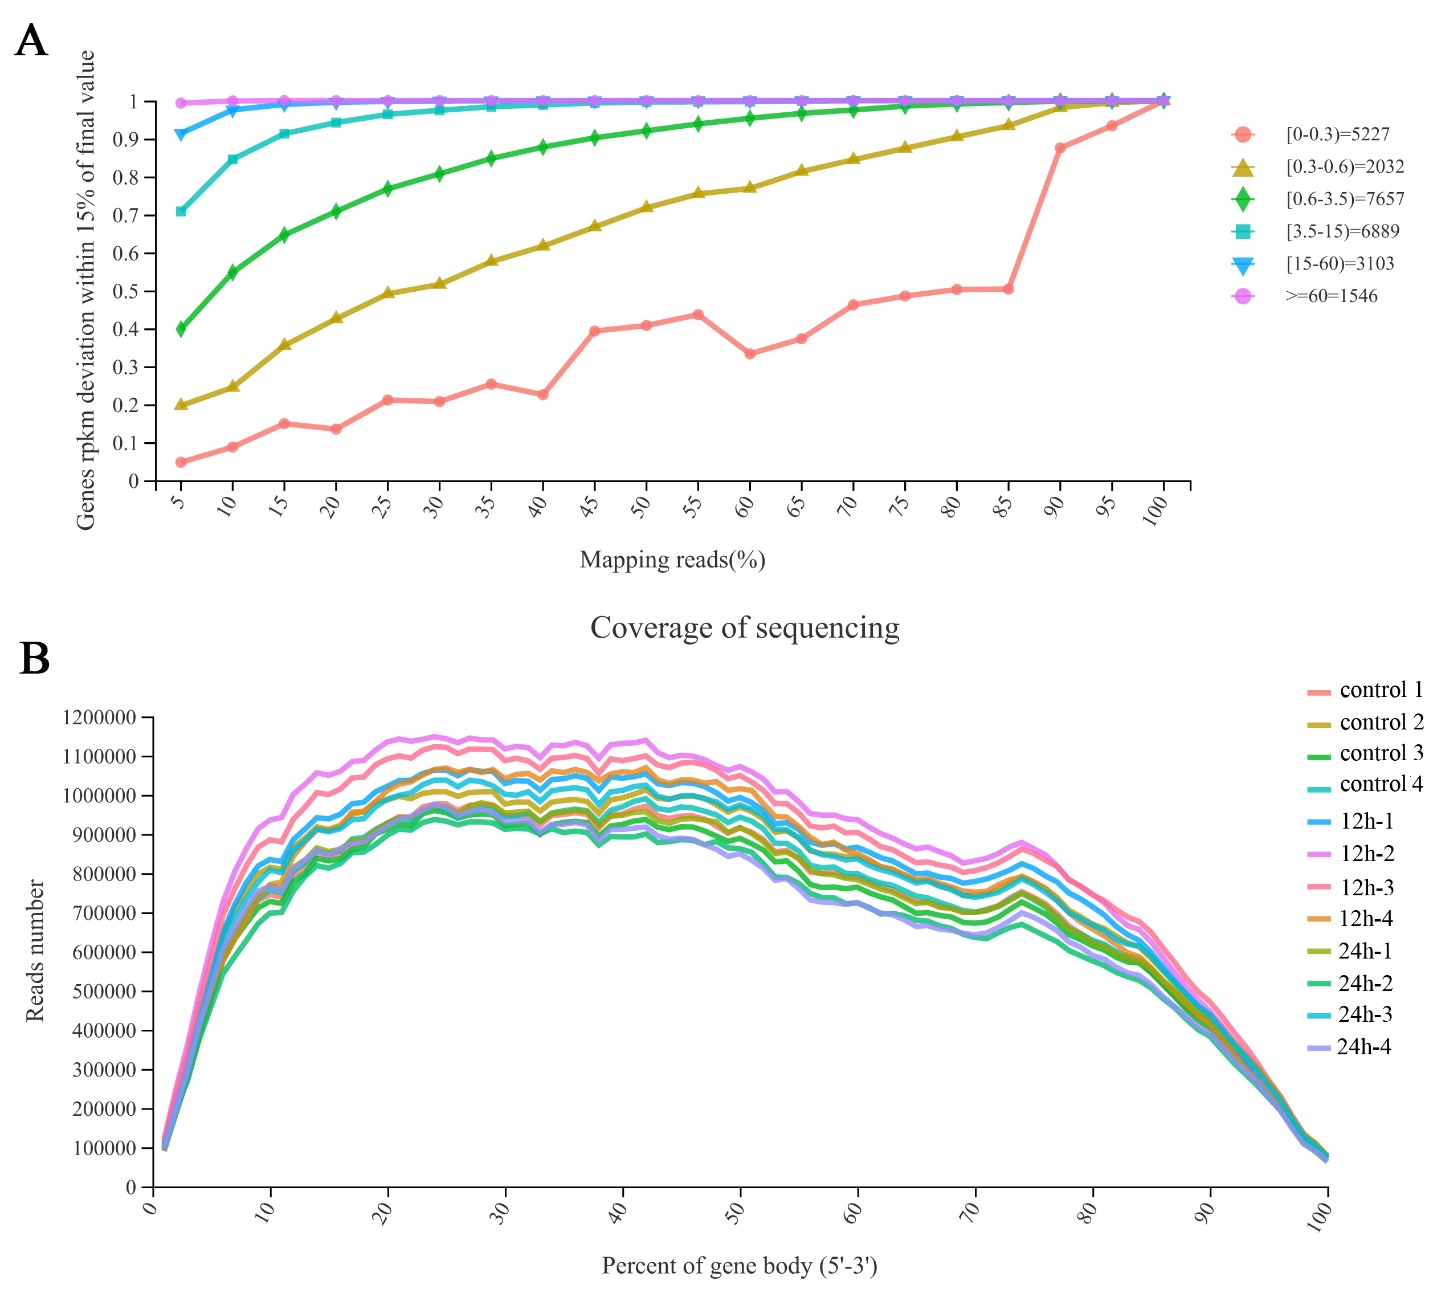
Most of the genes with a quantitative value of more than 3.5 are close to saturation when the rate of map sequencing reads is 40% (Figure 1A). This means that the overall quality of saturation is high, and the sequencing amount of transcriptome can cover most of the expressed genes in this study. The curve in Figure 1B reflects that the sequence obtained by sequencing is evenly distributed on the gene, and the sequencing is not biased. The results prove that our transcriptome data are available.

Differentially expressed genes
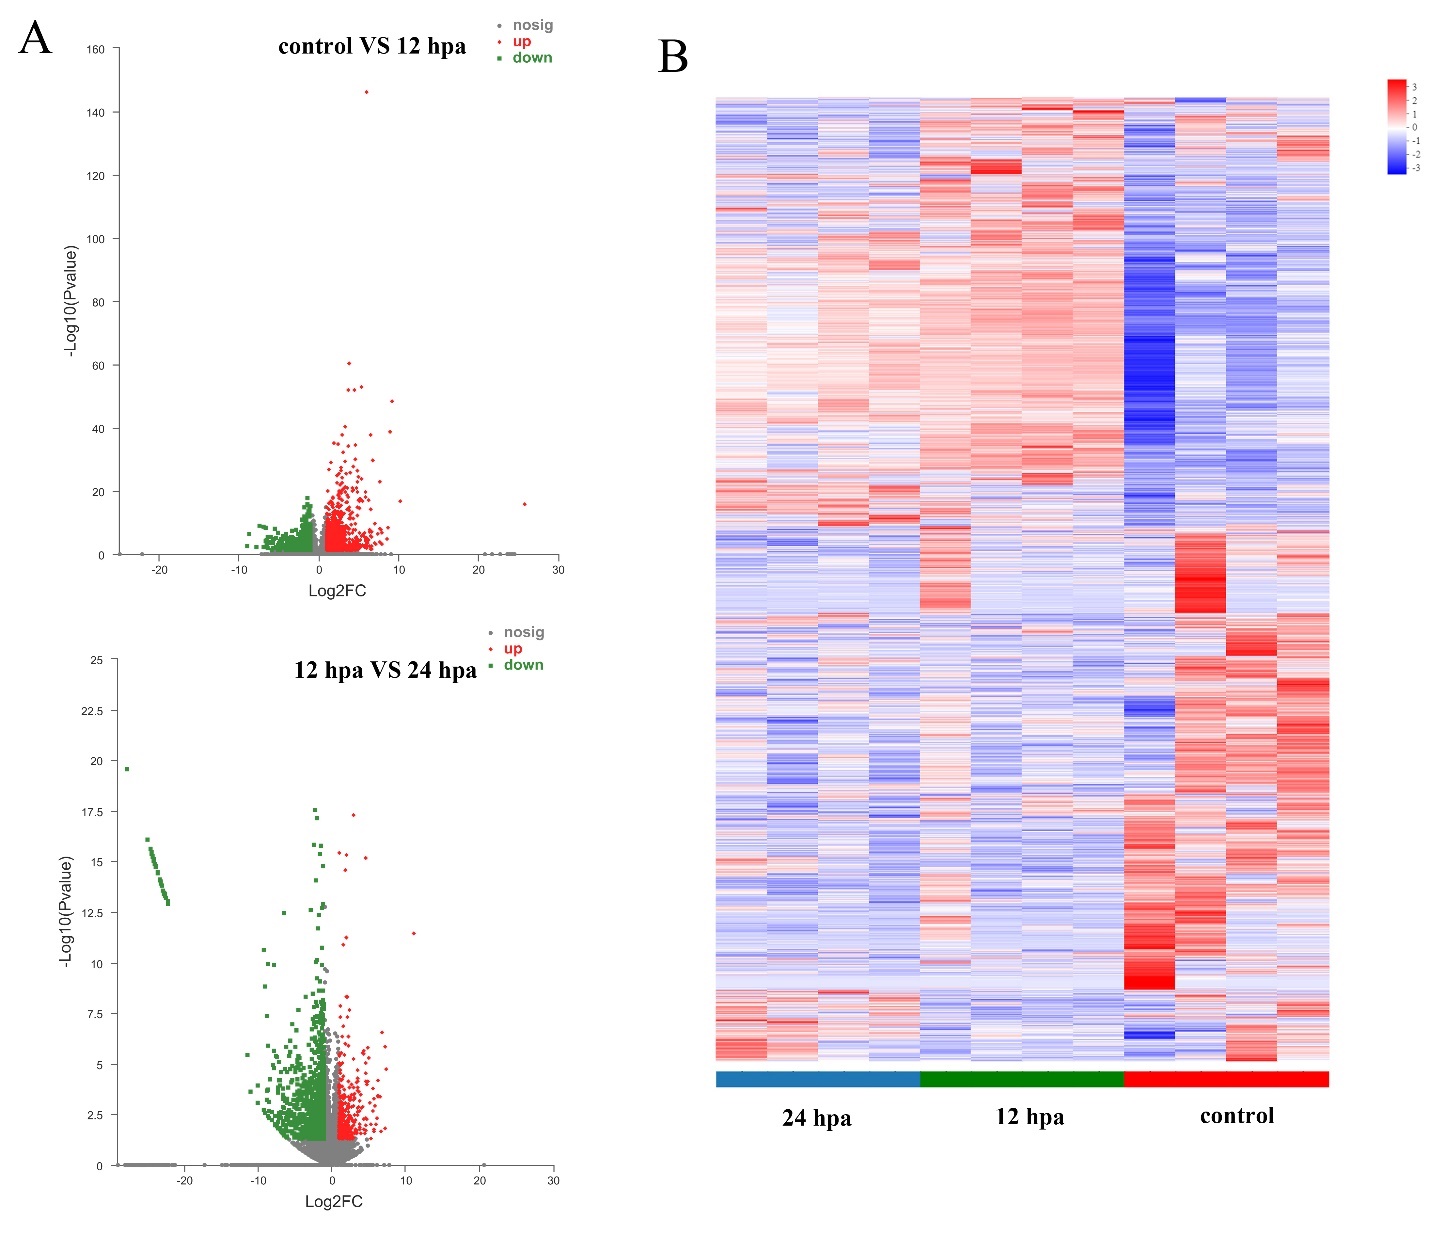
A total of 2,192 DEGs were identified between 0 hpa and 12 hpa (P < 0.05, fold change >2), with 1,237 up-regulated and 955 down-regulated genes in the 12 hpa group. And a total of 1,447 DEGs were identified between 12 hpa and 24 hpa groups, with 368 up-regulated and 1,079 down-regulated genes in 12 hpa group (Figure 2).

Compared to 0 hpa group, the expression of genes involved in glucose metabolism upregulated significantly in the 12 hpa group, such as triosephosphate isomerase B-like (tpi1b), triosephosphate isomerase A-like (tpi1a), facilitated trehalose transporter Tret1-like (Tret1), sodium/glucose cotransporter 5-like (SLC5A1). The expression of genes related to transcription and translation also upregulated significantly in the 12 hpa group, such as elongation factor 2-like (eEF2), zinc finger protein 367-like (znf367), friend leukemia integration 1 transcription factor-like (Fli1). Besides, the expression of genes related to epidermal formation was also significantly upregulated in the 12 hpa group, such as innexin inx3-like (Inx3) and innexin inx2-like (Inx2). Conversely, the expression of genes related to cuticle and crustacyanin downregulated in the 12 hpa group, such as larval cuticle protein 16/17-like, cuticle protein CP1499-like, crustacyanin-A2 subunit-like, and crustacyanin-C1 subunit-like (Table 1).
Compared to the 12 hpa group, the expression of genes related to muscle is upregulated, and related to glucose metabolism are downregulated in the 24 hpa group, such as titin (TTN) and triosephosphate isomerase-like (tpi1a). Interestingly, from 12 hours to 24 hours after autotomy, some cuticle-related genes are highly expressed, and some are low expressed. For instance, cuticle protein 6 and cuticle protein CP575-like are upregulated, and pupal cuticle protein 20-like and cuticle protein 8-like are downregulated in the 24 hpa group (Table 2).
WGCNA and Functional enrichment analysis
WGCNA analysis indicated that a total of 55 differentially expressed genes are significantly related to the 12 hpa group (grey module), and a total of 48 differentially expressed genes are significantly related to the 24 hpa group (pink module) (Figure 3A). Gene ontology enrichment analysis was used to classify these differentially expressed genes. The 55 differentially expressed genes in the grey module were mainly enriched in serine hydrolase activity, carbohydrate metabolic process, and generation of precursor metabolites and energy. And the 48 differentially expressed genes in the pink module were mainly enriched in the plasma membrane region, regulation of ion transmembrane transport, and voltage-gated channel activity (Figure 3B, C).

KEGG enrichment analysis was also conducted on the DEGs and the top 10 significantly enriched KEGG pathways were presented. The differentially expressed genes between 0 hpa and 12 hpa group mainly enriched in lipid and atherosclerosis, inositol phosphate metabolism, glycolysis/gluconeogenesis, fructose and mannose metabolism, ribosome biogenesis in eukaryotes and pathogenic infection KEGG pathways. The differentially expressed genes between the 12 hpa group and 24 hpa group mainly enriched in glycosaminoglycan biosynthesis, complement and coagulation cascades, and renin-angiotensin system pathways (Figure 4).

Discussion
The capacity to regenerate new limb after autotomyis a surprising thing and most crustaceans have this ability, such as Uca pugilator,14 Faxonius virilis,15 Eriocheir sinensis.16 In this study, the transcriptome of L. vannamei was sequenced at the early stage of limb regeneration (0 hours, 12, hours and 24 hours post autotomy), and the differentially expressed genes were analyzed. The results indicated that regeneration after autotomy involves energy metabolism, epithelial formation, transcription and translation, and cuticle metabolism processes in L. vannamei.
Compared with0 hpa group, the most significant changes in gene expression at 12 hpa are the genes related to energy metabolism, such as triosephosphate isomerase A, triosephosphate isomerase B, sodium/glucose cotransporter 5, and so on at 12 hpa (Table 1). Regeneration of the autotomized chelipeds imposes an additional energy demand which is called regeneration load in crustaceans.17 Animals need to acquire sufficient energy to regenerate the lost limb and will allocate energy after autotomy.18 These results can explain why the expression of genes related to energy metabolism upregulates rapidly at 12 hpa. In addition, the expression of genes related to transcription and translation also upregulated sharply at 12 hpa, such as zinc finger protein 367-like and transcriptional regulator Erg (Table 1). The process of regeneration requires a high amount of transcriptional and translational regulation.19 Transcriptional activity increases significantly in Echinoderms during the early stages of regeneration,20 and elongation factor is upregulated during arm regeneration in Amphiura filiformis.19 The expression of transcription and translation related genes upregulated after autotomy in L. vannamei were reasonable. The results in this study indicated that the expression of genes involved in energy production and transcription and translation processes changed significantly during the early stages of regeneration is consistent with the study in A. filiformis.21 Energy production and transcription and translation processes are essential in restoring the volume of coelomic fluid and the number of coelomocytes after autotomy that is the first response of regeneration.22 Besides, the genes related to epidermal development are also upregulated at 12 hpa, such as innexin inx2-like, innexin inx3-like and ETS homologous factor-like. Innexin 2 is upregulated during the limb regeneration process and likely facilitates the early stage of the regeneration process in E. sinensis.23 Innexin mediates instructive signaling and participated in the regeneration process of D. japonica.24,25 Innexin may play a crucial role in the regeneration process within 12 hpa in L. vannamei. In sum, the genes that are related to energy metabolism, transcription and translation, and epithelial development are activated in the regeneration process after the autotomy of L. vannamei.
From 12 hours to 24 hours after autotomy, the expression of genes that were related to the cuticle and energy metabolism changed significantly, such as cuticle protein 6 and triosephosphate isomerase (Table 2). The expression of cuticle protein 6 and cuticle protein CP575 upregulated, and cuticle protein downregulated during 12 hours to 24 hours after autotomy, while the expression of cuticle protein 6 and cuticle protein CP575 downregulated at 12 hpa compared to 0 hpa group. In Portunus trituberculatus, cuticle proteins were up regulated during limb regeneration, suggesting the cuticle proteins might promote regeneration processes, which is consistent with our research.26 Conversely, the expression of some cuticle proteins downregulated in regeneration processes. The reason may be different cuticle protein genes performed different functions. Researchers have found that cuticle protein genes have different spatial and temporal expressions and may perform different functions in Cherax quadricarinatus and Locusta migratoria.27,28 Thus, it needs further experimental evidence to confirm the function of cuticle protein in the regeneration process.
In conclusion, regeneration after autotomy is a complex and dynamic process. At the early stage (less than 24 hours), limb regeneration involves energy metabolism, transcription and translation, epidermal formation, and cuticle metabolism process in L. vannamei.
Competing interests
The authors have declared no competing interests.
Acknowledgments
This work was supported by Guangdong International Science & Technology Cooperation Program 2020 (2020A0505100026).
Authors’ Contribution
Conceptualization: Wucheng Yue (Equal), Fuhua Li (Equal). Formal Analysis: Wucheng Yue (Equal), Ruiming Yuan (Equal). Investigation: Wucheng Yue (Equal), Ruiming Yuan (Equal). Writing – original draft: Wucheng Yue (Equal), Ruiming Yuan (Equal). Resources: Donghuo Jang (Equal), Xiangzhao Guo (Equal). Writing – review & editing: Xueqiao Qian (Lead). Funding acquisition: Xueqiao Qian (Lead). Supervision: Xueqiao Qian (Lead).