


Introduction
Quality in seafood products is described as changes influenced by product characteristics and environmental conditions.1 Moreover, the freshness of raw fish has been reported as the most important criterion for consumer acceptability and as a parameter that can be determined by organoleptic evaluation.2 Besides, microbiological, chemical, and sensory parameters are used to determine the quality of seafood, and gutted and ungutted status also affects the quality changes of seafood products during storage.3 Temperature is a significant factor during seafood storage, especially in slowing or preventing microbial growth and maintaining sensory quality.4
Microbial spoilage of seafood is caused by specific spoilage organisms (SSOs). Due to the nutrient content, pH, and weak connective tissues in seafood, SSOs grow very intensely during storage, and these spoilage-causing microorganisms lead to off-odors and quality losses. Their growth is related to quality. The microorganisms that are reported to be responsible for the spoilage of seafood belong to the genera Shewanella, Pseudomonas, Photobacterium, Acinetobacter, Moraxella, and Psychrobacter.5–7 Sensory evaluation of seafood is the assessment by assessors of the changes that occur in seafood during storage and that can be perceived by the senses, such as sight, smell, taste, or touch. In this context, sensory evaluation provides information about the sensory quality of the product and also allows evaluation of the storage time.8 The QIM is a prominent way of determining the freshness of seafood based on a limited set of sensory characteristics. These features are graded from 0 to 3, with the aggregate determining the QI. As a result, the linear connection between QI and storage period and the shelf-life may be estimated. Furthermore, QIM is considered specific to each seafood species.9
In addition to microbiological, chemical, and sensory methods traditionally used in determining the quality of seafood products, mathematical models such as predictive microbiology10 and artificial neural networks11 can also be used in determining the quality of seafood products. However, a limited number of studies determine the quality changes in seafood using fuzzy logic.12,13 The fuzzy logic represents the degree of incomprehensibility in the human mind by connecting it to a real number and dealing with uncertain events quantitatively.14 In this context, ease of use in biological processes such as microbiological and sensory changes is considered one of the major advantages. In this framework, this study aims to develop a Fuzzy model by using microbiological and sensory changes in whole sea bass stored under refrigerator conditions as input and output, respectively, and to determine the shelf life according to the developed Fuzzy model.
Materials and Methods
Materials
This study used 24 sea bass with a total weight of 327.29±23.26 g. The samples were obtained from a commercial establishment and delivered in ice-protected styrofoam boxes to the laboratory. The samples were stored aerobically under refrigerator conditions (+4°C) for 12 days and were covered with plastic bags to prevent drying of the skins due to the refrigerator conditions. Microbiological and sensory analyses were performed on days 0,2,5,8, and 12 of storage.
Methods
Microbiological assessment
Microbiological analyses were periodically performed on whole sea bass stored under refrigerated conditions. On each sampling day, 25 g samples were taken aseptically and 10-fold dilutions were prepared. TMAB and TPAB were incubated on Plate Count Agar (PCA, Merck) at 30 and 4°C for 48 and 240 hours, respectively. Lactic Acid Bacteria (LAB) were enumerated on De Man Rogosa and Sharp (MRS) agar (Merck), Pseudomonas sp. were counted on Cephaloridin-Fucidin-Cetrimide (CFC, Merck) agar with CFC supplement and finally Enterobacteriaceae were determined on Violate Red Bile Glucose (VRBG, Merck) agar. LAB, Pseudomonas sp., and members of the Enterobacteriaceae family were incubated at 25°C for 120 h, 25°C for 48 h, and 25°C for 36-48 h, respectively. Bacterial counts were expressed as log cfu/g.15
Sensory analysis
The sensory analysis of the whole sea bass, which were stored under refrigerator conditions, was carried out according to the Quality Index Method (QIM) proposed by Knowles et al.16 In this context, skin brightness, hemorrhage on skin and fins, hardness, eye structure, odor and color of gills, abdominal color and vent condition parameters were evaluated by five trained assessors. The assessors gave a score between 0 and 2 or 3 for each demerit point and continued up to 22 points as a total QI score.
Fuzzy modeling
Fuzzy modeling is a method proposed by Zadeh.17 In this context, it consists of 3 main steps: fuzzification, fuzzy process, and defuzzification. In this study, fuzzy modeling specified by Zadeh17 was applied to sea bass according to the method specified by Zare and Ghazali.12 In this regard, inputs and outputs were introduced to the fuzzy system in the fuzzification step. The TMAB, TPAB, Pseudomonas sp., LAB, and Enterobacteriaceae numbers were used as input. Microorganism counts were introduced to the system as low, medium, and high. In the fuzzy processing step, the IF…THEN, rules necessary for the establishment of the model were generated. A total of 12 rules were formed for whole sea bass stored under refrigerated conditions. QI scores, which are output parameters, were matched with the input parameters within the framework of the rules. One of the rules is as follows;
IF TMAB is low, TPAB is low, LAB is low, Pseudomonas sp. is medium, and Enterobacteriaceae is low, THEN QI score is low.
Finally, in the defuzzification step, an output value was calculated by fuzzy logic according to the rules generated in the fuzzy processing part, where each rule corresponds to an output parameter (QI) corresponding to a different scenario. To calculate according to the input parameters and the rules defined, the output parameters must also have a category as low, medium, and high. In this section, the centroid method is used for defuzzification.
Statistical analysis
In this study, the analysis of variance was calculated using the ANOVA test. Tukey’s multiple analysis test was used for significant differences between means. The results are given as mean ± standard deviation. SPSS (SPSS, USA) package program was used for statistical analyses. MATLAB R2014a (The MathWorks, USA) was used for fuzzy modeling.
Results
Microbiological assessment
The Microbiological growth of whole sea bass stored aerobically under refrigerated conditions is shown in Fig 1. In this context, TMAB counts were determined on the first day of storage to be 3.16±0.12 log cfu/g. Statistically significant increases were found at the beginning and end of storage (p<0.05) and TMAB counts were determined to be 6.53±0.76 log cfu/g on the last day of storage. No statistical difference was observed on the 5th, 8th and 12th day of storage (p>0.05). The increase in TPAB counts was similar to that of TMAB (Figure 1). Accordingly, TPAB counts were 2.50±0.70 log cfu/g on the first day of storage and significantly (p<0.05) increased to 7.31±0.08 log cfu/g at the end of storage. No statistically significant difference was observed on the 8th and 12th day of storage (p>0.05).

Pseudomonas sp. numbers were determined to be the highest at the beginning and end of storage compared to other bacterial groups. It was observed that Pseudomonas sp. numbers, initially determined as 3.32±0.25 log cfu/g at the beginning of storage, increased statistically significantly (p<0.05) and reached 7.60±0.31 log cfu/g at the end of storage. Pseudomonas sp. showed a statistically significant increase during the storage period and no significant differences were determined between the 8th and 12th days (p>0.05). Lactic acid bacteria and members of the Enterobacteriaceae family showed slower growth than other bacterial groups in aerobically stored sea bass under refrigerator conditions. Therefore, LAB and Enterobacteriaceae counts on the first day of storage were 2.25±0.49 and 1.65±0.49 log cfu/g, respectively. While no statistical difference was observed for LAB counts on the 5th and 8th day of storage (p>0.05), a significant increase (p<0.05) was observed on the 12th day, the last day of storage, reaching 4.58±0.04 log cfu/g. No statistical differences were observed in the members of the Enterobacteriaceae family on the 5th, 8th and 12th days of storage and their number was determined to be 4.27±0.14 log cfu/g on the last day of storage. However, significant increases were observed compared to the initial day of storage (p<0.05).
Sensory changes
Sensory changes in sea bass aerobically stored under refrigerator conditions are shown in Figure 2. Accordingly, the samples evaluated in terms of skin brightness, hemorrhage on skin and fins, hardness, eye structure, odor and color of gills, abdominal color and vent condition parameters reached a total of 22 QI scores at the end of storage. At the beginning of storage, the total QI value was determined as 2.20±1.78. The color change in the skin of the samples according to the storage time was found to be statistically significant on the 8th day of storage and was observed as 2.00±0.70. Hemorrhage on the skin and fins was 0.80±0.44 on the 5th day of storage and 1.60±0.54 on the 8th day of storage. Eye transparency started to decrease on the 8th day of storage and was observed as completely opaque by the assessors on the 12th day of storage and completed all demerit points totaling 2. Eye pupil reached a value of 1.60±0.54 on the 8th day of storage. Eye shape started to lose its form from the 5th day of storage and reached 1.80±0.44 and 2.40±0.54 on the 5th and 8th days of storage, respectively.

Gill color and odor significantly (p<0.05) diverged from the freshness levels as of the 8th day of storage and reached 1.60±0.54 and 1.80±0.44, respectively. The whole sea bass samples stored for 12 days under refrigerator conditions completed half of the total QI score on the 5th day of storage and reached a value of 11.20±0.83. Moreover, off-odours were observed in the samples on the 8th day of storage and the total QI score was determined as 17.40±1.94. On the last day of storage, the samples reached a total QI score of 20.80±1.30. R2=0.97 was calculated between the QI score and storage time (Fig. 2).
Fuzzy model
The Fuzzy model was developed by applying a total of 12 rules to aerobically stored whole sea bass under refrigerator conditions. For the variables, 3 categories were determined as low - medium and high. According to the IF..THEN rules, the defuzzification process was applied and QI values were calculated and the categories related to sensory changes are shown in Figure 3. According to this, the categories associated with the changes of microorganisms correspond to 3 different classes in the QI score.
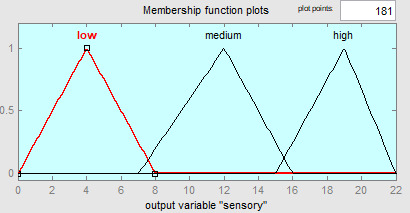
According to the established rules, for the QI score of the “low” class, the product is consumable and meets the freshness criteria; for the score of “medium”, the product begins to deviate from the first conditions in terms of freshness; the smell is pronounced, the change in color and smell of the gills is marked; and finally, for the category that matches the “high” class, the off-odors start, the eye structure has deteriorated, and the odor in the gills is prone. The corresponding variations of the calculated and observed values are shown in Figure 4. In the developed fuzzy model, the R2 value is 0.96. Furthermore, the correlation between the calculated and observed QI scores is r = 0.98.

Discussion
Microbiological assessment in whole sea bass stored at refrigerator conditions was investigated during 12 days of storage. Initial TMAB and TPAB counts of whole sea bass were 3.16±0.12 and 2.50±0.70 log cfu/g, respectively. Lower than the initial TMAB counts of sea bass stored under refrigerated conditions, Caklı et al.18 reported a TMAB value of 2.78±0.02 log cfu/g and a similar TPAB count of 2.47±0.06 log cfu/g in ungutted seabass stored whole on ice. In another study, Turan and Kocatepe19 investigated the effect of different modified atmosphere packaging (MAP) conditions on the shelf life of gutted seabass. The researchers reported that the initial TMAB count of gutted seabass was 2.83, and TPAB values were 3.27 log cfu/g, lower and higher than whole sea bass stored under refrigerator conditions. In a different study, MAP application effects on the microbial quality of gutted seabass were investigated. The researchers reported the initial total viable count of gutted seabass as approximately 4 log cfu/g, similar to this study.20 This study’s TMAB and TPAB values exceeded the microbiological criterion of 6 log cfu/g21 on the 8th day of 12-day storage (Figure 1). The initial counts of Pseudomonas sp., LAB and members of the Enterobacteriaceae family were determined to be 3.32±0.25, 2.25±0.49 and 1.65±0.49 log cfu/g, respectively. Similar initial values for Pseudomonas sp. were reported as 3.0 log cfu/g for gutted seabass by Tsironi et al.20 Higher results were reported as 4.40±0.12 log cfu/g for whole seabass by Syropoulou et al.,22 and lower values were observed for gutted seabass by Turan and Kocatepe19 with a count of 2.52 log cfu/g. At the end of storage, Pseudomonas sp. numbers were 7.60±0.31 log cfu/g. Pseudomonas sp. is among the bacteria causing spoilage in seafood and has been reported to be dominant in the spoilage microflora of seafood.22 Parlapani et al.23 reported Pseudomonas sp. counts in gutted seabass stored at 2°C with aerobic and MAP treatment to be 7.2 log cfu/g at the storage time when the samples were rejected at the sensory level. In this context, it is similar to the Pseudomonas sp. counts at the end of the storage period of whole sea bass stored under refrigerator conditions. Boulares et al.24 examined the effects of LAB and citrus essential oil on the quality parameters of vacuum-packed seabass. The researchers reported that the initial LAB counts of the samples were 4.21±0.58 log cfu/g, higher than the seabass stored whole in the refrigerator, and 6.81±0.10 log cfu at the end of 21 days of storage. However, LAB counts of seabass stored whole in refrigerator conditions were determined as 4.58±0.04 log cfu/g at the end of 12 days of storage and were observed to be lower than the LAB counts reported by Boulares et al.24 It has been reported that members of the Enterobacteriaceae family can grow at low temperatures but their growth is slower than that of other psychrotroph spoilers and that members of the Enterobacteriaceae family should be considered after harvesting from more polluted waters or when refrigeration or chilling is delayed.25 At the end of the storage period, the number of members of the Enterobacteriaceae family was determined to be 4.27±0.14 log cfu/g in seabass stored under refrigerated conditions, which was lower than the other bacterial groups examined (Figure 1). Ucar et al.26 reported the Enterobacteriaceae counts of sea bass fillets stored under cold conditions as 5.26 log cfu/g on day 6, Kritikos et al.27 reported the Enterobacteriaceae counts of MAP-treated sea bass fillets stored under chilled conditions to be < 4. 6 log cfu/g, and Iacumin et al.28 reported the Enterobacteriaceae counts of gutted vacuum and MAP treated sea bass kept at cooled conditions to be 4.0±0.7 and 4.5±0.8 log cfu/g on the 12th day of storage, respectively. In this context, the numbers of Enterobacteriaceae family members of sea bass stored aerobically under refrigerator conditions are similar to other studies.
QIM is one of the most used indexes to evaluate the sensory changes in seafood. The QIM developed by Knowles et al.16 for sea bass was used in this study. The QIM, which has a total of 22 demerit points (dp), was used for sea bass stored under refrigerated conditions and the changes of dp’s over time are shown in Figure 2. The samples had an initial QI score of 2.20±1.78, indicating that the sea bass used in the study were reasonably fresh according to the QIM (0=very fresh and 17-22=spoiled, off-odour). The QI scores of the samples increased significantly (p<0.05) according to the storage time. The samples reached 11.20±0.83 on the 5th day of total storage and 20.80±1.30 at the end of storage. In the sensory evaluation of sea bass according to QIM, the assessors suggested that the samples were not consumable on the 8th day of storage (QI=17.40±1.94). In similar studies, Özogul et al.29 studied sea bass fillets treated with nanoemulsion oils and stored under chilled conditions. The researchers reported that the storage time at which the samples had sensory rejection was 8 days, and the QI score was 13 in the control groups. In another study, ungutted sea bass were stored under different storage conditions (from -1°C to 22°C). The researchers reported that the samples stored in sea water (20–22 °C), storage room (16-18°C) and sea water (10-12°C) reached the sensory rejection point of 22 dp after 15, 45, and 65 hours, respectively.30 In a different study, Erdağ and Ayvaz31 determined fish freshness in sea bass by color parameter. The researchers reported that the total QI score of 15 dp was indicated by the assessors on the 5th day of storage in sea bass kept at 4°C.
In this modelling study, microbial and sensory changes in whole sea bass stored under refrigerator conditions were investigated and the effect of microbial changes on sensory parameters during storage time was examined by applying a Fuzzy model. Moreover, by implementing a Fuzzy-based approach in which microbial parameters are used as input and sensory parameters are used as output. By developing the Fuzzy model, the shelf life of sea bass stored whole in refrigerator conditions was determined. The output values (QIM scores) calculated according to the Fuzzy model were compared with the QI scores of the samples evaluated by the assessors and the results are given in Figure 4. Accordingly, the R2 value is 0.96 and the correlation coefficient has been determined to be r=0.98. There was a high correlation between the observed and calculated values. In this framework, it is evident that the developed model can predict the shelf life of whole sea bass stored in refrigerator conditions. In a study, Zare and Ghazali12 determined the quality changes of sardine fish according to biogenic amine concentrations by applying a Fuzzy-based model. The researchers monitored the quality changes in sardines stored at different temperatures (0, 3, and 10°C) for more than 15 days. In addition, the researchers created 12 grades for the output data. According to the research results, the correlation coefficients between quality changes and storage time regarding storage temperatures were reported to be 0.97, 0.95, and 1, respectively. In another study,32 in which microbial growth parameters were used as input, the growth rates of Listeria monocytogenes were predicted according to the Fuzzy model. The researcher created 13 Fuzzy rules using 41 growth rates. According to the rules, the correlation coefficient of the calculated and observed growth rates was 0.84. In this context, the correlation coefficients reported by the researchers are similar to the whole sea bass stored in refrigerator conditions.
Conclusion
In this study, microbiological spoilage of whole sea bass stored under refrigerator conditions was investigated, and microbiological and sensory indices were analyzed during shelf life in the light of sensory analysis according to QIM. In this context, according to microbiological and sensory criteria, the shelf life of sea bass fish at +4°C was determined to be 8 days. In addition, a Fuzzy model was developed in this study. In the model, a total of 12 rules were generated. The numbers of TMAB, TPAB, Pseudomonas sp., LAB, and members of the Enterobacteriaceae family were used as input. The QI scores of the samples evaluated according to the QIM method were used as output. It was observed that the Fuzzy model could determine the sensory criteria according to microbiological changes with a high correlation (r=0.98) within the 12 rules developed in this framework. Since the rules of the developed Fuzzy model apply to different seafood products, it is concluded that the model developed in this study should be investigated in other seafood products by adjusting the generated rules.
Acknowledgments
The author would like to thank the assessors for attending the sensory analysis sessions.
Author Contribution per CRediT
Conceptualization: İsmail Y. Genç (Lead). Methodology: İsmail Y. Genç (Lead). Formal Analysis: İsmail Y. Genç (Lead). Investigation: İsmail Y. Genç (Lead). Writing – original draft: İsmail Y. Genç (Lead). Writing – review & editing: İsmail Y. Genç (Lead). Funding acquisition: İsmail Y. Genç (Lead). Resources: İsmail Y. Genç (Lead). Supervision: İsmail Y. Genç (Lead).