Introduction
Shrimp is among the most important seafood due to its high nutritional and commercial value. The world shellfish production is around 11.2 million tons/year, the shrimp production accounting for more than 7 million tons/year.1 In Türkiye, shrimp is caught from the Marmara, Aegean, and Mediterranean coasts. The amount of shrimp caught from these regions, of which a significant portion is exported after processing, is approximately 5500 tons/year.2
Shrimp is a highly perishable seafood. Its deterioration primarily originates from biological reactions, i.e., decomposition mediated by microbial or endogenous enzymes, protein degradation, or lipid oxidation. One of the most significant spoilage reasons for shrimp is the accumulation of undesired compounds from biochemical reactions and microbiological growth.3
The color change is among the most crucial quality problems of shrimp after capture. This color change is called “melanosis,” “blackening,” or “black spot.” Tyrosine and hydroxyphenylalanine emerge due to the decomposition of the proteins in shrimp meat. These amino acids are oxidized and transformed into melanin pigments with the effect of the tyrosinase enzyme. The blackening is most commonly encountered around the head and legs due to excessive tyrosinase enzyme. The contribution of environmental factors (light, temperature, microbial, etc.) in the formation and development of melanosis is very significant. In addition, delayed decapitation and application of insufficient cooling or no cooling after capture accelerates the process. While the color change is only at appearance first, it later manifests itself in the meat, causing deterioration in quality and thus economic losses.4–6 Shrimps are usually immersed in sodium metabisulfite solution to eliminate this damage and prevent color change. However, in addition to avoiding the color change in shrimps, this substance’s residue amount must be at a level that does not threaten human health. The potential risks of sodium metabisulfite in terms of human health necessitated strict control of its use, and many countries added this substance to the ‘positive list’, which shows the maximum concentration in foods, and republished it.7 It is estimated that the regulations to be issued on the use of sodium metabisulfite and similar chemicals in the near future will inevitably affect the shrimp industry adversely. Instead of synthetic additives, using natural additives that do not pose a risk to human health in foods is healthier and safer.8
Natural extracts and phenolic compounds, which are known to have no harmful effect, have recently attracted much attention as an alternative to chemicals used to delay the formation of melanosis in shrimp and increase the shelf life of the product.5,8,9 Among these, chitosan appears high on the list. Chitosan is chemically similar to cellulose and is the most commonly found biopolymer after cellulose in nature. It is obtained by partial deacetylation of chitin, a natural polysaccharide found in the exoskeletons of shellfish such as crab, lobster, crayfish, and shrimp, and in the cell walls of fungi.10–15
The physicochemical properties of chitosan depend on the deacetylation degree and molecular weight.12,16 Chitosan has varying viscosity, deacetylation degree (40-98%), and molecular weight (50,000-2,000,000 Da). The deacetylation degree indicates the number of deacetylated N-acetyl-D-glucosamine units relative to the total number of units.17 The deacetylation degree of chitosan varies depending on the chitin source, isolation method, treatment time with sodium hydroxide, concentration, and temperatures applied in the extraction steps.18
Chitosan can significantly improve the shelf life of various foods due to its properties, such as moisture retention, film formation, and enzyme immobilization, as well as antimicrobial and antioxidant effects. In addition, studies on its use in foods have been increasing in recent years since it is biodegradable, non-toxic, and recognized as safe in foods (GRAS) by the U.S. Food and Drug Administration (FDA). Therefore, the present study aimed to employ chitosan, a well-documented natural additive, as an alternative to the currently used chemical, sodium metabisulfite, to eliminate such a critical quality problem and to examine the changes using digital image processing techniques, which are used in the detection of food spoilage in recent years, along with subjective sensory evaluations.
Materials and Methods
Materials
All chemicals and compounds used in the study, such as sodium metabisulfite (puriss., meets analytical specification of Ph. Eur., BP, NF, FCC, E223, dry, 97-100.5%, CAS-7681-57-4), citric acid (ACS reagent, ≥99.5%, CAS-77-92-9), acetic acid (≥99%, glacial, ReagentPlus®), HCl (37%, EMPROVE® ESSENTIAL), NaOH (≥98%, anhydrous pellets), and H2O2 (30%, stabilised, EMPROVE® ESSENTIAL) were analytical grade and purchased from Merck and Sigma-Aldrich.
Chitosan Extraction and Characterization
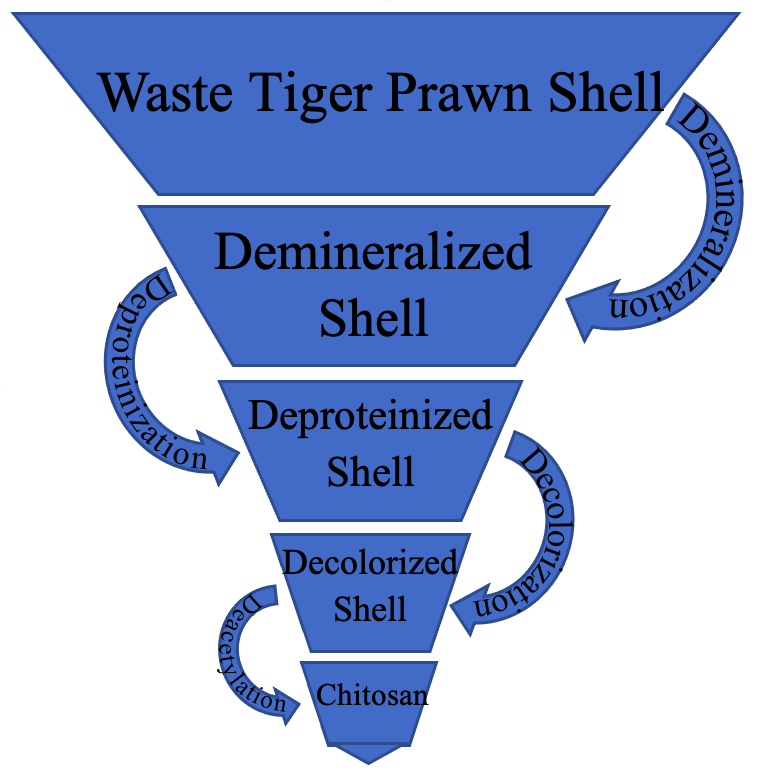
Tiger Prawn (Penaeus semisulcatus) shell wastes acquired from shellfish processing factories were used for chitosan extraction. Chitin was obtained from waste shells by demineralization, deproteinization, and decolorization processes with modifications in the method of Fernandez-Kim.11 Chitosan was then extracted by deacetylation of chitin in an alkaline environment under high temperature and pressure. In these processes, chitosan having two different deacetylation degrees was obtained by applying 1.7N HCl for 5h, 2M NaOH for 3h, HCl:H2O2 for 30 min, and 50% NaOH at 120°C at 1.25 atm pressure for 30 min and 6 h, respectively (Figure 1).

Elemental analysis, Fourier transform infrared spectroscopy (FT-IR), X-Ray diffraction analysis (XRD), scanning electron microscopy (SEM), color measurement, and dynamic viscosity analysis were performed for the characterization of the extracted chitosan. For these analyses, the methods of Kucukgulmez et al.,19 Küçükgülmez et al.,20 Kadak,12 and Kadak et al.21 were followed.
For elemental analysis, the percentages of carbon (C), hydrogen (H), and nitrogen (N) elements were determined with the Eurovector brand EA-3000 Single model instrument, and the deacetylation degree was determined using the C/N ratio. The deacetylation degree was calculated using the following formula22,23;
\[ \mathrm{DA} \%=[(\mathrm{C} / \mathrm{N}-5.14) / 1.72] \times 100 \tag{1} \]
\[ D D \%=100-D A \% \tag{2} \]
Infrared characterization of chitosan was performed with Bruker brand Alpha Platinum ATR model device. The deacetylation degree was calculated with to the formula below using the values obtained at wavelengths of 1320 cm-1 and 1420 cm-1 in the FT-IR analysis24;
\[ \small{ \mathrm{DD} \%=100-[((\mathrm{A} 1320 / \mathrm{A} 1420)-0.3822) / 0.03133] \tag{3} } \]
For viscosity measurements, chitosan solutions were prepared at 1% concentrations in 1% acetic acid, and measurements were made using Ubbelohde capillary viscometer at 23±1 °C.
In the color measurements of chitosan, L*, a*, and b* values were recorded according to the HunterLab Scan measurement method specified by Calder.25 In this measurement system, the ‘L*’ value represents brightness (whiteness-blackness or lightness-darkness), the ‘+a*’ value represents red color, the ‘-a*’ value represents green color, the ‘+b*’ value represents yellow color, and the ‘-b*’ value represents blue color. At least five different points on the sample were used for each measurement. Chroma, hue, and whiteness values were calculated using average color data. Before the analysis, the instrument was calibrated with a white and a black plate.
XRD analysis was conducted by scanning between 5-50 θ values using a Bruker brand instrument.
The FEI brand Quanta FEG 250 model scanning electron microscope was used for SEM imaging. The samples’ surface, which should have a conductive surface due to the analysis’ working principle, was made conductive by coating with gold-palladium (Au/Pd) for 45 seconds using the Cressington Sputter Quater 108 Auto device. Imaging was performed under high vacuum, at different kV values and magnification ranges. Images obtained at 40,000x magnification were used for the examinations.
Preparation of Deep-Water Rose Shrimp
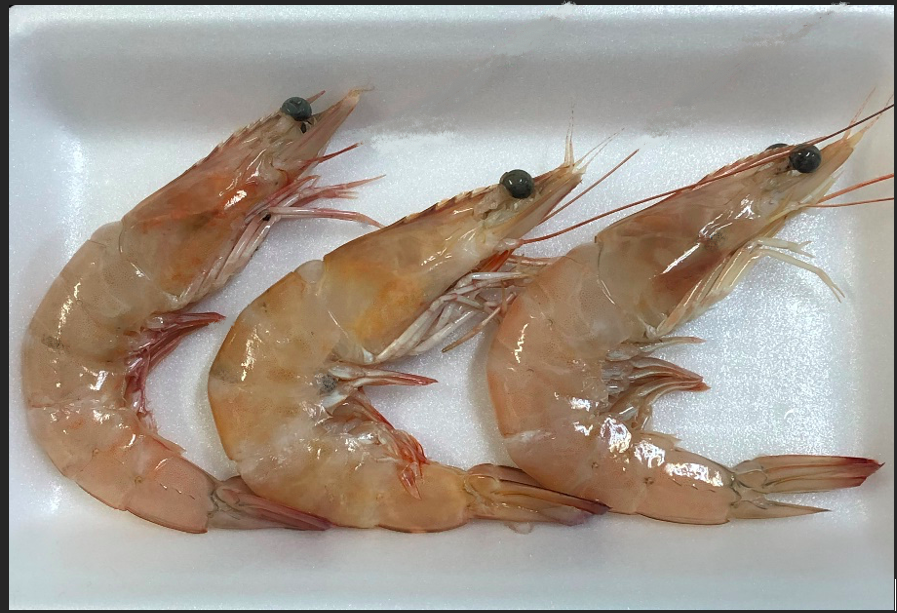
The deep-water rose shrimp (Parapenaeus longirostris Lucas, 1846) specimens used in the study were obtained from the local fish market. The samples were transported to the laboratory in a Styrofoam box filled with ice (shrimp:ice, w:w, 1:2), and the day they were brought was assigned as day 0. The shrimps were recently caught, received no chemical treatment, and displayed no melanosis (Figure 2). The mean length and weight of the shrimps were measured as 16.56±1.14 cm and 32.84±3.10 g, respectively. Randomly choose three shrimp were used for each group.
.png)
Preparation of Solutions and Treatment with Shrimps
Seven different groups, consisting of 3 control groups and four different solutions, were created for the present study. The shrimps were arbitrarily taken from the Styrofoam boxes, and groups with equal samples were formed. The following group names and abbreviations were assigned: G1 (control- water), G2 (control- 1% acetic acid), G3 (control- ice), G4 (0.5% high deacetylation degree -HDD- chitosan), G5 (0.5% low deacetylation degree -LDD- chitosan), G6 (1% sodium metabisulfite), and G7 (1% citric acid).
The prepared solutions were added to the whole shrimps at a ratio of 1:1.5 (v/w) by immersion method and stored at 4 ºC. Afterwards, the shrimps were drained on 40x40 cm-sized absorbent lab sheets and placed on Styrofoam plates. The plates containing shrimps were held in refrigerator conditions (+4 ºC) throughout the study.
Methods
Analyses of Stored Shrimps
The analyses were conducted under two categories: sensory evaluation and digital image processing.
Sensory Evaluation
The melanosis index was determined with a visual assessment based on the melanosis index scale (from 0 to 10) of Otwell and Marshall.26 This evaluation was carried out by seven expert panelists based on the rate of blackening on the shrimp shell surface. For this evaluation, three shrimp samples were used. The assessment scale is as follows: 0= absent, 2= slight - noticeable on some shrimps, 4= slight - noticeable on most shrimps, 6= moderate - noticeable on most shrimps, 8= heavy - noticeable on most shrimps, and 10= heavy - totally unacceptable.
Digital Image Processing
Appearance assessment for color changes was carried out by examination of photographs taken throughout the storage. Obtained images were evaluated with digital image processing techniques. For this evaluation, image correction, image enhancement, classification, and data integration techniques, which enable digital images to be interpreted using various mathematical algorithms with computer assistance, are called digital image processing methods.27–29
Image Segmentation and Algorithms
Image segmentation is an image enrichment process that enables the identification of homogeneous objects on visual data by automatically separating them into sublayers.30 This method was first developed by Kettig and Landgrebe.31,32
The image segmentation algorithm of the Definiens Developer software classifies pixels with similar properties into homogeneous pieces based on spectral and spatial criteria. In this process, mentioning an accurate segmentation option is not possible. A large number of trials should be conducted until the segments most suitable for the purpose of the study are created. The important thing here is to establish a proper structure from the pixel to the object by providing the appropriate homogeneity. For this reason, scale, color, shape, softness, and integrity variables are used in the segmentation stage. With the help of a function including these variables, a chain structure is established from pixel to segment and from segment to larger segments.33 The classification stage is initiated after the compatible fields are determined in the Definiens Developer software. At this point, an appropriate, realistic segmentation based on the sample’s color differences is critical.34 Therefore, it is necessary to create a structure that can express the visually closest fields with segments separated as much as possible from each other and keep the heterogeneity in balance. The segmentation process aims to work on groups of pixels with similar properties instead of just pixels and uses tissue features to distinguish the color changes/distortion in shrimp (P. longirostris). For this purpose, image objects are segmented using the segmentation algorithm integrated into the Definiens software. The bottom-up field-joining method was employed in the segmentation of the photographs of the P. longirostris taken during 12 days of storage after treatment with different preservatives.
Segmentation Algorithms
Segmentation algorithms are used to subdivide a complete image consisting of pixel-level fields or special image objects within smaller image files. Definiens offers several different approaches to solving problem sources with the help of straightforward algorithms, using various methods such as contrast segmentation or multidimensional resolution segmentation (e.g., quadtree, a non-uniform mesh generation technique, and chessboard). Segmentation algorithms are needed when it is desired to create a new image file based on the image’s layer information. These algorithms become handy tools for retouching an existing image file by dividing it into smaller pieces for more detailed analysis. The ‘spectral variation hypothesis’ proposed by M. Palmer et al.35 and M. W. Palmer et al.36 states that higher spectral heterogeneity in an image corresponds to higher diversity. Tissue parameters calculated for the detection of GLCM-based melanosis confirm this hypothesis. The inputs were the segmentation scale, color, shape, integrity, and transitivity parameters. In this method, color and shape parameters and integrity and transitivity parameters take the complementary values of 1.37 Several value combinations were assigned to the segmentation parameters to find the appropriate parameter values, and visual analysis was used for the decision. In the visual examination, the spatial and morphological suitability of the image objects obtained for the field were evaluated, and the segmentations that best distinguished the damaged and undamaged regions were preferred.
Haralick texture
The grey-level co-occurrence matrix (GLCM) lists how often combinations of grey pixel levels differ within an image. There is a different reoccurrence matrix for each neighboring relationship. To obtain the vector constant, all four different directions (0°, 45°, 90°, 135°) are summed up before the texture calculation. The 0° angle represents the vertical direction, and the 90° angle represents the horizontal direction. In the Definiens package program, the Haralick texture is calculated for all pixels of an image file. To reduce the edge effect, the image file is subjected to an additional calculation process to include the pixels surrounded by a certain distance. Each GLCM is normalized according to the formula below. For the texture calculation of Haralick texture, the parameters were applied as follows: scale= 30, shape= 0.3, and compact= 0.5 in the analysis within the Definiens package program. GLCM entropy texture parameters were calculated for each segment.
The Haralick image structure differs from the original pixel size of the image data. The generated dynamic array is converted to 8-bit data before the joining occurs. Although the direct use of 8-bit data will yield more reliable results, it is necessary to use dynamic data higher than 8 bits to calculate the samples’ mean and standard error values. The pixel is divided into 255 equal parts within itself when 8-bit data is used for Haralick texture.
GLCM is a feature extraction method proposed by M. Haralick to extract features from a greyscale image. GLCM defines the relationship between two adjacent pixels. The first of these pixels is known as the reference pixel, and the second is the neighbor pixel.38 GLCM creates a frequency matrix between two consecutive pixels in an image. The distribution in the matrix is adjusted according to the distance and angle between the pixels. This matrix is an Ng-sized square matrix, and each matrix element specifies the number of occurrences of pairs of i and j pixel values at d distance.39 From these matrices, four properties, i.e., contrast, homogeneity, entropy, and brightness, were calculated to characterize the image’s texture.
Texture properties calculated from GLCM;
i) Contrast
Contrast is heterogeneity, which is the opposite of homogeneity. Contrast is assessed by determining the amount of local variation in the image. The number of rows (i) and columns (j) increases in parallel with the increase in contrast.40 The parameters for the calculation are as follows:
\[\sum_{i,\ j = 0}^{N - 1}{P_{i,\ j}(i - j)}^{2}\tag{4}\]
In Equation 4: = number of rows, = number of columns, = normalised and values, = number of rows or columns. Value range= [0; 90].
ii) Homogeneity
If certain areas of a cell show homogeneity and GLCM values are concentrated in the corners, that cell has a high color value. The color values of homogeneous areas and heterogeneous areas are opposite to each other. Values decrease from heterogeneous to homogeneous areas.40 The parameters for the calculation are as follows:
\[\sum_{i,\ j = 0}^{N - 1}\frac{P_{i,\ j}}{{1 + (i - j)}^{2}}\tag{5}\]
In Equation 5: = number of rows, = number of columns, = normalised and values, = number of rows or columns. Value range= [0; 90].
iii) Entropy
The uniform distribution of GLCM values leads to an increase in entropy value.40 The parameters for the calculation are as follows:
\[\sum_{i,\ j = 0}^{N - 1}{P_{i,\ j}({- ln}P_{i,\ j})}\tag{6}\]
In Equation 6: = number of rows, = number of columns, = normalised and values, = number of rows or columns. Value range= [0; 90].
iv) Brightness
It is the sum of reflectance values, calculated for an image object and averaged by dividing by the number of pixels the image object occupies in all band layers. This feature is calculated only with positive layer values because errors will occur in the brightness value when calculated with combined data (negative and positive) in the image bands. More than one band is required for the calculation. Otherwise, the brightness value cannot be calculated.
\[w_{k}^{B} = \left\{ \frac{0}{1} \right.\ \tag{7}\]
\[w^{B} = \sum_{k - 1}^{K}w_{k}^{B}\tag{8}\]
\[\overline{c}(v) = \frac{1}{w^{B}}\sum_{k - 1}^{K}{w_{k}^{B}\overline{c_{k}}}(v)\tag{9}\]
In Equations 7, 8, and 9: wkB= brightness degree of k layer, ¯ck(v)= average intensity of v image object in k layer, ckmin= darkest intensity value of k layer, ckmax= brightest intensity value of k layer. Value range= [ckmin; ckmax].
This study analysed images of P. longirostris in jpeg file format. The GLCM matrices were obtained with the e-Cognition34 software. The values, which included the brightness parameter among the matrices’ feature vectors, constituted the calculated data of the study.
Results
Physicochemical Characterization of Chitosan
Characterization data of chitosan extracted from shrimp shells are given in Table 1.
According to the results of physicochemical analysis, the deacetylation degrees for HDD and LDD measured by two different methods were calculated as 99.5% and 76.31% in elemental analysis and 89.51% and 78.24% in FT-IR spectroscopy, respectively. Deacetylation degrees showed parallelism in both methods. The viscosity values were also measured as 0.34cSt and 4.17cSt, respectively. Chitosan’s viscosity values can be significantly affected by the degree of deacetylation, solution concentration, and pH and temperature in the chitosan production.41 According to the color measurements, the color values in HDD and LDD chitosan groups were 83.68 and 78.94 for L*, 0.55 and 2.71 for a*, 10.33 and 13.85 for b*, respectively. The chroma values calculated with the obtained color measurements were 10.34 and 14.11, the hue values were 1.51 and 1.37, and the whiteness values were 80.67 and 74.64, respectively. While chroma indicates the intensity of color, hue angle indicates red versus yellow. Based on these data, HDD chitosan was observed to appear lighter cream-white in color than LDD chitosan.
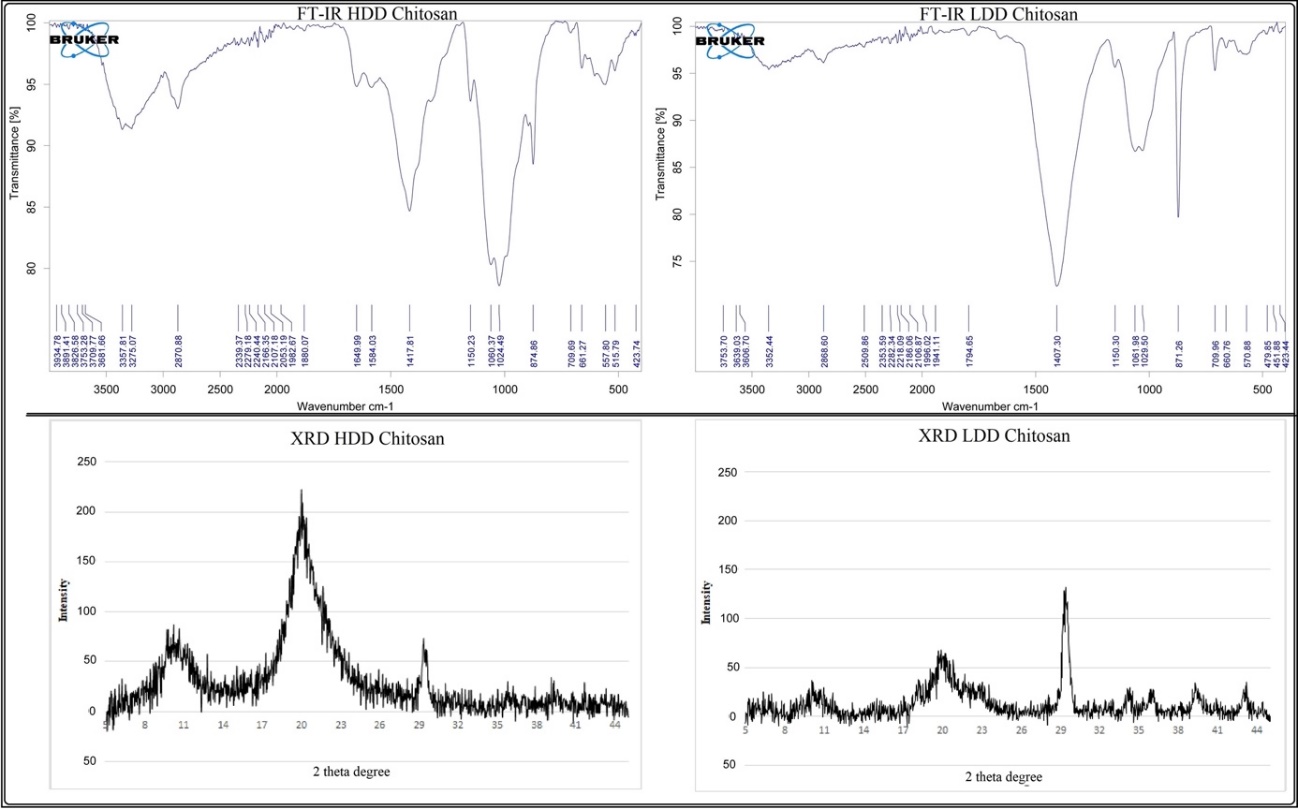
Within the scope of the study, SEM images and FT-IR and XRD spectra were also examined for the characterization of chitosan samples extracted at different deacetylation degrees. The FT-IR and XRD analysis results are presented in Figure 3, and the results of SEM images are given in Figure 4.

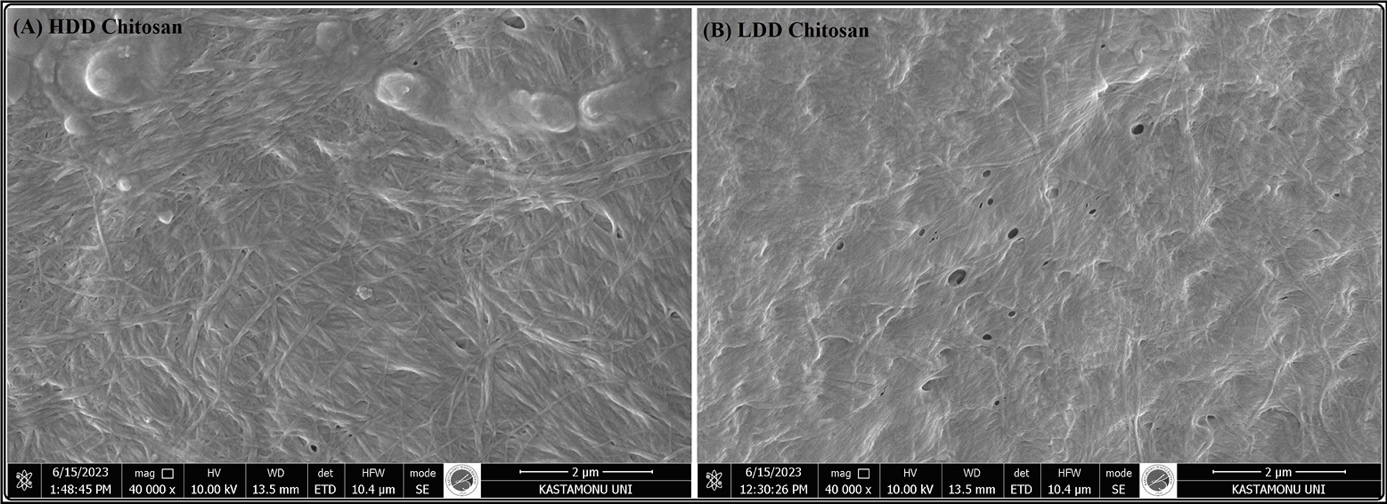
SEM image analysis of HDD and LDD chitosan extracted within the scope of the study was performed on images obtained at 10.00kV energy level with 40.000x magnification (Figure 4).

Changes During Shrimp Storage
Sensory changes
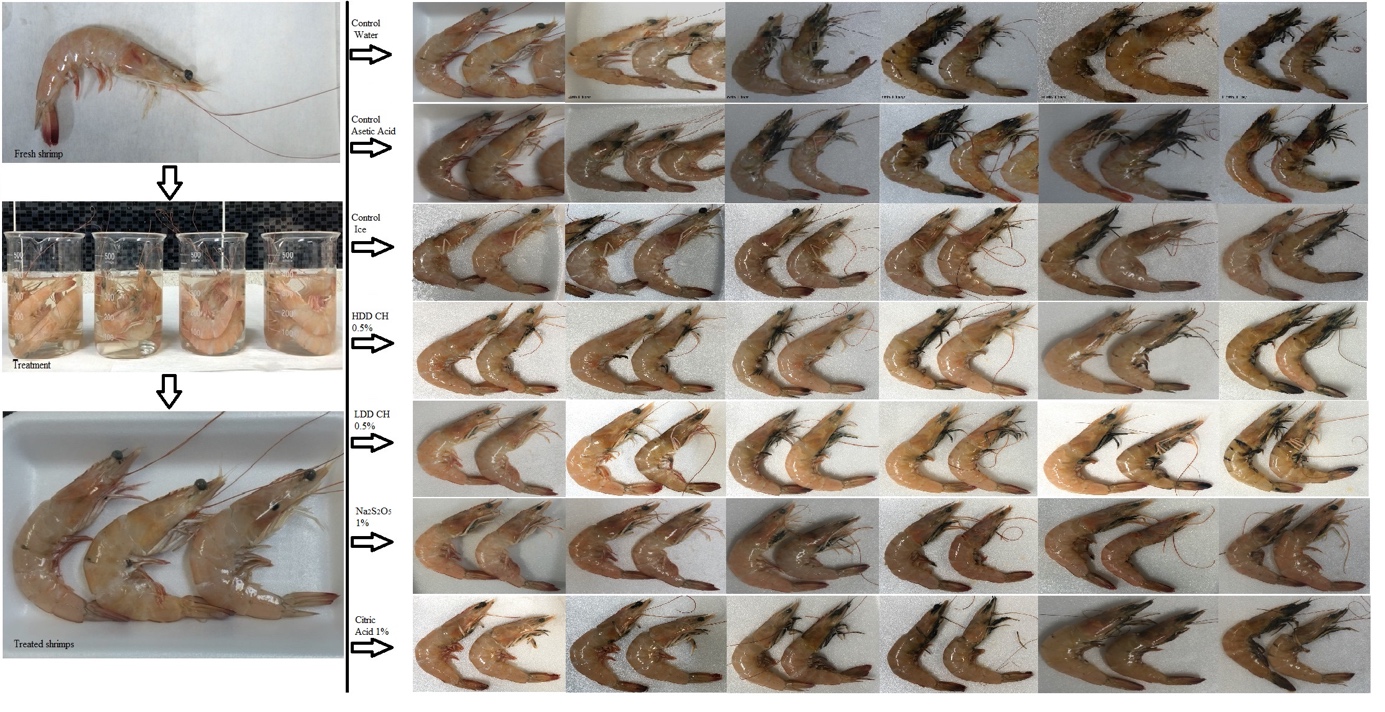
The fresh shrimp samples obtained from the local fish market were transported to the laboratory in the cold chain, and all processes were carried out as rapidly as possible. Extreme precautions were taken to prevent the formation of melanosis due to external factors such as temperature and light. Equally and arbitrarily grouped shrimp specimens were stored in styrofoam boxes containing flake ice. After the treatments, the melanosis formation images obtained from the control groups (G1= water, G2= acetic acid, G3= ice), trial groups (G4= HDD chitosan, G5= LDD chitosan), and commercial preservative groups (G6= sodium metabisulfite, G7= citric acid), during the storage are presented below in Figure 5.

As shown in Figure 5, all shrimp samples’ color and texture integrity were considerably well on the 4th day of storage. Melanosis formation is in the early stages, especially on the 6th day. Melanosis began to emerge in groups 1, 2, and 3, i.e., control groups. On the 8th day, the formation of melanosis in the first three groups was distributed throughout the body, and the development of melanosis in these groups exceeded the acceptable level. Tissue integrity started to deteriorate, especially in G1 and G2 samples. In other groups, melanosis began partially. On the 12th day, melanosis advanced in all groups, and all samples became inconsumable.
Color changes
The changes in the color values of the shrimp groups immersed in different solutions and stored in refrigerator conditions are given in Table 2 and Table 3.
The brightness (L*) value, the most influential sensory value on consumer preference, was observed as the highest (51.43) in the HDD chitosan group on the first day of the study. On the contrary, the lowest brightness (48.82) on the first day was in the group treated with citric acid. It is thought that this difference is due to the acid treatment in the study, which was initiated with shrimp samples displaying the same characteristics. The two groups with the highest brightness values on the last day of the storage were HDD (45.61) and LDD (45.83) chitosan-treated samples. The differences between the control, chitosan, sodium metabisulfite, and citric acid groups in the L* value were statistically significant. Likewise, dullness/darkening in all groups from the first to the last day of the storage was statistically significant. The a* value, of which negative (-) values on the color scale represent greenness and positive (+) values represent redness, increased in the positive direction in all samples. The lowest value on day 0 was 1.94 in the citric acid group, whereas the highest was 4.16 in the control-ice group. On the 12th day of the study, the highest value of 7.29 was observed in the control-water group, and the lowest value of 4.71 was observed in the HDD chitosan group. The differences between groups and within the same group on different days were statistically significant. The initial pink color on the first day gradually changed to red, and the areas where the melanosis was first observed were determined as the darkest red areas.
For this reason, the +a* value can be proposed as another parameter of blackening occurring in deep-water rose shrimp samples. The b* value, of which negative (-) values represent blue color and positive (+) values represent yellow color in the HunterLab color system, was measured in the control-water group as the lowest (10.14) on the first day of the study, while the highest was detected in the control-ice group with 12.83 on the same day. The differences between groups on the first day were statistically significant. Furthermore, the differences within all groups on different days were also significant. The lowest b* value was detected in the HDD chitosan group at 17.73, whereas the highest was in the citric acid group at 21.77.
Chroma, hue, and whiteness values were computed using the color data obtained throughout the study. According to the calculations, the chroma value was the highest in the control-ice group, with 13.51 on day 0, and the lowest in the control-water group, with a value of 10.47. On the last day of the study, the lowest value was observed in the HDD chitosan group at 18.35, and the highest value was determined in the citric acid group at 22.96. According to the data obtained, the differences between groups on the first day of the study were statistically insignificant. However, the differences within all groups depending on the duration were determined to be statistically significant.
Regarding the hue value, at the beginning of the study, the lowest value was found in the sodium metabisulfite group at 1.24, and the highest value was determined in the citric acid group at 1.39. On the last day, these values were the lowest in the sodium metabisulfite and control-water groups, with 1.24, and the highest in the HDD chitosan group, with 1.30. There was no statistically significant difference in the hue value between the groups on the first and last days of the study. Another calculated parameter is whiteness. According to the whiteness calculations, the lowest value was found in the citric acid group, with 47.63 on the first day, and the highest value was determined in the HDD chitosan group, with 49.91 on the same day. On the last day of the study, the lowest value (36.75) was obtained in the control-water group, and the highest value (42.55) was obtained in the HDD chitosan group. The differences detected between groups and between days were found to be statistically significant both at the beginning and end of the study.
Digital Image Processing
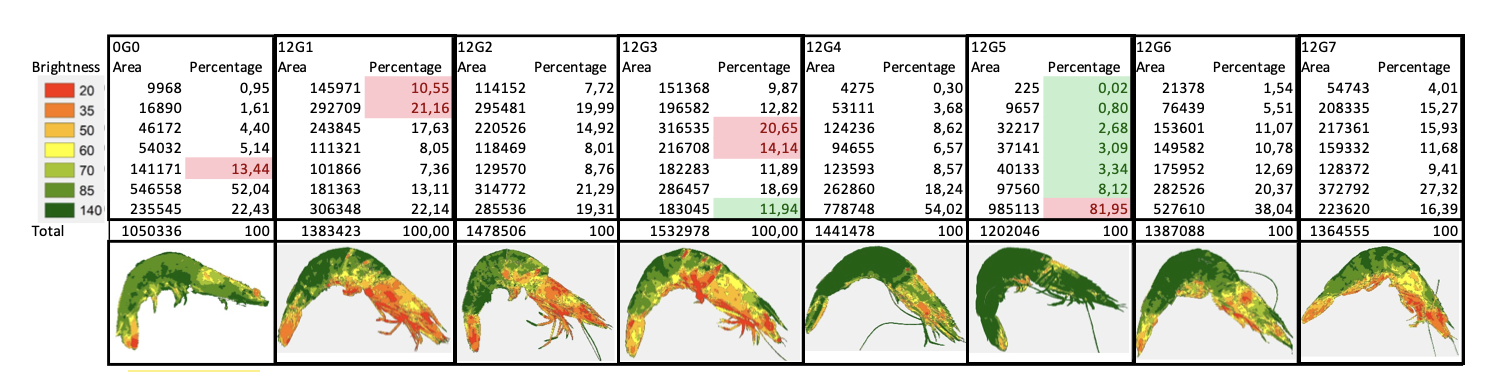
The results of the image processing analysis, conducted in addition to the subjective results obtained in the sensory evaluation, are given in Figure 6.

The results obtained through the image processing analysis showed parallelism with the results obtained through the sensory evaluation. According to the analysis results, less than 1% of the total surface area was detected as a melanosis formation region in the fresh sample. This value was determined as 10.55%, 7.72%, and 9.87% in the G1, G2, and G3 control groups, respectively, on the last day of the study. The lowest levels in the study were determined to be in the G4 and G5 groups, representing groups treated with chitosan, remaining at 0.30% and 0.02, respectively. On the other hand, it was determined as 1.54% and 4.01% in the G6 and G7 groups, consisting of the most widely used commercial preservatives (i.e., sodium metabisulfite and citric acid) for the prevention of melanosis formation in shrimps, respectively. The image processing analysis results obtained in the study revealed that commercial chemicals, i.e., sodium metabisulfite and citric acid, were effective in delaying the formation of melanosis in deep-water rose shrimp; however, the most effective additives were natural HDD and LDD chitosan.
Discussion
Chitosan, the most common biopolymer in nature after cellulose, has a wide range of applications due to its properties. It can be used in many areas, including agriculture, food, cosmetics, pharmacy, medicine, and engineering. The primary sources of chitosan and its derivatives are fungi, shellfish and some terrestrial animals (e.g., insects).42–44 When choosing the preparation method of chitosan, a functionalised method suitable for the purpose should be preferred. It is mandatory to determine the product’s properties to be used in a study each time because it can be obtained from many different sources, and its unique functional properties vary depending on the production method. For this reason, to begin with, the physicochemical properties of chitosan were determined. The deacetylation degrees of the extracted chitosan used in the study, determined by two different methods, were 99.50 and 89.51% for high deacetylation degree and 76.31 and 78.24% for low deacetylation degree. In addition to the deacetylation degree, viscosity and color values were found to be similar to the values obtained both in commercial products and in other previous research.17,45–53
FT-IR spectroscopy is used for the identification of organic compounds. The IR spectrum of all compounds is different except for optical isomers, and the IR region is located between the visible light and microwave regions in the electromagnetic spectrum. This region is between 4000-450cm-1 wavelength. The peak values obtained in the study, i.e., between 423cm-1, 661cm-1, and 660cm-1, are named “fingerprint peaks” of chitosan with two different deacetylation degrees, HDD and LDD, respectively. The spectrum expressing the C2 position (C=O) of glucosamines, one of the main groups of chitosan compounds, was observed at 1024cm-1 and 1029cm-1 wavelengths. The absorbance value representing the C-O-C bonds in the ring structure was determined at 1150cm-1 wavelength in both samples. The absorbances specified as the stretching vibration peak in the CH2 group were observed at 1417cm-1 and 1407cm-1 wavelengths. C=O-C-N bonds were only detected in HDD chitosan at a wavelength of 1584 cm-1. Moreover, the peaks representing OH bonds in hydroxyl groups were observed between 3275cm-1 and 3357cm-1 in HDD chitosan, while they were observed only at 3352cm-1 in LDD chitosan (Figure 3). The FT-IR analysis results of similar studies in the existing literature are consistent with the present study.12,19,21,46,53,54
XRD analysis is based on the principle that each crystal refracts x-rays in a characteristic pattern, depending on the specific atomic arrangement of the phase. The crystallinity of chitin and chitosan consists of two main peaks due to hydrogen bonds between the hydroxyl and N-acetyl main groups.55 The main characteristic chitosan peak may not appear in the analysis results in some cases due to disruption of the interpolymer bands. It was observed in the present study that chitosan obtained from different shellfish products displayed two main characteristic crystalline peaks (Figure 3).
SEM image analysis of HDD and LDD chitosan extracted within the scope of the study was performed on images obtained at 10.00kV energy level with 40.000x magnification (Figure 4). It was observed that the morphological properties of chitosan samples varied with the change in deacetylation degrees. In general, in terms of morphology, it was visible that the filamentous structure of chitosan increased in the higher deacetylation degree. These structural differences may have emerged according to the method used and deacetylation degree or may be species-specific. In a similar study, where chemical extraction of chitosan was performed on shrimp and crayfish shells, it was stated that the surface morphologies of chitosan obtained from different sources were different according to the SEM results. It was reported that the surface of the chitosan obtained from shrimp shells displayed a smoother appearance, whereas the chitosan obtained from crayfish shells had a three-dimensional surface appearance.47,54,56
The second phase of the research was conducted to determine whether the characterized chitosan and other widely used chemicals prevent melanosis in shrimp. Chitosan and other chemicals were applied to freshly obtained shrimp samples by immersion. Shrimps prepared this way were stored refrigerated for 12 days, and melanosis formation was monitored. The melanosis degree in shrimps was assessed according to the sensory evaluation scale of Otwell and Marshall.26 According to the evaluation results in this scale, positive effects of both chitosan groups, sodium metabisulfite, and citric acid groups were observed in delaying melanosis. After the 6th day of the storage, it was determined that the groups treated with 0.5% LDD chitosan and sodium metabisulfite were in a notably better condition than the others.
On the other hand, the high deacetylation degree chitosan group exhibited a lower impact than these two groups. In general, it was observed that both high and low deacetylation degrees of chitosan are effective in delaying the formation of melanosis. Similar to the findings presented here, Bingöl et al.57 found in their study on the quality of frozen shrimps treated with chitosan that samples from all groups were consumable, even at the end of the storage period, according to the panelist evaluations. However, they reported that the control group samples received lower taste and odor scores than the treatment groups. Arancibia et al.58 investigated the melanosis change in shrimp (Penaeus vannamei) during storage with chitosan obtained from Litopenaeus vannamei processing wastes. They reported no variations among groups until the 5th day of storage, but the sensory properties declined drastically after the 5th day. In agreement with the present results, they reported that the chitosan-treated groups were in better condition than the control group.
Similarly, Imansari et al.59 aimed to prevent melanosis formation using mangrove plant extract during cold storage of shrimps. As a result of their study, it was concluded that mangrove plant extract can delay melanosis formation. Other researchers have also reported that melanosis formation is decelerated with different natural additives.58,60–62
The results obtained in sensory evaluation were supported by digital image processing analysis. This analysis method, which was employed for the first time in this kind of study, was carried out using E-cognition (by Definiens Developer) software. E-cognition software creates pixel segments by integrating image pixels according to their different properties (color, brightness, scale, shape, softness, etc.). Created pixel segments are classified according to their properties. The classified areas are distinguished by using segmentation algorithms, and the areas of distortion/color change are thusly determined. The image processing analysis results obtained in the study revealed that commercial chemicals, i.e., sodium metabisulfite and citric acid, were effective in delaying the formation of melanosis in deep-water rose shrimp; however, the most effective additives were natural HDD and LDD chitosan. Several studies have been carried out with chemical preservatives to decelerate the deterioration that occurs during the long shelf life, and favorable results have been obtained.60,61,63–65 However, it is possible to prevent melanosis and similar undesirable changes by utilizing natural products rather than chemical preservatives. Considering the increased shrimp capture and consumption in recent years, storage needs and increasing shelf life with natural additives are very important. Furthermore, it is critical to determine the quality of the products offered to the market rapidly and objectively.
To conclude, shrimps are captured in high quantities in our country, offered to the domestic market, and exported abroad. However, shrimp is an easily perishable food with a limited shelf life. The enzymatically shaped “melanosis” or “black spot,” which begins immediately after capture, is the leading factor limiting the shelf life. The development of methods to preserve the quality of this valuable food source for a more extended period or improvement in existing methods are among the primary expectations of the respective industry. In this study, along with commercially used sodium metabisulfite and citric acid, the effect of chitosan obtained from shrimp waste on this undesired quality change was investigated, and it was concluded that it would be appropriate to use such natural substances instead of commercial preservatives. In addition to the subjective panelist evaluation, this result was also demonstrated by digital image processing techniques, which enable obtaining fast, reliable, and objective results with the help of developing technology.
Data Availability Statement
The data are contained within the article, and the corresponding author can make more data available upon request.
Conflicts of Interest
The author declared no conflict of interest.
Author Contribution per CRediT
Investigation: Ali Eslem Kadak (Lead). Resources: Ali Eslem Kadak (Lead). Methodology: Ali Eslem Kadak (Lead). Formal Analysis: Ali Eslem Kadak (Lead). Visualization: Ali Eslem Kadak (Lead). Writing – original draft: Ali Eslem Kadak (Lead). Writing – review & editing: Ali Eslem Kadak (Lead). Funding acquisition: Ali Eslem Kadak (Lead).