Introduction
Golden pompano (Trachinotus ovatus) is a highly valued marine fish species known for its fast growth rate and delicious taste.1 With the rising demand for golden pompano, optimizing their growth and development by providing adequate nutrition becomes increasingly crucial.2 One important aspect in aquaculture is optimizing the target species’ growth rate and feed conversion efficiency. Various factors, including feed composition, play a vital role in determining the growth performance of fish. One potential feed ingredient that has gained attention in recent years is soybean meal (SBM), also known as soybean cake or soybean pulp,3,4 which is derived from the by-product of soybean oil extraction.
SBM is a widely available and cost-effective source of plant protein, making it an attractive choice for aquaculture feed formulation.5,6 It has been successfully used as a dietary component for various fish species due to its balanced amino acid profile and high digestibility,7,8 such as Siniperca chuatsi,9 Cyprinus carpio,10 Litopenaeus vannamei,11 Penaeus vannamei.12 However, it is well-known that fish species exhibit varying growth responses to SBM inclusion in their diets, which can be attributed to inter-species and intra-species differences.
Allometric growth, the differential growth rates of body parts or organs in relation to an organism’s overall size or mass, significantly affects the proportions and scaling of body structures, thereby influencing an organism’s functional and morphological characteristics.13,14 This phenomenon has been extensively studied in various fields, including developmental biology, evolutionary biology, and ecology, as it offers valuable insights into the mechanisms driving organismal diversity and adaptation, such as Scophthalmus maximus,15 Chasmodes saburrae,16 T. ovatus.17 Comprehending allometric growth is crucial for understanding biological systems’ intricate dynamics and interdependencies.17 Research on Allometry growth of marine fishes has been reported, including Seriola lalandi,18 Labidochromis caeruleus,19 and Lutjanus peru20, However, the available information on the transcriptomic response of golden pompano to SBM-based diets is limited. Investigating the molecular mechanisms behind the allometric growth effects of soybean meal in golden pompano can yield valuable insights for optimizing feed formulations.
Transcriptomic analysis is a powerful tool that simultaneously measures gene expression levels across the entire genome.1 It provides a comprehensive view of the cellular processes and pathways that specific dietary interventions affect.21 In the context of golden pompano aquaculture, transcriptomic analysis can help identify key genes and pathways associated with growth regulation and nutrient metabolism.
In recent years, there has been an increasing focus on understanding how the inclusion of SBM in fish diets affects their growth performance. However, there needs to be more information regarding how golden pompano specifically responds at the transcriptomic level to SBM-based diets. Therefore, this study aims to explore the variations in gene expression within individuals demonstrating allotrophic growth of golden pompano when subjected to a diet enriched with SBM. By understanding these transcriptional changes, we can gain valuable insights into the molecular mechanisms that underlie the growth and metabolism of this species. Ultimately, this information can be used to develop optimized aquafeed formulations for golden pompano, resulting in improved growth performance and feed conversion efficiency in aquaculture practices.
Materials and Methods
Production of feed
According to the formulated feed for golden pompano, the fermented soybean meal (FSM) feed was prepared. The feed formula was referenced in Liu et al.22 The nutritional components of the feed are as follows: crude protein content is 40.28 g * kg-1, crude protein content is 11.00 g * kg-1, and water content is 13.90 g * kg-1. All the materials are purchased from Guangdong Yinheng Biotechnology Co, Ltd. All materials are crushed and sieved for 60 mesh, made with a twin-screw granulator, and stored in a refrigerator at - 20℃ for standby.
Feeding management
The experimental fish were sourced from our research group’s breeding program, specifically from the golden pompano fish breed. 900 fish, all in good health and with no visible body surface damage, were selected. These fish were of the same size and had an initial weight of 80.02 ± 1.04 g. To conduct the experiment, the fish were randomly allotted to three cages, each measuring 3 * 3 * 3m, with each cage containing 300 fish. During the experiment, fish was fed to satiation at 7:00 am and 5:00 pm every day, lasted for 8 weeks. And the following water parameters were maintained: dissolved oxygen≥5.00 mg/L, the temperature at 27.5- 29.5 °C.
Sample collection
Before to sampling, golden pompano were stopped feeding for 24h, then the fish was sampled during anesthesia (MS-222). Nine individuals from the experiment were carefully chosen for the study, comprising of 9 fast-growing samples with an average weight of (120.01±1.05g) and 9 slow-growing samples with an average weight of (98.03 ± 1.08g). The livers of these selected fish were promptly removed, and a mixture of three fish was stored at -80℃ for further analysis. The liver samples sourced from the fast-growing individuals were labeled as Zgd, while the liver samples obtained from the slow-growing individuals were labeled as Zgx. For transcriptome analysis, the liver tissue was utilized. All experiments in this study were approved by the Animal Care and Use Committee of South China Sea Fisheries Research Institute, Chinese Academy of Fishery Sciences (no. SCSFRI96-253), and performed according to the regulations and guidelines established by this committee.
Transcriptome analysis
Total RNA was isolated from liver tissues using Trizol reagent (Invitrogen), according to the manufacturer’s protocol. RNA purity and integrity were assessed using NanoPhotometer ® spectrophotometer (IMPLEN, CA, USA) and RNA Nano 6000 Assay Kit (Agilent Technologies, CA, USA). Sequencing libraries were generated using NEBNext® UltraTM RNA Library Prep Kit for Illumina® (NEB, USA) according to the manufacturer’s instructions, and index codes were added to attribute sequences to each sample. According to the manufacturer’s instructions, library sequencing was performed on the Illumina Novaseq platform. Quality screening was performed, including calculating Q20, Q30, and GC content. Differential expression analysis was performed using the DESeq2 R package (1.16.1). Gene ontology (GO) and Kyoto Encyclopedia of Genes and Genomes enrichment analysis of differentially expressed genes (DEGs) were performed using the cluster Profiler R package.
Real-time quantitative PCR
The expression profiles of IGF-I, Hsp70, Hsp90, α2M, IGFBP-Ⅰ, and IGF-Ⅱ were determined by RT-qPCR to validate the transcriptome data. Gene-specific (IGF-I, Hsp70, Hsp90, α2M, IGFBP-Ⅰ, and IGF-Ⅱ) primers were designed using Primer Premier 6.0 software (Table 1). The qPCR reaction was performed according to the manufacturer’s instructions (TaKaRa). All PCR reactions were performed using 12.5 µL reaction volume containing 6.25 µL 2 × TB Green Premix Ex Taq II (Tli RNaseH Plus) (TaKaRa), 1 µL cDNA template, 0.5 µL each primer of forward and reverse and 4.25 µL of Milli-Q water. The relative expression of the genes was determined using the CT method (2−ΔΔCT) (Livak and Schmittgen, 2001).
Statistical analysis
The experimental data were analyzed using SPSS 22.0 software (IBM Corporation, New York, USA). Experimental results are expressed as mean ± standard error (SE). Significant differences were determined using one-way analysis of variance (ANOVA), followed by Tukey’s post hoc test, and means were considered statistically significant at p < 0.05.
Results
Sequencing data
Through transcriptome sequencing of liver samples, the Zgd group obtained an average of 8.82Gb of sequencing data, while the Zgx group obtained an average of 10.39Gb of sequencing data (Table 2). The analysis of base quality and composition data revealed that the GC content of each group ranged from 47.57% to 49.66%, indicating a balanced composition. Additionally, the base mass ratio of Q30 for each product was recorded at least 90.92%, indicating a high quality of sequencing data.
Gene expression distribution
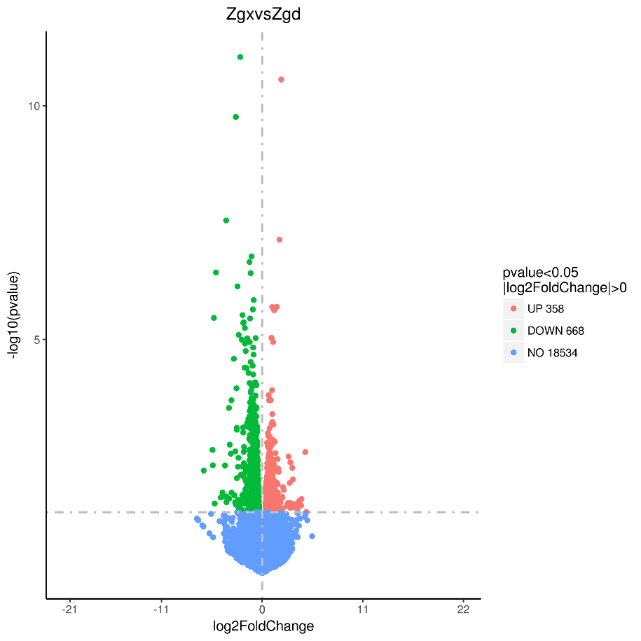
By conducting a comparative analysis of gene expression levels between allogeneic volcanic maps, we sequenced and analyzed liver samples obtained from two groups, namely Zgd and Zgx. As a result, we identified a total of 1026 differentially expressed genes, consisting of 358 up-regulated genes and 668 down-regulated genes (Figure 1).

GO annotation analysis of differential genes
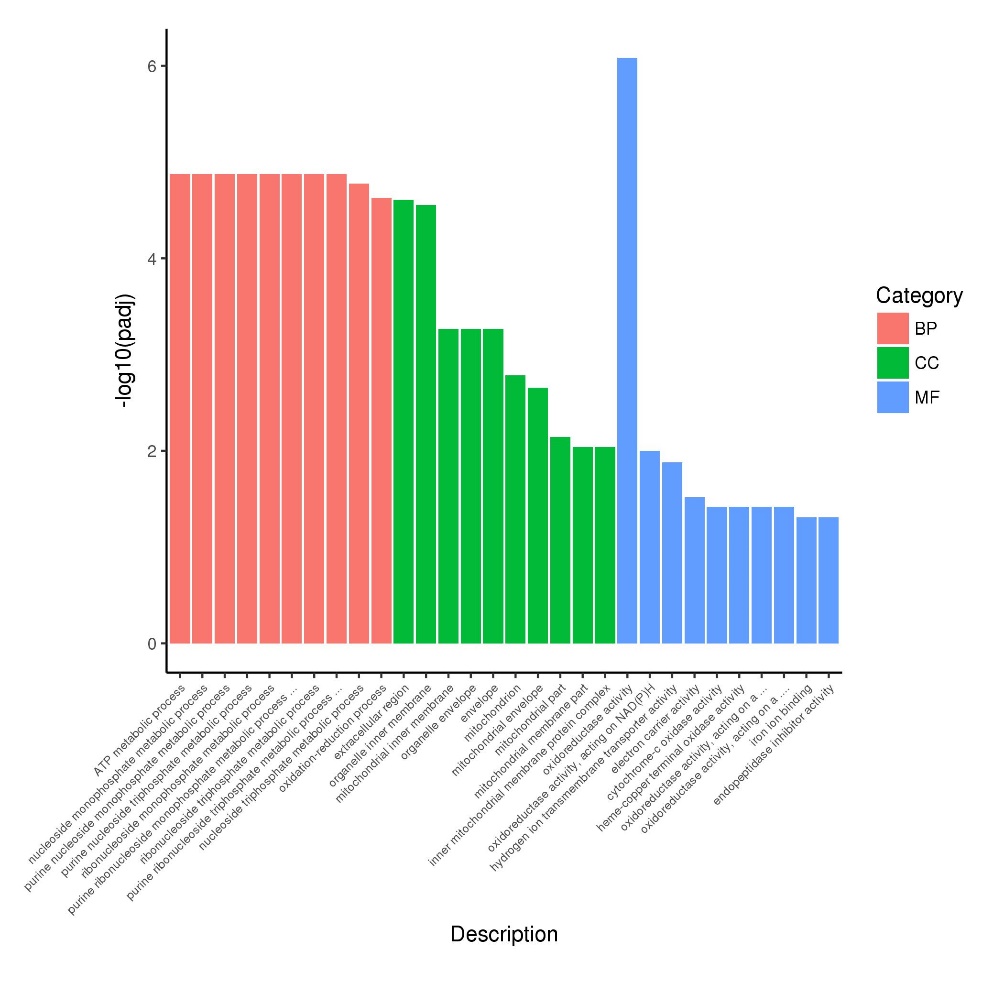
Performing GO enrichment analysis on differentially expressed genes among groups using the Cluster Profiler software, we selected the top 30 significantly different genes in each group to create a GO enrichment analysis histogram. In Figure 2, it is evident that the BP type in the two experimental groups is enriched with genes involved in ATP metabolism, nucleoside monophosphate metabolism, purine monophosphate metabolism, Ribonucleoside monophosphate metabolism, and purine monophosphate metabolism. The CC type, on the other hand, is enriched with genes related to the extracellular domain, organelle inner membrane, inner mitochondrial membrane, and organelle membrane pathway. Among the MF types, the most abundant genes are associated with oxidoreductase activity, hydrogen ion transmembrane transport activity, and electron carrier activity pathway.

KEGG annotation analysis of differential genes
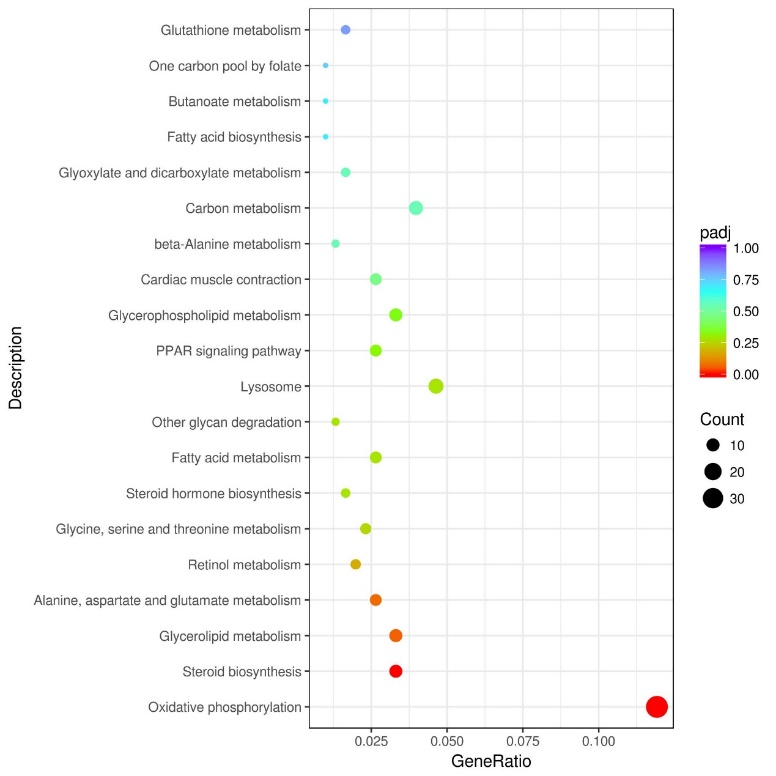
Based on the analysis of differential metabolic pathways between the Zgx and Zgd groups, we constructed a scatter plot to visualize the enrichment of differentially expressed genes (Figure 3). We observed significant gene enrichment in various pathways, including oxidative phosphorylation, steroid biosynthesis, glycerol ester metabolism, alanine, aspartic acid, glutamic acid metabolism, and retinol metabolic pathways. Among them, oxidative phosphorylation exhibited the highest level of gene enrichment, representing 14.3% of the total number of differential genes and showcasing its major role in the observed metabolic differences.

RNA-seq data validation
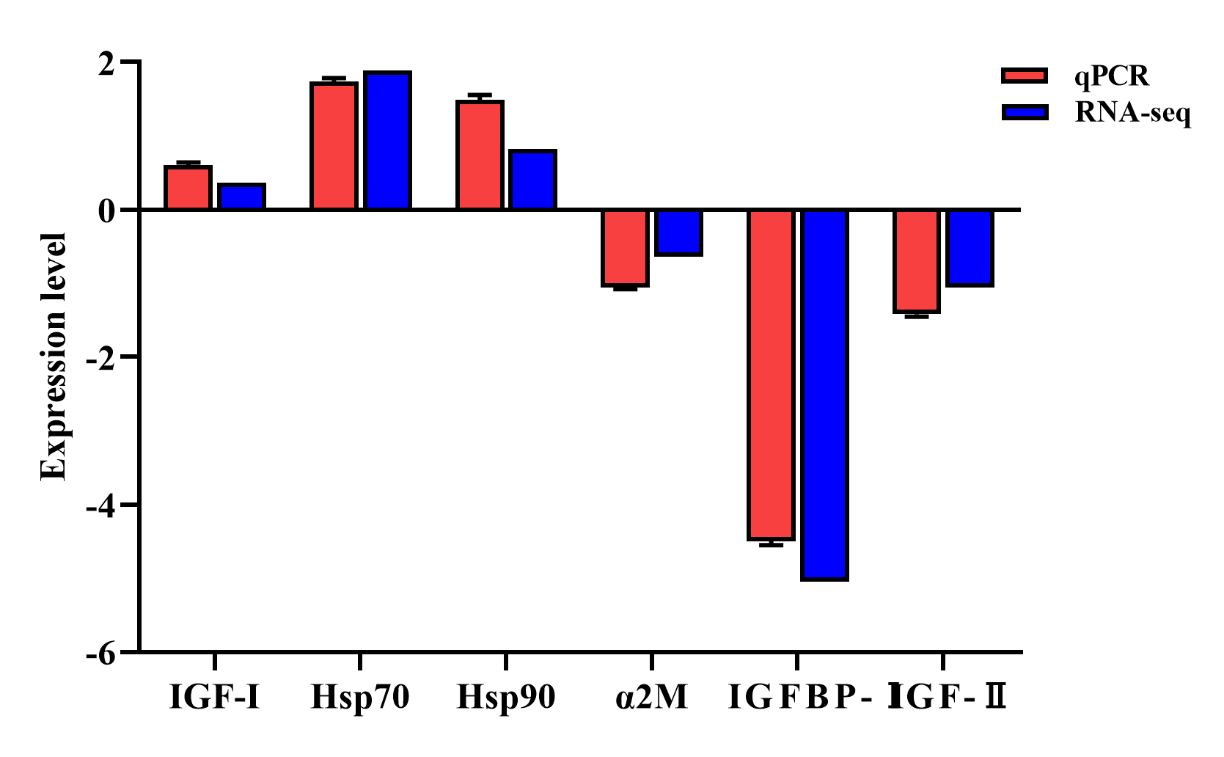
The expression profiles of three randomly selected genes (IGF-I, Hsp70, Hsp90, α2M, IGFBP-Ⅰ, and IGF-Ⅱ) were determined using qRT-PCR to validate the RNA-seq transcriptome data. The expression patterns of the three genes based on qRT-PCR were consistent with the RNA-seq data (Figure 4), indicating the specificity and accuracy of the transcriptome data. By allometric growth individuals, IGF-I, Hsp70, and Hsp9I were up-regulated, whileα2M, IGFBP-Ⅰ, and IGF-Ⅱ were down-regulated.
_dat.png)
Discussion
It is well established in aquaculture that fish reared under the same conditions and fed with identical feed can exhibit significant variations in their growth rates. This phenomenon has been attributed to several factors, including genetic differences, environmental conditions, and individual variations in digestion and absorption of nutrients.13 One possible explanation for the observed growth differences among fish consuming the same feed could be attributed to variations in their digestive efficiency. Each fish possesses a unique set of digestive enzymes and gut microbial communities that play crucial roles in breaking down feed components and facilitating nutrient assimilation. Genetic variations among individuals can result in differences in the expression and activity of these enzymes, leading to variations in the efficiency of feed digestion.18
Furthermore, environmental conditions, such as water temperature and quality, can influence fish’s metabolic rate and appetite.16 These factors, in turn, can impact individual fish’s feeding behavior and nutrient uptake, potentially leading to variations in growth performance. Another consideration is the competitiveness for feed among fish in a shared-rearing environment. Dominant individuals may have better access to feed resources, consuming a larger portion of the available feed and consequently exhibiting faster growth rates than their subordinate counterparts.17 In conclusion, the observed growth differences among fish consuming the same feed can be attributed to genetic variations, individual differences in digestion and absorption capabilities, environmental factors, and social interactions.20 Understanding and managing these factors is crucial for optimizing feed conversion efficiency and ensuring uniform growth in aquaculture practices.
The findings from this experiment unveil that T. ovatus, when provided with identical feed, exhibits distinct variations in the digestion and absorption processes, consequently leading to divergent outcomes in the growth and development of individual fish. A study reported 484 differentially expressed genes (DEGs) in Giant grouper individuals exhibiting growth variations, with an additional 27 DEGs identified within the growth-related QTL regions.23 Differential gene expression exerts vital control over various biological processes such as cell growth, signal transduction, carbohydrate metabolism, and bone development. The outcomes of this study not only enhance the genetic processes of molecular marker-assisted selection but also furnish novel insights into the molecular mechanisms that underlie the variability in animal growth. The horizontal comparison of correlation clusters revealed distinct differences in the patterns of gene expression alterations within the liver of T. ovatus individuals exhibiting different growth rates in the soybean meal group. We hypothesize that these differentially expressed genes within the liver may play a crucial role in facilitating the adaptation of fish bodies to the digestion and absorption of soybean meal-based feed.
Based on the GO enrichment and KEGG analysis findings, it is evident that the differential genes involved in biological processes are primarily associated with the redox process pathway. A total of 46 differential genes were found to be enriched in this pathway. The up-regulated genes in this pathway include γ- Butane hydroxylase (BBOX1) and methylenetetrahydrofolate reductase (MTHFR). Notably, BBOX1 is an enzyme known for its role in the biosynthesis of L-carnitine, a crucial molecule in the metabolism of fatty acids.24 In contrast, the down-regulated genes encompass Sarcosine dehydrogenase (SARDH), Transmembrane protein 147 (TMEM147), and Thyroxine deiodinase III. SARDH plays a pivotal role in the metabolism of Sarcosine, a glycine derivative, and is intricately involved in the functional control loop.25
On the other hand, Thyroxine deiodinase III is an enzyme that governs the metabolism of Thyroxine, playing a crucial role in the growth and development of vertebrates.26 Regarding cell composition, the extracellular domain is the primary region where differential genes are concentrated. Within this pathway, 32 genes exhibited differential expression, encompassing 7 up-regulated genes and 25 down-regulated genes. Some upregulated genes in this category include testosterone 2 (SPOCK2), insulin growth factor I (IGF-I), and so on. Among the down-regulated genes, notable examples include matrix metalloproteinase-9 (MMP-9), α-2-Macroglobulin (α2M), Insulin-like growth factor-Ⅱ (IGF-Ⅱ), and IGFBP-Ⅰ. IGFBP-Ⅰ functions as an inhibitory protein that binds to IGF and suppresses its subsequent actions in vivo, as demonstrated by Sun et al. in 2011. The α2M gene serves as a multifunctional protein and plays a crucial role in the innate immune functions of organisms.27 IGF-Ⅱ acts as a pivotal regulatory factor governing fish development, growth, and reproduction.28
Regarding molecular function, the differential genes primarily concentrate on the Oxidoreductase activity pathway, mirroring the biological process. This observation suggests that the redox pathway might be the principal factor influencing the differential gene expression between the two experimental groups. By investigating the response of liver tissue to the digestion of roughage in individuals with varying growth rates, identifying these differential genes has provided a basis for unraveling the molecular mechanisms involved in food digestion and absorption in T. ovatus.
By analyzing transcriptome data from various growth individuals in the SBM, we discovered significant alterations in the expression levels of 1026 genes between slow and fast-growth individuals. Further, GO and KEGG pathway enrichment analysis revealed that many differentially expressed genes were associated with oxidative phosphorylation, steroid biosynthesis, glyceride metabolism, alanine, aspartic acid, and glutamate metabolism. Identifying these differentially expressed genes serves as a foundation for unraveling the molecular mechanisms underlying growth and development and for the cloning and expression of growth-related genes. Additionally, these gene data provide valuable resources for future biological research.
Acknowledgments
This study was supported by Hainan Provincial National Science Foundation of China (320QN363), Key areas of Guangdong Province research and development projects (2021B0202020002), CARS-47, National Natural Science Foundation of China (U20A2064), Central Public-interest Scientific Institution Basal Research Fund CAFS (NO.2020TD29), and Central Public-Interest Scientific Institution Basal Research Fund, South China Sea Fisheries Research Institute, CAFS (NO.2021SD21).
Authors’ Contribution per CRediT
Conceptualization: Bo Liu (Equal), Bao-Suo Liu (Equal). Writing – original draft: Bo Liu (Lead). Writing – review & editing: Bo Liu (Equal), Bao-Suo Liu (Equal), Dian-Chang Zhang (Equal). Resources: Bo Liu (Equal), Bao-Suo Liu (Equal). Methodology: Hua-Yang Guo (Lead). Formal Analysis: Jing-Wen Yang (Equal), Nan Zhang (Equal). Investigation: Xian Lin (Equal), Ke-Cheng Zhu (Equal). Funding acquisition: Dian-Chang Zhang (Lead). Supervision: Dian-Chang Zhang (Lead).